. 2015 Jun 5;290(23):14361-80.
doi: 10.1074/jbc.M114.621706. Epub 2015 Apr 15.

Unbiased Cell-based Screening in a Neuronal Cell Model of Batten Disease Highlights an Interaction between Ca2+ Homeostasis, Autophagy, and CLN3 Protein Function

Affiliations

Unbiased Cell-based Screening in a Neuronal Cell Model of Batten Disease Highlights an Interaction between Ca2+ Homeostasis, Autophagy, and CLN3 Protein Function

Uma Chandrachud et al. J Biol Chem. .

Abstract

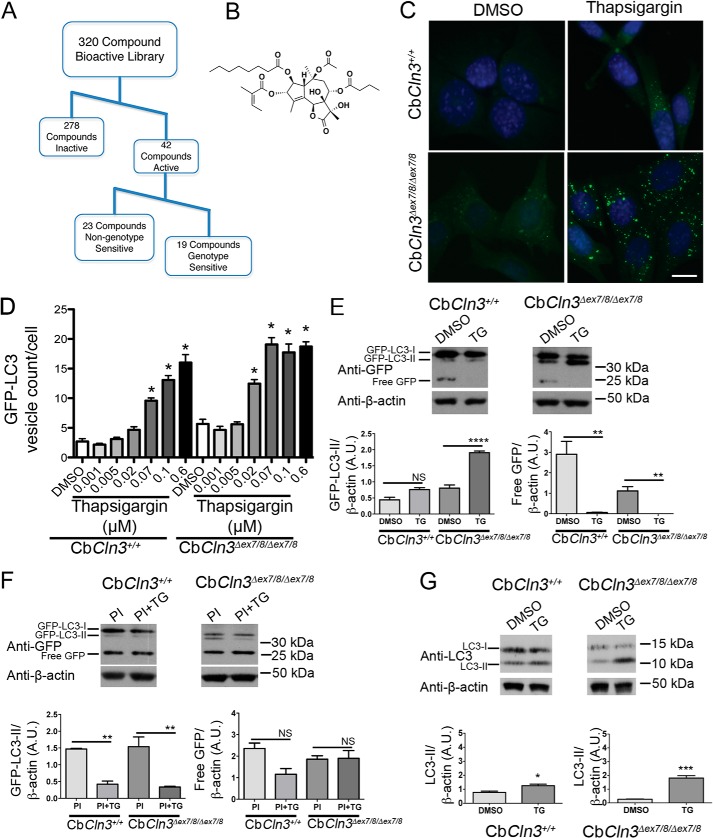
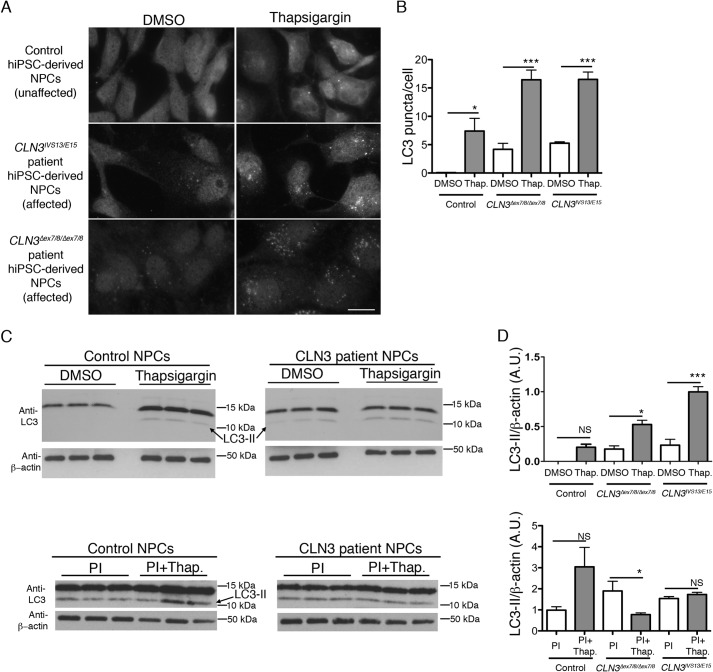
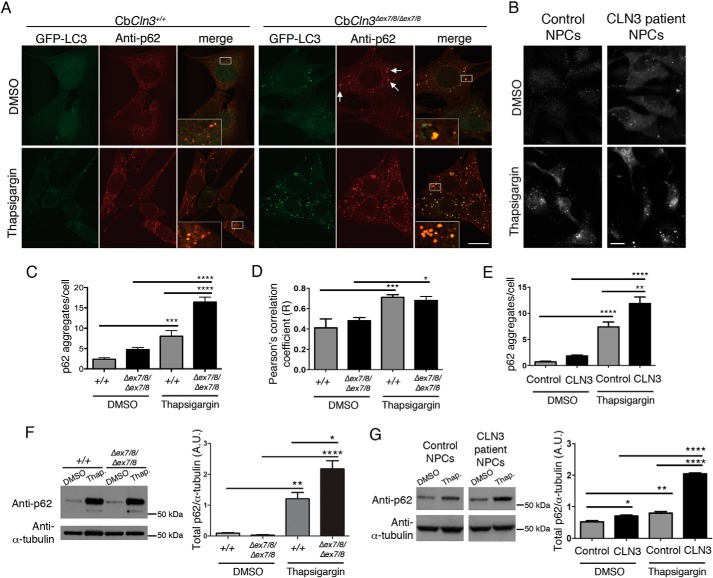
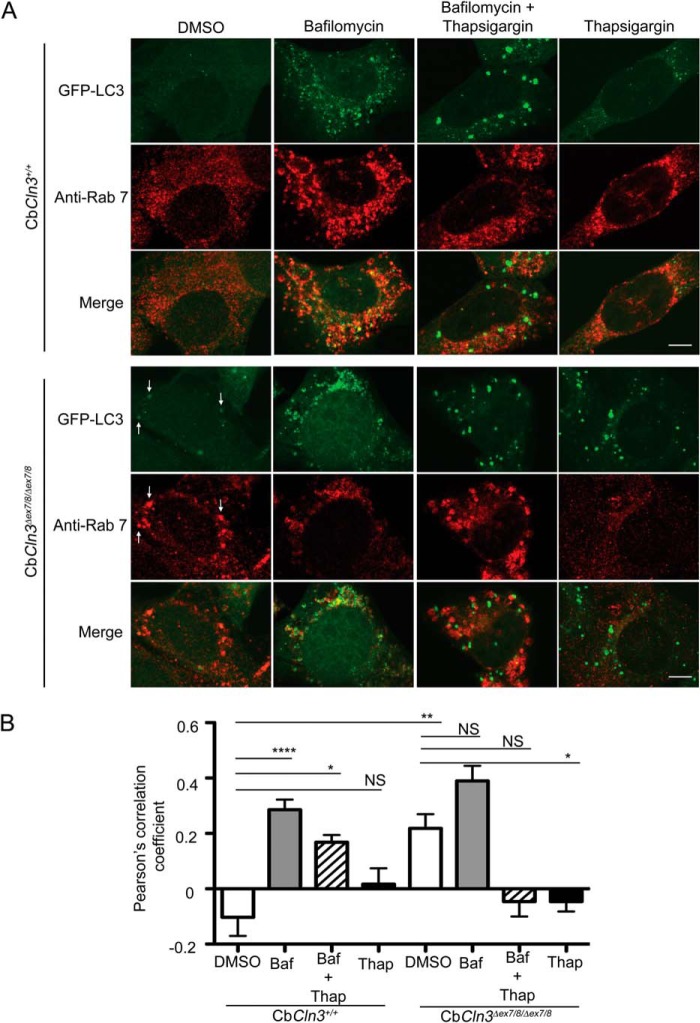
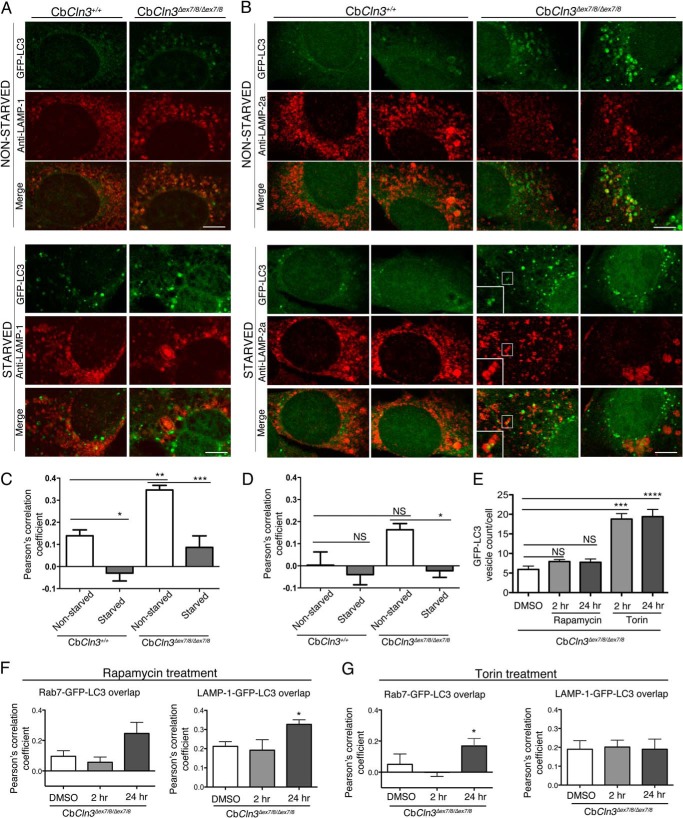
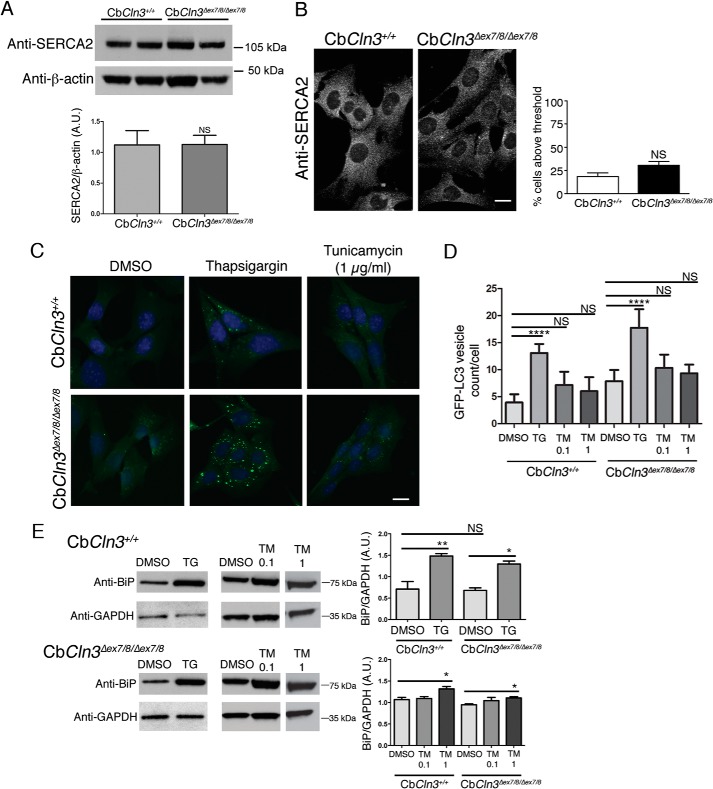
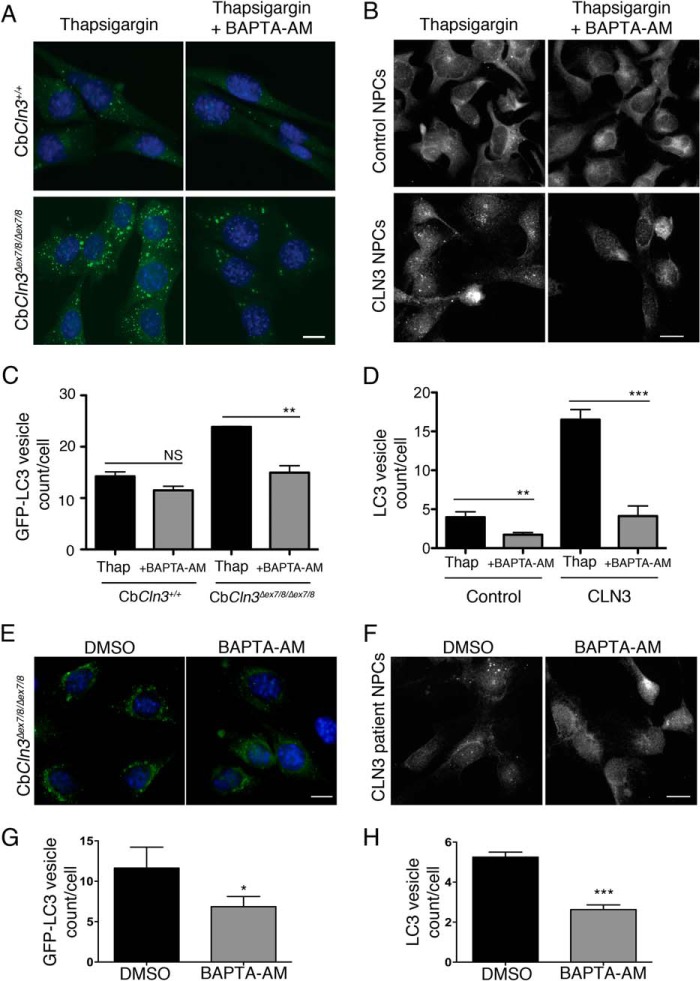
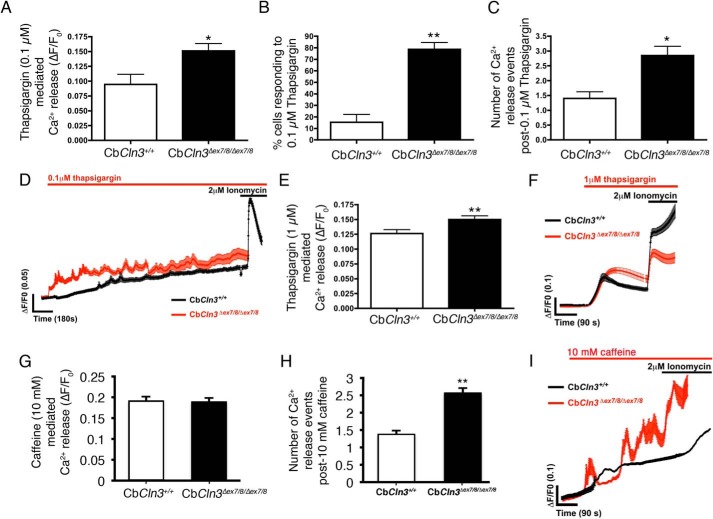
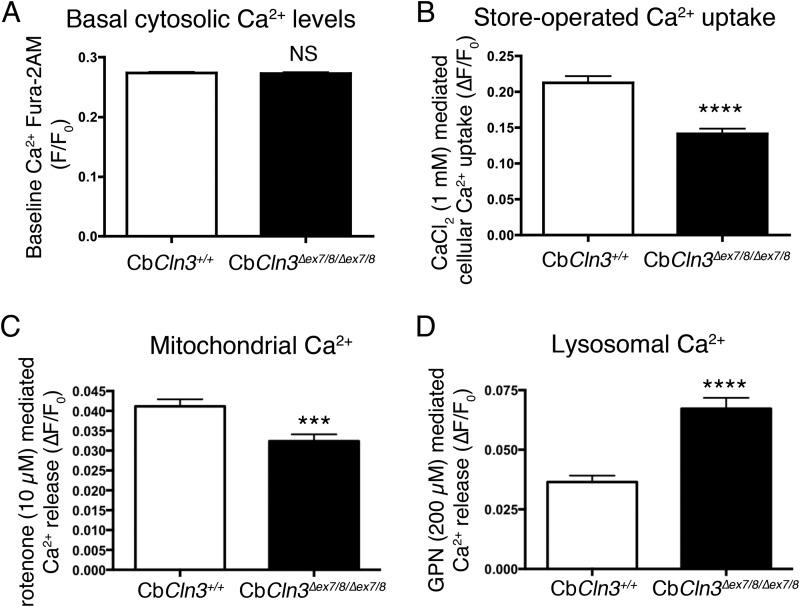
Abnormal accumulation of undigested macromolecules, often disease-specific, is a major feature of lysosomal and neurodegenerative disease and is frequently attributed to defective autophagy. The mechanistic underpinnings of the autophagy defects are the subject of intense research, which is aided by genetic disease models. To gain an improved understanding of the pathways regulating defective autophagy specifically in juvenile neuronal ceroid lipofuscinosis (JNCL or Batten disease), a neurodegenerative disease of childhood, we developed and piloted a GFP-microtubule-associated protein 1 light chain 3 (GFP-LC3) screening assay to identify, in an unbiased fashion, genotype-sensitive small molecule autophagy modifiers, employing a JNCL neuronal cell model bearing the most common disease mutation in CLN3. Thapsigargin, a sarco/endoplasmic reticulum Ca(2+)-ATPase (SERCA) Ca(2+) pump inhibitor, reproducibly displayed significantly more activity in the mouse JNCL cells, an effect that was also observed in human-induced pluripotent stem cell-derived JNCL neural progenitor cells. The mechanism of thapsigargin sensitivity was Ca(2+)-mediated, and autophagosome accumulation in JNCL cells could be reversed by Ca(2+) chelation. Interrogation of intracellular Ca(2+) handling highlighted alterations in endoplasmic reticulum, mitochondrial, and lysosomal Ca(2+) pools and in store-operated Ca(2+) uptake in JNCL cells. These results further support an important role for the CLN3 protein in intracellular Ca(2+) handling and in autophagic pathway flux and establish a powerful new platform for therapeutic screening.

Keywords: CLN3; GFP-LC3; autophagy; calcium; chemical biology; endoplasmic reticulum (ER); juvenile neuronal ceroid lipofuscinosis (JNCL); lysosomal storage disease; lysosome; thapsigargin.


Figures

FIGURE 1.
FIGURE 1.
CbCln3Δex7/8ex7/8 cell lines are more sensitive to thapsigargin treatment than CbCln3+/+ cells. A, workflow for hit identification and categorization of activities for our primary screening data is shown. B, structure of thapsigargin, a sesquiterpene lactone and a specific, noncompetitive inhibitor of the sarco/endoplasmic reticulum Ca2+-ATPase is shown. C, representative epifluorescence images are shown of wild type (CbCln3+/+) and homozygous CbCln3Δex7/8ex7/8 cells stably expressing GFP-LC3 (green) following DMSO or thapsigargin treatment. Nuclei were stained with DAPI. Scale bar, 10 μm D, GFP-LC3 vesicle counts per cell were quantified and plotted in the bar graph from dose-response analysis of thapsigargin (0.001–0.6 μm) in the CbCln3+/+ and CbCln3Δex7/8ex7/8 cells. Mean values are from N of 9–12 images per genotype/treatment (∼4–12 cells per image) from a representative experiment. Error bars represent S.D. Two-way ANOVA revealed a significant effect of genotype (p < 0.0001) and treatment (p < 0.0001) and a significant interaction effect (p < 0.0001). Statistical significance from post hoc Bonferroni analysis is shown (*, p < 0.0001). E, representative immunoblots probed with a GFP antibody are shown. Triplicate lysates prepared from CbCln3+/+ and CbCln3Δex7/8ex7/8 cells were assessed for relative forms of the GFP-LC3 transgene, including the cytoplasmic form (GFP-LC3-I), the autophagosome-associated form (GFP-LC3-II), and for free GFP. TG = thapsigargin and PI = protease inhibitors. Blotting for β-actin levels was used as a load control. Positions of the molecular weight standards are shown to the right of the immunoblots. kDa = kilodaltons. F, results from densitometry of GFP-LC3-II and free GFP bands on triplicate lysates are shown in the bar graphs. Statistical significance (Bonferroni) for the indicated comparisons (lines) are shown. NS, not significant, ****, p < 0.0001; **, p < 0.01. For E and F, samples for these analyses were run on the same blot; intervening replicate lanes were cropped from the blot images shown. G, representative immunoblots probed with an LC3 antibody to detect endogenous LC3-I and LC3-II are shown, and results from densitometry of LC3-II on triplicate lysates are shown in the bar graphs. Samples for this analysis from each cell line were run on separate blots; replicate lanes are cropped out. Statistical significance (Student's t test) values are shown. *, p < 0.05; ***, p < 0.001. A.U., arbitrary units.
FIGURE 2.
FIGURE 2.
Thapsigargin and autophagy analysis in human iPSC-derived neural progenitor cells from control and JNCL-affected subjects. A, representative epifluorescence images are shown from control (unaffected) and affected JNCL subject (CLN3IVS13/E15 and CLN3Δex7/8ex7/8) human iPSC-derived NPCs, immunostained to detect endogenous LC3. Scale bar, 10 μm. B, bar graph depicts the image analysis-based quantification of LC3-stained puncta (shown as mean LC3 puncta per cell) in the control and JNCL (CLN3) patient NPC lines, DMSO, or thapsigargin-treated (Thap). Two-way ANOVA revealed a significant effect of genotype (p < 0.0001) and treatment (p < 0.0001) and a significant interaction effect (p < 0.01). Statistical significance from post hoc Bonferroni analysis for the indicated comparisons is shown (**, p < 0.01; ****, p < 0.0001). Mean values were from 5 to 6 images per genotype/treatment (∼10–15 cells per image). C, representative immunoblots are shown for endogenous LC3 (anti-LC3; ∼11-kDa band = LC3-I, ∼14-kDa band = LC3-II) level analysis in cell lysates. Top panels are from DMSO or thapsigargin-treated control NPCs and CLN3 patient NPCs. Bottom panels are from protease inhibitor-treated or thapsigargin plus protease inhibitor-treated control and CLN3 patient NPCs. Three replicate lysate samples are shown for the indicated cell lines and treatment conditions. D, bar graphs depict results of densitometry performed on the ∼14-kDa band representing LC3-II, normalized to β-actin, and averaged from the indicated replicate lysates. Statistical significance (Bonferroni) for the indicated comparisons (lines), are shown. NS = not significant; *, p < 0.05; ***, p < 0.001. A.U., arbitrary units; PI, PI = protease inhibitor. Error bars represent S.E.
FIGURE 3.
FIGURE 3.
Thapsigargin induces p62/SQSTM1 accumulation in mouse cerebellar cells and human NPCs. A, representative confocal images are shown for p62 immunostaining (anti-p62, red) of wild type (CbCln3+/+) and homozygous CbCln3Δex7/8ex7/8 cells stably expressing GFP-LC3 (green), following DMSO or thapsigargin treatment. Zoomed insets are shown in the white-boxed regions in the merge panels to better display the extent of overlap of the GFP-LC3 and p62 signals (orange/yellow). White arrows point to examples of large p62-positive aggregates that were frequently observed in the homozygous CbCln3Δex7/8ex7/8 cells, even in the absence of thapsigargin. Scale bar, 10 μm. B, representative images are shown for p62 immunostaining of control and CLN3 patient NPCs, DMSO, or thapsigargin-treated. Scale bar, 10 μm. C, p62-stained aggregates were quantified by image-based analysis, as described under “Experimental Procedures,” and results from a representative experiment are displayed in the bar graph. Wild type (+/+), homozygous CbCln3Δex7/8ex7/8ex7/8/Δex7/8). Two-way ANOVA revealed a significant effect of genotype (p < 0.001) and treatment (p < 0.0001) and a significant interaction effect (p < 0.01). Statistical significance from post hoc Bonferroni analysis for the indicated comparisons is shown (***, p < 0.001; ****, p < 0.0001). D, Pearson's correlation coefficients for co-localization analysis (co-loc2, ImageJ/Fiji) of p62-GFP-LC3 signal overlap in wild type (+/+) and homozygous CbCln3Δex7/8ex7/8ex7/8/Δex7/8) cells, treated with DMSO or thapsigargin (Thap), are plotted in the displayed bar graph. Two-way ANOVA revealed a significant effect of treatment only (p < 0.0001). Statistical significance from post hoc Bonferroni analysis for the indicated comparisons is shown (*, p < 0.05; ***, p < 0.001). For C and D, error bars represent S.E. n = mean values from 9 to 12 images per genotype/treatment (∼4–8 cells per image), from a representative experiment. E, p62-stained aggregates in control and CLN3 patient NPCs were quantified by image-based analysis, as described under “Experimental Procedures,” and results from a representative experiment are displayed in the bar graph. Two-way ANOVA showed a significant effect of genotype (p < 0.001) and treatment (p < 0.0001) and a significant interaction effect (p < 0.05). Statistical significance from post hoc Bonferroni analysis for the indicated comparisons is shown (**, p < 0.01; ****, p < 0.0001). Mean values were from 7 to 8 images per genotype/treatment (∼15 cells per image). F and G, representative immunoblots of total p62 levels in cell lysates from DMSO or thapsigargin-treated (Thap.) wild type cells (+/+) and CbCln3Δex7/8ex7/8 cells (Δex7/8/Δex7/8) (F) and DMSO or thapsigargin-treated (Thap.) control and CLN3 patient NPCs (G) are shown. Samples for this analysis were run on the same blot; intervening replicate lanes were cropped from the blot images shown in G. In the Cb cell lysates, in addition to the expected ∼62-kDa band labeled with the anti-p62 antibody, an ∼52-kDa band was also observed following thapsigargin treatment. The identity of this band is unknown. The bar graphs depict results of densitometry performed on the ∼62-kDa band, normalized to α-tubulin, averaged from three replicate lysates, from a representative experiment. A.U., arbitrary units. Error bars represent S.E. Bonferroni analysis for the indicated comparisons are shown (*, p < 0.05; **, p < 0.01; ****, p < 0.0001).
FIGURE 4.
FIGURE 4.
Pharmacological dissection of autophagosome maturation in CbCln3+/+ and CbCln3Δex7/8ex7/8 cells. A, representative confocal images are shown for Rab7 (Anti-Rab7, red) immunostaining of wild type (CbCln3+/+) and homozygous CbCln3Δex7/8ex7/8 cells stably expressing GFP-LC3 (green), following DMSO or bafilomycin (1 μm, 24 h), thapsigargin (0.1 μm, 24 h), or combined treatment (1 μm bafilomycin and 0.1 μm thapsigargin, 24 h). Settings for confocal image capture were identical across the entire set of images. Enhanced contrast to images on the independent channels was applied uniformly within a given treatment set, but differed for the treatments (DMSO and Thapsigargin images were identically enhanced, and Bafilomycin and Bafilomycin + Thapsigargin images were identically enhanced). This was necessitated by large changes in the overall signal intensities due to the drug treatments and to ensure staining and degree of signal overlap could be visualized in the representative images shown. Scale bar, 5 μm. Note that bafilomycin treatment sensitized CbCln3+/+ cells to thapsigargin, mimicking the effect of the Cln3 mutation on thapsigargin response. To aid in visualization of the extent of co-localization in some panels, white arrows point to examples of structures with signal overlap. B, Pearson's correlation coefficients for automated co-localization analysis (co-loc2, ImageJ/Fiji) of Rab7-GFP-LC3 signal overlap in wild type and homozygous CbCln3Δex7/8ex7/8 cells, treated with DMSO, bafilomycin (Baf, 1 μm, 24 h), thapsigargin (Thap, 0.1 μm, 24 h), or combined treatment (Baf + Thap, 1 μm bafilomycin and 0.1 μm thapsigargin, 24 h), are plotted in the displayed bar graph. Bafilomycin significantly increased the Pearson's correlation coefficient compared with the virtual lack of co-localization observed in the DMSO-treated CbCln3+/+ cells (****, p < 0.0001). Intriguingly, however, bafilomycin did not significantly change the Pearson's correlation coefficient in CbCln3Δex7/8ex7/8 cells compared with that determined in DMSO-treated CbCln3Δex7/8ex7/8 cells, which was significantly higher than DMSO-treated CbCln3+/+ cells (**, p < 0.01). No co-localization of Rab7 signal with GFP-LC3 was observed in thapsigargin-treated CbCln3+/+ cells or CbCln3Δex7/8ex7/8 cells, and bafilomycin + thapsigargin co-treated CbCln3Δex7/8ex7/8 cells. Error bars represent S.E. n = mean values from 9 to 12 images per genotype/treatment (∼4–8 cells per image), from a representative experiment. *, p < 0.05; NS, not significant. Statistical significance values shown are from Bonferroni post hoc following two-way ANOVA (p < 0.0001 interaction, p < 0.0001 treatment).
FIGURE 5.
FIGURE 5.
Analysis of late endosome/lysosome overlap with GFP-LC3-labeled autophagic pathway structures. Representative confocal images are shown for LAMP-1 (Anti-LAMP-1, red) (A) or LAMP-2a (Anti-LAMP-2a, red) (B) immunostaining of wild type (CbCln3+/+) and homozygous CbCln3Δex7/8ex7/8 cells stably expressing GFP-LC3 (green), during normal growth (nonstarved) and following a 1-h starvation (starved). Settings for confocal image capture and enhanced contrast to images were applied identically across the entire set of images for each given marker. For LAMP-1 immunostaining, cells were methanol/acetone-fixed, although for LAMP-2a-immunostaining, cells were 4% paraformaldehyde-fixed and subsequently permeabilized with 0.2% saponin (see “Experimental Procedures” for more detailed staining methods). For LAMP-2a-immunostained cells, two representative cells are shown for each genotype and treatment condition, to demonstrate the significant cell-to-cell heterogeneity that was prominent for this marker, particularly in the CbCln3Δex7/8ex7/8 cells. White boxes demarcate zoomed regions in insets. Scale bar, 7.5 μm. C, D, F, and G, Pearson's correlation coefficients for automated co-localization analysis (co-loc2, ImageJ/Fiji) of LAMP-1-GFP-LC3 signal overlap (C), LAMP-2a-GFP-LC3 signal overlap in wild type and homozygous CbCln3Δex7/8ex7/8 cells (D), Rab7-GFP-LC3 and LAMP-1-GFP-LC3 signal overlap following rapamycin treatment of CbCln3Δex7/8ex7/8 cells (F), and Rab7-GFP-LC3 and LAMP-1-GFP-LC3 signal overlap following torin treatment of CbCln3Δex7/8ex7/8 cells (G) are plotted in the displayed bar graphs. ***, p < 0.001; **, p < 0.01; *, p < 0.05; NS = not significant. Significance values shown are from Bonferroni analysis. For both C and D, two-way ANOVA revealed a significant genotype effect (p < 0.001 and p < 0.05, respectively) and a significant treatment effect (p < 0.0001 and p < 0.01, respectively). E, image-based quantification of GFP-LC3 vesicle count per cell is shown for CbCln3Δex7/8ex7/8 cells treated with DMSO only or with rapamycin (2 μm) or torin (10 μm) for either a 2-h (2 hr) or 24-h (24 hr) treatment period. Data from the different drugs were analyzed separately. Significance values shown are from Bonferroni post-hoc analysis following one-way ANOVA. NS, not significant, ***, p < 0.001; ****, p < 0.0001. For all analyses shown in bar graphs, error bars represent S.E. n = mean values from 9 to 12 images per genotype/treatment (∼4–8 cells per image), from representative experiments.
FIGURE 6.
FIGURE 6.
Analysis of SERCA and ER stress. A, representative immunoblots are shown for wild type (CbCln3+/+) and mutant (CbCln3Δex7/8ex7/8) cells, probed with antibodies recognizing the major brain SERCA isoform, SERCA2 (Anti-SERCA2), and β-actin as a loading control. kDa, kilodaltons. Bar graph depicts densitometry results for relative total SERCA2 levels in CbCln3+/+ and CbCln3Δex7/8ex7/8 cells. Data are combined from five independent experiments, each with two to three technical replicates. Error bars represent S.E. No significant difference in SERCA2 levels was found (Student's t test). B, representative epifluorescence micrographs are shown from anti-SERCA2 immunostaining of CbCln3+/+ and CbCln3Δex7/8ex7/8 cells. Bar graph depicts quantification of fluorescence intensity as described under “Experimental Procedures” from four independent experiments (∼100 cells/experiment/genotype). Error bars represent S.E. No significant difference in SERCA2 was found (Student's t test). C, representative epifluorescence micrographs are shown for CbCln3+/+ and CbCln3Δex7/8ex7/8 cells expressing GFP-LC3, treated with DMSO only (DMSO), thapsigargin (0.1 μm), or tunicamycin (1 μg/ml) for 24 h. D, bar graph depicts results of image-based quantification of GFP-LC3 vesicle counts per cell. Mean values from n = 5–10 images per genotype/treatment (∼20 cells per image) from a representative experiment are shown. Error bars represent S.D. Two-way ANOVA showed a significant effect of genotype (p < 0.0001) and treatment (p < 0.0001). Statistical significance from post hoc Bonferroni analysis for the indicated comparisons is shown (****, p < 0.0001). E, immunoblot analysis for BiP (Anti-BiP) in CbCln3+/+ and CbCln3Δex7/8ex7/8 cells examining basal levels, and levels following thapsigargin (TG) or tunicamycin (TM, 0.1 or 1 μg/ml) treatment. Representative blots are shown. Replicate lysates for the thapsigargin analyses were run on the same blot, and replicate lanes were cropped for the figure. Replicate lysates for tunicamycin analyses were run on the same blot for a given cell line, and replicate lanes were cropped for the figure. GAPDH (Anti-GAPDH) was used as loading control, and densitometry was performed on the replicate lysates, with BiP normalized to GAPDH. Bonferroni analysis for the indicated comparisons is shown (*, p < 0.05; **, p < 0.01). Error bars represent S.E. For A–E, A.U., arbitrary units; NS, not significant; kDa, kilodaltons, micrograph scale bars are 10 μm.
FIGURE 7.
FIGURE 7.
Thapsigargin effect is mediated by Ca2+. For A, B, E, and F, representative epifluorescence images are shown for wild type (CbCln3+/+) and homozygous CbCln3Δex7/8ex7/8 cells stably expressing GFP-LC3 (green) (A and E) or control versus CLN3 patient NPCs immunostained for endogenous LC3 (B and F), following the indicated treatments. Images were captured for E and F with higher gain settings than those in A and B to visualize and quantify the less intensely fluorescent puncta that are typical for unstimulated (DMSO) and BAPTA-AM (1 h, 5 μm) conditions. Scale bars, 10 μm. C, D, G, and H, bar graphs depict results of image-based quantification of GFP-LC3 vesicle count per cell (C and G) or LC3 vesicle count per cell (D and H), for each indicated genotype and treatment condition. C and G, results shown are mean values from three independent experiments. Each experiment involved quantification of ∼10–20 images per genotype/treatment (∼4–12 cells per image). Error bars represent S.D. **, p < 0.01; *, p < 0.05 (Student's t test). D and H, results shown are mean values from 8 to 11 images per genotype/treatment (∼10–20 cells per image) from representative experiments. Error bars represent S.E. **, p < 0.01; ***, p < 0.001 (Student's t test).
FIGURE 8.
FIGURE 8.
Ca2+ analysis in response to thapsigargin treatment. A, bar graph depicts Ca2+ measurements in CbCln3+/+ (white bars) and CbCln3Δex7/8ex7/8 cells (black bars) using Fura-2AM (baseline normalized, ΔF/F0) following low-dose (100 nm) thapsigargin treatment. *, p < 0.05. B, bar graph depicts the number of cells in the fields of view that responded to 100 nm thapsigargin, expressed as a % of total cell number. **, p < 0.01. C, bar graph depicts the number of Ca2+ release events observed following 100 nm thapsigargin treatment in CbCln3+/+ and CbCln3Δex7/8ex7/8 cells. *, p < 0.05. D, fura-2AM (ΔF/F0) traces of CbCln3+/+ (black line) and CbCln3Δex7/8ex7/8 cells (red line) with low-dose (100 nm) thapsigargin treatment are shown. Multiple releases are evident as spikes in the traces, which were frequently observed over the recording period in the CbCln3Δex7/8ex7/8 cells and were only occasionally observed in the CbCln3+/+ cells. Recording following 2 μm ionomycin treatment shows emptying of the remaining ER Ca2+ pool. E, bar graph depicts Ca2+ measurements in CbCln3+/+ and CbCln3Δex7/8ex7/8 cells using Fura-2AM (baseline normalized, ΔF/F0) following 1 μm thapsigargin treatment. **, p < 0.01. F, fura-2AM (ΔF/F0) traces of CbCln3+/+ (black line) and CbCln3Δex7/8ex7/8 cells (red line) with 1 μm thapsigargin treatment are shown. A single release at this dose was evident in the traces, which was slightly higher in the CbCln3Δex7/8ex7/8 cells compared with CbCln3+/+ cells. Recording following 2 μm ionomycin treatment shows emptying of the remaining ER and nonlysosomal Ca2+ stores indicating cells remain viable. Error bars represent S.E. G, bar graph depicts Ca2+ measurements in CbCln3+/+ (white bars) and CbCln3Δex7/8ex7/8 cells (black bars) using Fura-2AM (baseline normalized, ΔF/F0) following 10 mm caffeine treatment to mobilize the ER pool from the ryanodine receptor. H, bar graph depicts the number of Ca2+ release events observed following 10 mm caffeine treatment in CbCln3+/+ and CbCln3Δex7/8ex7/8 cells. **, p < 0.01. I, fura-2AM (ΔF/F0) traces of CbCln3+/+ (black line, average from ∼100 cells) and CbCln3Δex7/8ex7/8 cells (red line, average from ∼100 cells) with 10 mm caffeine treatment in Ca2+-free buffer are shown. Multiple releases were evident as spikes in the traces during the recording period in the CbCln3Δex7/8ex7/8 cells. Recording following 2 μm ionomycin treatment shows emptying of the remaining ER Ca2+ pool. For Ca2+ measurements, ≥60 cells were analyzed from three to four independent experiments.
FIGURE 9.
FIGURE 9.
Store-operated uptake, mitochondrial and lysosomal Ca2+ measurements in CbCln3+/+ and CbCln3Δex7/8ex7/8 cells. A, bar graph depicts mean baseline Ca2+ measurements in CbCln3+/+ (white bars) and CbCln3Δex7/8ex7/8 cells (black bars) using Fura-2AM (F/F0). NS, not significant. n = 9 experiments, ≥150 cells analyzed. B, bar graph depicts Ca2+ uptake following 2 μm thapsigargin treatment to empty ER calcium stores in CbCln3+/+ and CbCln3Δex7/8ex7/8 cells using Fura-2AM (ΔF/F0). C, bar graph depicts Ca2+ measurements in CbCln3+/+ (white bars) and CbCln3Δex7/8ex7/8 cells (black bars) using Fura-2AM (ΔF/F0), in response to the mitochondrial uncoupling agent, rotenone (10 μm). ***, p < 0.001. D, bar graph depicts Ca2+ measurements in CbCln3+/+ and CbCln3Δex7/8ex7/8 cells using Fura-2AM (ΔF/F0), in response to 200 μm glycyl-l-phenylalanine-β-naphthylamide (GPN) after nonlysosomal stores had first been emptied with 2 μm ionomycin. ****, p < 0.0001. B–D, ≥50 cells were analyzed from three to four independent experiments. NS, not significant.

Similar articles

Cited by

References

    1. Mole S. E., Williams R. E., Goebel H. H. (eds) (2011) The Neuronal Ceroid Lipofuscinoses (Batten Disease), 2nd Ed., Oxford University Press, Oxford, UK
    1. Kollmann K., Uusi-Rauva K., Scifo E., Tyynelä J., Jalanko A., Braulke T. (2013) Cell biology and function of neuronal ceroid lipofuscinosis-related proteins. Biochim. Biophys. Acta 1832, 1866–1881 - PubMed
    1. Cotman S. L., Karaa A., Staropoli J. F., Sims K. B. (2013) Neuronal ceroid lipofuscinosis: impact of recent genetic advances and expansion of the clinicopathologic spectrum. Curr. Neurol. Neurosci. Rep. 13, 366. - PMC - PubMed
    1. Warrier V., Vieira M., Mole S. E. (2013) Genetic basis and phenotypic correlations of the neuronal ceroid lipofusinoses. Biochim. Biophys. Acta 1832, 1827–1830 - PubMed
    1. International Batten Disease Consortium (1995) Isolation of a novel gene underlying Batten disease, CLN3. The International Batten Disease Consortium. Cell 82, 949–957 - PubMed

Publication types

MeSH terms