. 2015 Apr 15;29(8):803-16.
doi: 10.1101/gad.255109.114. Epub 2015 Apr 15.

Myc and SAGA rewire an alternative splicing network during early somatic cell reprogramming

Affiliations

Myc and SAGA rewire an alternative splicing network during early somatic cell reprogramming

Calley L Hirsch et al. Genes Dev. .

Erratum in

Abstract

Embryonic stem cells are maintained in a self-renewing and pluripotent state by multiple regulatory pathways. Pluripotent-specific transcriptional networks are sequentially reactivated as somatic cells reprogram to achieve pluripotency. How epigenetic regulators modulate this process and contribute to somatic cell reprogramming is not clear. Here we performed a functional RNAi screen to identify the earliest epigenetic regulators required for reprogramming. We identified components of the SAGA histone acetyltransferase complex, in particular Gcn5, as critical regulators of reprogramming initiation. Furthermore, we showed in mouse pluripotent stem cells that Gcn5 strongly associates with Myc and that, upon initiation of somatic reprogramming, Gcn5 and Myc form a positive feed-forward loop that activates a distinct alternative splicing network and the early acquisition of pluripotency-associated splicing events. These studies expose a Myc-SAGA pathway that drives expression of an essential alternative splicing regulatory network during somatic cell reprogramming.

Keywords: Gcn5; Myc; SAGA; alternative splicing; iPSCs; reprogramming.


Figures

Figure 1.
Figure 1.
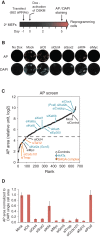
RNAi screen of epigenetic factors during the initiation phase of reprogramming. (A) Experimental representation of the functional RNAi screen. (B) Representative images from automated image analysis of AP-stained (top) and DAPI-stained (bottom) mock, siControl, siOct4, siSox2, siKlf4, and siMyc transfected cells. Stained cells are shown in white surrounded by red (AP; top) and blue (DAPI; bottom) colony masks used to quantify the stained area. (C) Result of the RNAi screen is displayed as a rank order plot of AP staining using log2 transformed values from the average area of two biological replicate experiments, each performed in duplicate. The control values are highlighted in white, while HATs are shown in blue, and hits from the SAGA complex are displayed in orange. The dotted gray line indicates the cutoff for targets within the lowest 15%. (D) AP area normalized to DAPI single-cell area for various conditions in the RNAi screen. Normalized AP area is shown relative to siControl. Error bars indicate standard error from two biological replicate experiments performed in duplicate.
Figure 2.
Figure 2.
Gcn5 bioChIP-seq in pluripotent cells. (A) Gcn5 expression decreases upon mESC differentiation. Quantitative RT–PCR (qRT–PCR) was performed to measure the mRNA levels of Oct4, Sox2, Nanog, Gcn5, and Pcaf in mESCs and embryoid bodies (EBs) differentiated for 3, 6, or 9 d. Error bars indicate SD from the mean (n = 2). (B) Specific enrichment of bio-Gcn5. The heat map shows signal densities of biotin, bio-Gcn5, and their inputs at 100-bp resolution within ±5 kb of 7499 Gcn5-binding sites. (C) The majority of Gcn5 binds close to the TSS. The pie chart shows the fraction of Gcn5-binding sites within a defined distance to the TSS of the closest gene. (D) Average binding profile of Gcn5. ChIP-seq signal density enrichments over input were plotted across an average gene structure for Gcn5 (black), Pol II (red), and H3K36me3 (purple). (E) Gcn5-binding sites resolve into five distinct clusters. The heat map is based on ChIP-seq signal densities of selected histone marks (H3K4me3, H3K27me3, H3K4me1, H3K27ac, H3K9K14ac, and H3K36me3), Pol II, and DNase-hypersensitive sites (HS) at 100-bp resolution within ±5 kb of 7499 Gcn5 binding sites.
Figure 3.
Figure 3.
Gcn5 is part of the Myc regulatory network in mESCs. (A) E2f1 and Myc:Max motifs are enriched at Gcn5-binding sites. (Top) The DNA-binding motifs identified within 300 base pairs (bp) of the top 1000 Gcn5 peak summits with associated P-values. (Bottom) Myc:Max and E2f1 consensus motif sequences obtained from the TRANSFAC database. (B) Gcn5 clusters with components of the Myc stem cell regulatory network (purple). Unsupervised hierarchical clustering of selected histone marks, transcription factors (TFs), and Gcn5. The Pearson correlation matrix is graphically displayed using the corrplot package in R and represents target similarity. The circle area demonstrates the absolute value of the corresponding correlation coefficients. The color scale indicates whether the correlation is positive (blue) or negative (red). The green and orange boxes encompass components of the core pluripotency network and the polycomb network, respectively. (C) Schematic of RNA-seq analysis. Expression values in wild-type and Gcn5−/− mESCs were normalized to spike-in standards. Differentially expressed genes were identified based on fold change of normalized expression values in wild-type versus Gcn5−/− mESCs. The pie chart indicates the fraction of Gcn5-induced and Gcn5-repressed genes. (D) Genes directly regulated by Gcn5 in mESCs. (Left) The Venn diagram indicates the overlap between Gcn5-bound genes and Gcn5-induced genes. (Right) The top five gene ontology (GO) terms of Gcn5 direct target genes. (E, top) The Venn diagram indicates that Gcn5-induced target genes overlap strongly with c-Myc-bound or n-Myc-bound and E2f1-bound genes in mESCs. (Bottom) The top three GO terms of Gcn5-induced target genes bound by c-Myc/n-Myc and E2f1.
Figure 4.
Figure 4.
Myc up-regulates Gcn5 expression levels during early somatic cell reprogramming. (A) Gcn5 mRNA expression increases during reprogramming. qRT–PCR quantification of Gcn5 mRNA levels across a time course of Dox-inducible reprogramming in secondary (2°) MEFs. (D) Days of Dox treatment. Error bars indicate SD from the average of four independent experiments. (B) Myc up-regulates Gcn5 mRNA expression during reprogramming. Secondary MEFs were transfected with siControl, siOct4, siSox2, siKlf4, and siMyc or under mock conditions 1 d prior to Dox exposure. Gcn5 mRNA levels were analyzed 2 d following Dox induction. Asterisks indicate t-test P value < 0.01 relative to siControl. Error bars indicate SD from the average of three independent experiments. (C) Myc binds the TSS of Gcn5. ChIP-qPCR was performed using c-Myc antibody and primers immediately upstream of the Kat2a (Gcn5) TSS in mESCs cells and secondary reprogramming MEFs cultured in the absence or presence of Dox for 2 or 3 d. (D) Days of Dox treatment. Error bars indicate SD from the average of two representative data sets. (D) Overexpression of Myc is sufficient to up-regulate Gcn5 and Ccdc101 mRNA levels. EGFP, mCherry, Oct4 (O), Sox2 (S), Klf4 (K), or c-Myc (M) was introduced into wild-type MEFs by lentiviral infection. Three days later, mRNA levels were analyzed. Error bars indicate SD from the average of three independent experiments.
Figure 5.
Figure 5.
Gcn5 and Myc coregulate a group of RNA splicing and RNA processing genes during early reprogramming. (A) The overlap between Myc- and Gcn5-bound genes increases during reprogramming. (Left) The Venn diagram indicates the overlap between Myc-bound genes in MEFs and Gcn5-bound genes in mESCs. (Right) The Venn diagram depicts genes bound by Myc at D2 of reprogramming and Gcn5-bound genes in mESCs. (B) Loss of Gcn5 and Myc in reprogramming cells generates similar gene expression profiles. Principal component projections of MEFs and D2 reprogramming cells upon knockdown of Myc and Gcn5, colored by their specific conditions (n = 2). (C) Myc and Gcn5 directly regulate a significant portion of their target genes during early reprogramming. (Top) The Venn diagram shows the overlap between Myc-induced genes and Myc-bound genes at D2 of reprogramming. (Bottom) The overlap between D2 Gcn5-induced genes and genes bound by Gcn5 in mESCs is displayed as a Venn diagram with the associated P-values. (D) Biological functional annotation of RNA-seq analysis for the top 200 Myc/Gcn5-induced and non-Myc/Gnc5-induced genes using the DAVID functional annotation tool.
Figure 6.
Figure 6.
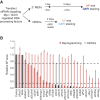
RNA processing factors regulated by Myc and Gcn5 are needed for reprogramming. (A) Schematic of RNAi screens performed in secondary (2°) reprogramming MEFs and mESCs. (B) Results of the RNAi screens performed in reprogramming cells (dark red) and mESCs (light red) are displayed and plotted by rank order of relative AP area compared with siControl cells. All controls samples are displayed as black bars for the reprogramming screen and gray for the mESC screen. The black dotted lines indicate cutoffs for the reprogramming (bottom) and mESC (top) screens. Error bars indicate the SD from three independent experiments.
Figure 7.
Figure 7.
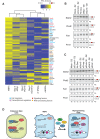
Gcn5 and Myc mediate an AS program during early reprogramming. (A) Heat map of Z-scores from PSI values in MEFs and D2 reprogramming cells transfected with siRNAs targeting Myc and Gcn5 and a nontargeting control. The average of two samples sets is plotted for 59 splicing events. The scale indicates high (yellow) to low (blue) PSI values. The biological functions of select genes are highlighted by color. (B,C) RT–PCR assays monitoring mRNA splicing levels of Slain2, Plod2, Fat1, and Pcm1 in MEFs and D2 reprogramming cells after knockdown of Myc or Gcn5 (B) or knockdown of Gcn5, Trrap, Ccdc101, Taf12, or Pcaf (C). Semiquantitative PSI values are displayed. The presence of the red exon denotes exon inclusion. Representative images from three independent experiments are shown. (D) Gcn5 and Myc cooperate to initiate a sequence of events centered on RNA splicing in reprogramming cells. (Left) In mESCs, Myc and E2f1 stimulate a feed-forward circuit by enhancing Gcn5 levels so that Gcn5 may occupy cell cycle factor (CCF)-related genes with Myc and E2f1. (Middle and right) At the onset of reprogramming, Myc interacts with the TSS of Gcn5 to stimulate Gcn5 expression and facilitate a positive feed-forward loop. Myc associates with Gcn5 in reprogramming cells to up-regulate the expression levels of splicing factors (SFs). The splicing factors mediate AS, primarily exon exclusion, to advance somatic cell reprogramming.

Similar articles

Cited by

References

    1. Ang YS, Tsai SY, Lee DF, Monk J, Su J, Ratnakumar K, Ding J, Ge Y, Darr H, Chang B, et al.2011. Wdr5 mediates self-renewal and reprogramming via the embryonic stem cell core transcriptional network. Cell 145: 183–197. - PMC - PubMed
    1. Apostolou E, Hochedlinger K. 2013. Chromatin dynamics during cellular reprogramming. Nature 502: 462–471. - PMC - PubMed
    1. Atlasi Y, Mowla SJ, Ziaee SA, Gokhale PJ, Andrews PW. 2008. OCT4 spliced variants are differentially expressed in human pluripotent and nonpluripotent cells. Stem Cells 26: 3068–3074. - PubMed
    1. Bian C, Xu C, Ruan J, Lee KK, Burke TL, Tempel W, Barsyte D, Li J, Wu M, Zhou BO, et al.2011. Sgf29 binds histone H3K4me2/3 and is required for SAGA complex recruitment and histone H3 acetylation. EMBO J 30: 2829–2842. - PMC - PubMed
    1. Bonnet J, Wang CY, Baptista T, Vincent SD, Hsiao WC, Stierle M, Kao CF, Tora L, Devys D. 2014. The SAGA coactivator complex acts on the whole transcribed genome and is required for RNA polymerase II transcription. Genes Dev 28: 1999–2012. - PMC - PubMed

Publication types

MeSH terms

Substances