

Sex, body mass index, and dietary fiber intake influence the human gut microbiome
- PMID: 25874569
- PMCID: PMC4398427
- DOI: 10.1371/journal.pone.0124599
Sex, body mass index, and dietary fiber intake influence the human gut microbiome
Abstract
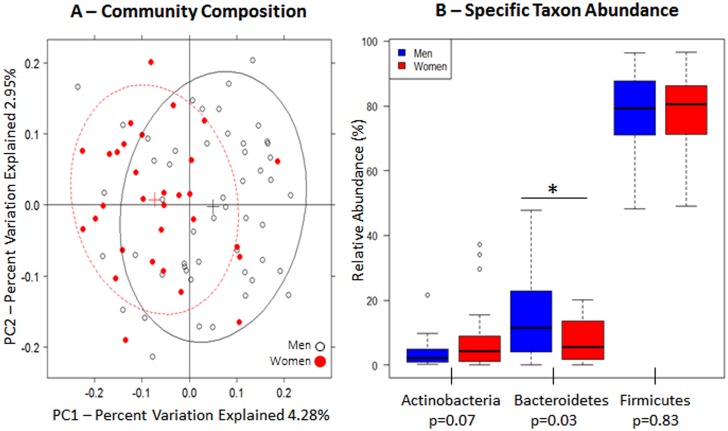
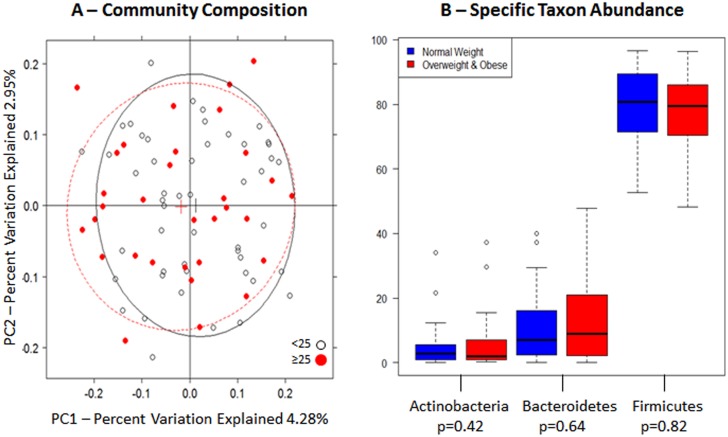
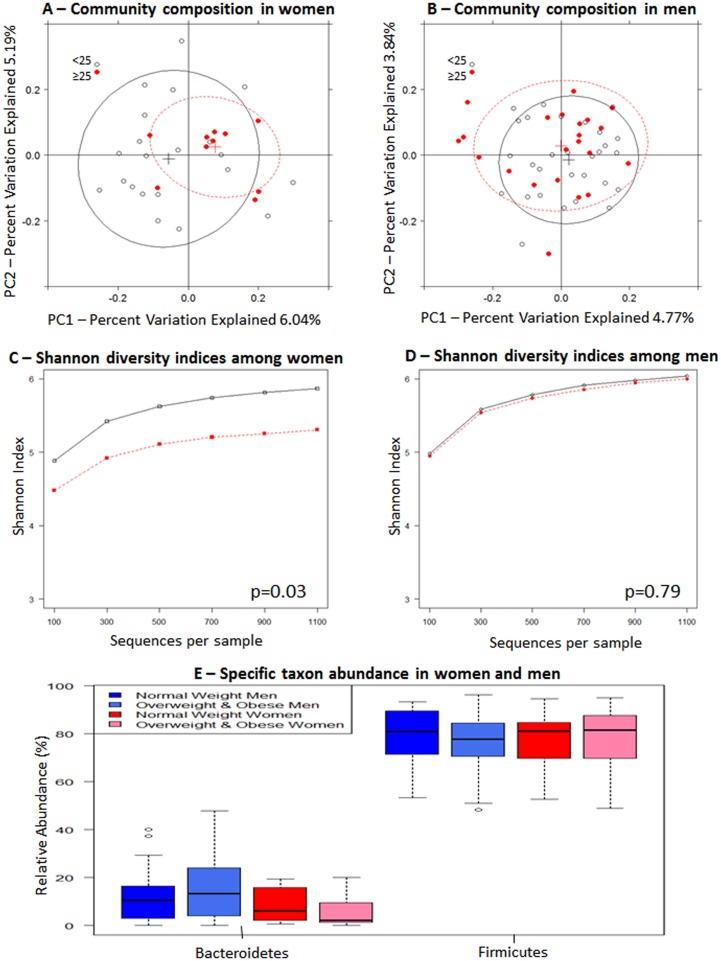
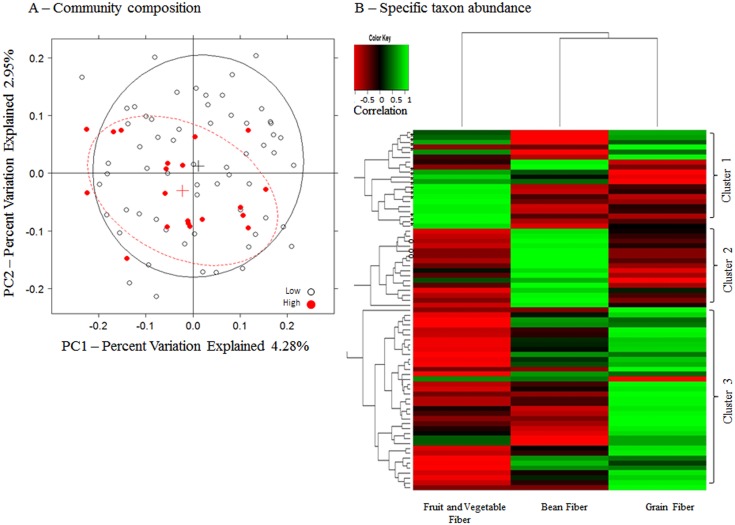
Increasing evidence suggests that the composition of the human gut microbiome is important in the etiology of human diseases; however, the personal factors that influence the gut microbiome composition are poorly characterized. Animal models point to sex hormone-related differentials in microbiome composition. In this study, we investigated the relationship of sex, body mass index (BMI) and dietary fiber intake with the gut microbiome in 82 humans. We sequenced fecal 16S rRNA genes by 454 FLX technology, then clustered and classified the reads to microbial genomes using the QIIME pipeline. Relationships of sex, BMI, and fiber intake with overall gut microbiome composition and specific taxon abundances were assessed by permutational MANOVA and multivariate logistic regression, respectively. We found that sex was associated with the gut microbiome composition overall (p=0.001). The gut microbiome in women was characterized by a lower abundance of Bacteroidetes (p=0.03). BMI (>25 kg/m2 vs. <25 kg/m2) was associated with the gut microbiome composition overall (p=0.05), and this relationship was strong in women (p=0.03) but not in men (p=0.29). Fiber from beans and from fruits and vegetables were associated, respectively, with greater abundance of Actinobacteria (p=0.006 and false discovery rate adjusted q=0.05) and Clostridia (p=0.009 and false discovery rate adjusted q=0.09). Our findings suggest that sex, BMI, and dietary fiber contribute to shaping the gut microbiome in humans. Better understanding of these relationships may have significant implications for gastrointestinal health and disease prevention.
Conflict of interest statement
Figures
Similar articles
-
Associations between Diet, the Gut Microbiome, and Short-Chain Fatty Acid Production among Older Caribbean Latino Adults.J Acad Nutr Diet. 2020 Dec;120(12):2047-2060.e6. doi: 10.1016/j.jand.2020.04.018. Epub 2020 Aug 12. J Acad Nutr Diet. 2020. PMID: 32798072
-
Low dietary fiber intake increases Collinsella abundance in the gut microbiota of overweight and obese pregnant women.Gut Microbes. 2018;9(3):189-201. doi: 10.1080/19490976.2017.1406584. Epub 2018 Mar 13. Gut Microbes. 2018. PMID: 29144833 Free PMC article.
-
Association of dietary fibre intake and gut microbiota in adults.Br J Nutr. 2018 Nov;120(9):1014-1022. doi: 10.1017/S0007114518002465. Br J Nutr. 2018. PMID: 30355393 Free PMC article.
-
Effect of fructans, prebiotics and fibres on the human gut microbiome assessed by 16S rRNA-based approaches: a review.Benef Microbes. 2020 Mar 27;11(2):101-129. doi: 10.3920/BM2019.0082. Epub 2020 Feb 19. Benef Microbes. 2020. PMID: 32073295 Review.
-
Fecal Microbiota Composition as a Metagenomic Biomarker of Dietary Intake.Int J Mol Sci. 2023 Mar 3;24(5):4918. doi: 10.3390/ijms24054918. Int J Mol Sci. 2023. PMID: 36902349 Free PMC article. Review.
Cited by
-
Gut microbiota of obese and diabetic Thai subjects and interplay with dietary habits and blood profiles.PeerJ. 2020 Aug 3;8:e9622. doi: 10.7717/peerj.9622. eCollection 2020. PeerJ. 2020. PMID: 32832269 Free PMC article.
-
Metabolic protection by the dietary flavonoid 7,8-dihydroxyflavone requires an intact gut microbiome.Front Nutr. 2022 Aug 17;9:987956. doi: 10.3389/fnut.2022.987956. eCollection 2022. Front Nutr. 2022. PMID: 36061902 Free PMC article.
-
Sex differences in rumen fermentation and microbiota of Tibetan goat.Microb Cell Fact. 2022 Apr 7;21(1):55. doi: 10.1186/s12934-022-01783-8. Microb Cell Fact. 2022. PMID: 35392919 Free PMC article.
-
Geographical location influences the composition of the gut microbiota in wild house mice (Mus musculus domesticus) at a fine spatial scale.PLoS One. 2019 Sep 26;14(9):e0222501. doi: 10.1371/journal.pone.0222501. eCollection 2019. PLoS One. 2019. PMID: 31557179 Free PMC article.
-
Drivers of gut microbiome variation within and between groups of a wild Malagasy primate.Microbiome. 2022 Feb 9;10(1):28. doi: 10.1186/s40168-021-01223-6. Microbiome. 2022. PMID: 35139921 Free PMC article.
References
-
- Savage DC. Microbial ecology of the gastrointestinal tract. Annual review of microbiology. 1977;31:107–33. - PubMed
Publication types
MeSH terms
Substances
Grants and funding
LinkOut - more resources
Full Text Sources
Other Literature Sources
Medical
