. 2015 Apr 28;112(17):E2174-81.
doi: 10.1073/pnas.1504880112. Epub 2015 Apr 13.

Mitofusin 2 ablation increases endoplasmic reticulum-mitochondria coupling

Affiliations

Mitofusin 2 ablation increases endoplasmic reticulum-mitochondria coupling

Riccardo Filadi et al. Proc Natl Acad Sci U S A. .

Abstract

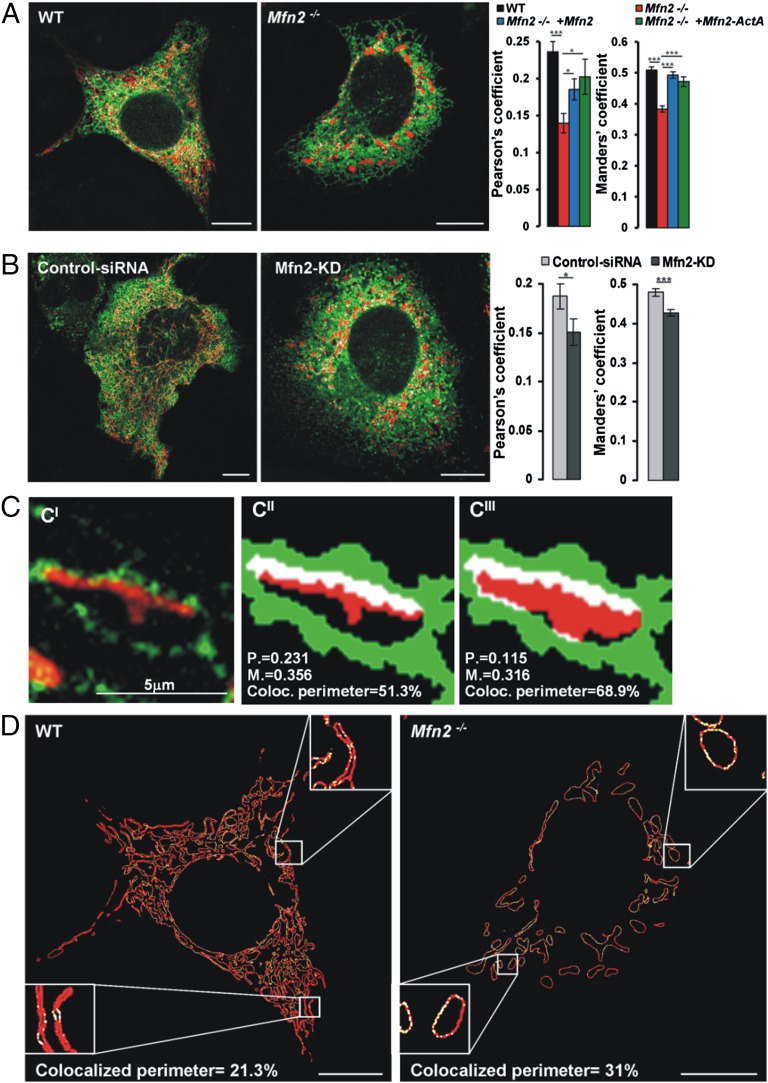
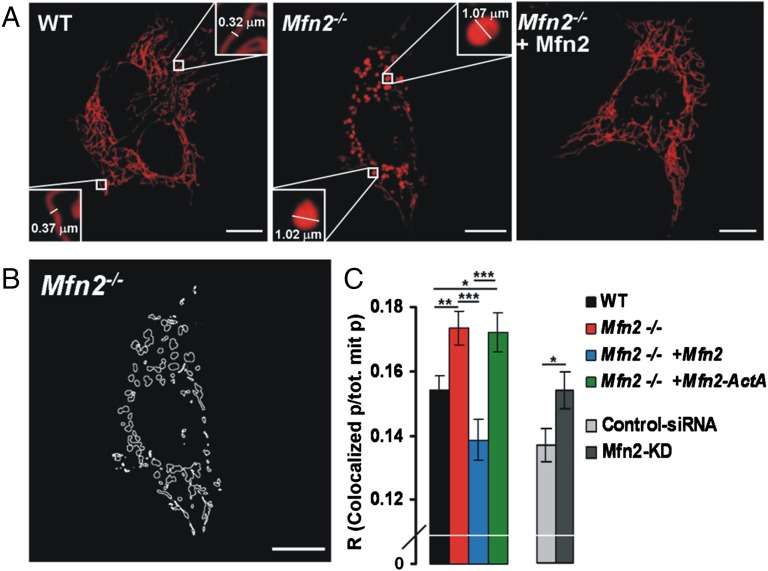
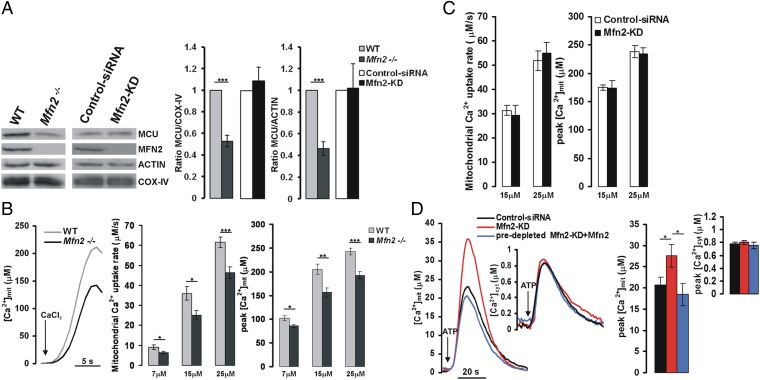
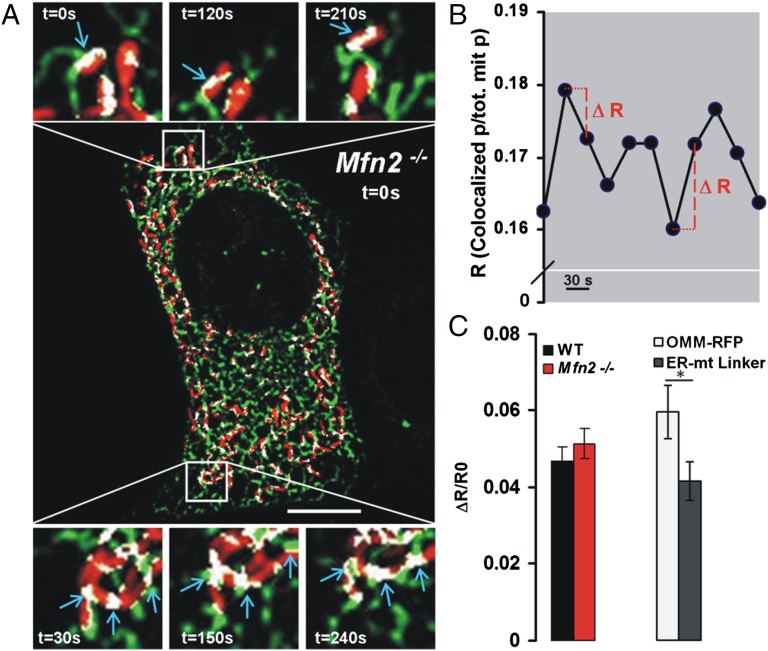
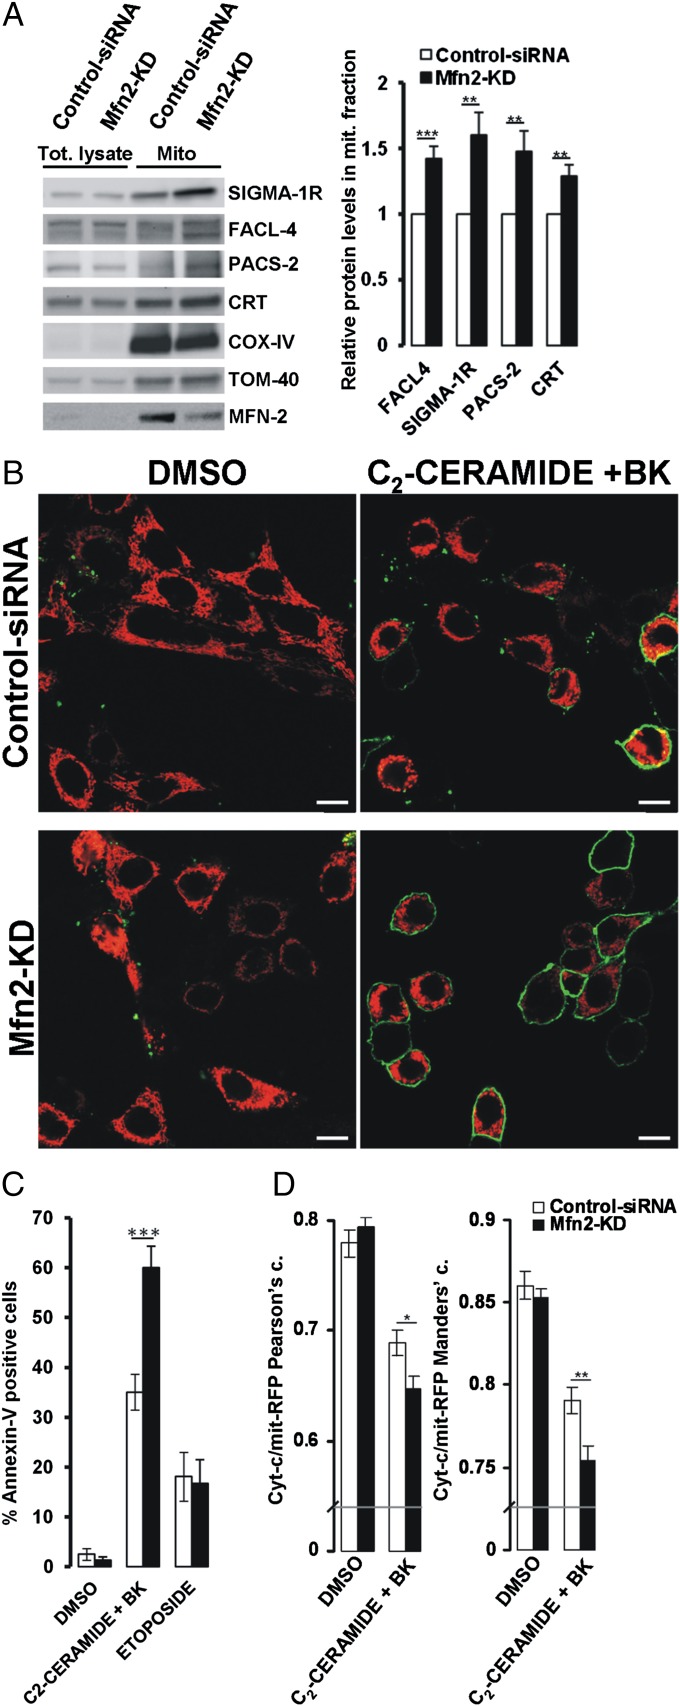
The organization and mutual interactions between endoplasmic reticulum (ER) and mitochondria modulate key aspects of cell pathophysiology. Several proteins have been suggested to be involved in keeping ER and mitochondria at a correct distance. Among them, in mammalian cells, mitofusin 2 (Mfn2), located on both the outer mitochondrial membrane and the ER surface, has been proposed to be a physical tether between the two organelles, forming homotypic interactions and heterocomplexes with its homolog Mfn1. Recently, this widely accepted model has been challenged using quantitative EM analysis. Using a multiplicity of morphological, biochemical, functional, and genetic approaches, we demonstrate that Mfn2 ablation increases the structural and functional ER-mitochondria coupling. In particular, we show that in different cell types Mfn2 ablation or silencing increases the close contacts between the two organelles and strengthens the efficacy of inositol trisphosphate (IP3)-induced Ca(2+) transfer from the ER to mitochondria, sensitizing cells to a mitochondrial Ca(2+) overload-dependent death. We also show that the previously reported discrepancy between electron and fluorescence microscopy data on ER-mitochondria proximity in Mfn2-ablated cells is only apparent. By using a different type of morphological analysis of fluorescent images that takes into account (and corrects for) the gross modifications in mitochondrial shape resulting from Mfn2 ablation, we demonstrate that an increased proximity between the organelles is also observed by confocal microscopy when Mfn2 levels are reduced. Based on these results, we propose a new model for ER-mitochondria juxtaposition in which Mfn2 works as a tethering antagonist preventing an excessive, potentially toxic, proximity between the two organelles.

Keywords: ER–mitochondria tethering; inter-organellar communication; mitofusin 2.


Conflict of interest statement

The authors declare no conflict of interest.

Figures

Fig. 1.
Fig. 1.
Mfn2 ablation/reduction increases close contacts between ER and mitochondria. (A and C) Representative EM images of WT and Mfn2−/− MEFs (A) or control siRNA and Mfn2-KD MEFs (C). Several close appositions (≤15 nm, indicated by arrowheads) are visible between ER cisternae and mitochondria (m) in WT/control siRNA MEFs and, more frequently, in Mfn2−/− (A) or Mfn2-KD (C) MEFs. (Scale bars, 0.5 μm.) (B, Left) Representative enlarged EM image of electron-dense proteinaceous structures in the region of close apposition between the organelles in Mfn2−/− MEFs. (Right) Average number of close contacts per mitochondrion observed in WT, Mfn2−/−, control siRNA, and Mfn2-KD MEFs. n = 735, 308, 253, and 165 mitochondria for WT, Mfn2−/−, control siRNA, and Mfn2-KD MEFs, respectively; results shown are the mean ± SEM of three independent experiments; ***P < 0.001.
Fig. 2.
Fig. 2.
ER–mitochondria colocalization analysis in Mfn2−/− and Mfn2-KD MEFs. (A and B) ER–mitochondria interactions in WT and Mfn2−/− (A) and control siRNA and Mfn2-KD (B) MEFs upon expression of mit-RFP and ER-GFP, as shown by confocal microscopy. (Scale bars, 10 μm.) Manders’ and Pearson’s coefficients are shown for each condition. n = 51, 68, 25, 14, 75, and 80 cells for WT, Mfn2−/−, Mfn2−/− + Mfn2, Mfn2−/− + Mfn2ActA, control siRNA, and Mfn2-KD MEFs, respectively. Results shown are the mean ± SEM of four independent experiments; *P < 0.05; ***P < 0.001. (C) The cartoon shows how marked changes in the mitochondrial area could result in an artificial decrease in the classical Mander’s (M.) and Pearson’s (P.) colocalization coefficients. (C′) Cropped fluorescence image (from a HeLa cell expressing mit-RFP and ER-GFP) showing a mitochondrion in contact with the ER. (C′′ and C′′′) Artificial reproductions of the image in C′ showing that M. and P. coefficients are decreased upon mitochondrial swelling (C′′′), although the percentage of mitochondrial perimeter in contact with the ER (Coloc. perimeter) is increased. (D) The images in A were analyzed with the perimeter plugin (Materials and Methods). Red pixels correspond to the whole mitochondrial perimeter profiles; yellow pixels represent the points in which the mitochondrial perimeter is in contact with the ER. Enlarged regions show increased perimeter colocalization (yellow pixels) in Mfn2−/− MEFs.
Fig. 3.
Fig. 3.
Mfn2 ablation/reduction increases ER–mitochondria surface juxtaposition. (A) Representative fluorescence images of the indicated MEF types expressing mit-RFP. Enlarged regions show the increased dimension of the minor axis of individual mitochondria. (Scale bars, 10 μm.) (B) Representative mitochondrial perimeter profile of the Mfn2−/− cell shown in A. (C) ER–mitochondria signal colocalization indexes, calculated as the ratio (R) between mitochondrial perimeter pixels colocalized with the ER and total mitochondrial perimeter pixels (Materials and Methods) for the indicated MEF types (n = 51, 68, 25, 14, 75, and 80 cells for WT, Mfn2−/−, Mfn2−/− + Mfn2, Mfn2−/− + Mfn2ActA, control siRNA, and Mfn2-KD MEFs, respectively). Data shown represent the mean ± SEM of four independent experiments; *P < 0.05; **P < 0.01; ***P < 0.001.
Fig. 4.
Fig. 4.
Mfn2 down-regulation increases ER–mitochondria Ca2+ transfer. (A, Left) MCU, MFN2, Actin and COX-IV expression levels in the indicated MEF types. (Right) Ratios (R) of the level of MCU expression and the level of COX-IV or actin protein in the different MEF types normalized to controls. Data shown represent the mean ± SEM of five independent experiments. ***P < 0.001. (B) [Ca2+]mit peaks (Right) and maximal Ca2+ uptake rate (Middle) obtained in MEFs of the indicated genotypes upon permeabilization of the plasma membrane with digitonin and perfusion with an intracellular-like medium containing different (7, 15, or 25 μM) fixed [Ca2+]. Representative traces (Left) of WT and Mfn2−/− cells are shown upon the addition of 15 μM [Ca2+]. Data shown represent the mean ± SEM of 13, 12, and 9 independent experiments for [Ca2+] concentrations of 7, 15, and 25 μM, respectively, *P < 0.05; **P < 0.01; ***P < 0.001. (C) [Ca2+]mit peaks (Right) and maximal Ca2+ uptake rate (Left) obtained in permeabilized control siRNA and Mfn2-KD MEFs obtained as in B. Data shown represent the mean ± SEM of six independent experiments for each condition. (D) [Ca2+]mit (Left) and [Ca2+]cyt (Left, Inset) changes in intact control siRNA and Mfn2-KD MEFs. Representative cytosolic and mitochondrial Ca2+ traces in control siRNA (black), Mfn2-KD (red), and predepleted Mfn2-KD+Mfn2 (blue) MEFs bathed in Ca2+-free, EGTA-containing medium and challenged with 200 μM ATP. (Right) Mean [Ca2+]mit and [Ca2+]cyt (Right, Inset) peaks upon ATP stimulation in the different conditions. For cytosolic Ca2+ measurements, data shown represent the mean ± SEM of 14, 18, and 5 independent experiments for control siRNA, Mfn2-KD, and predepleted Mfn2-KD+Mfn2 MEFs, respectively. For mitochondrial Ca2+ measurements, the data shown represent the mean ± SEM of 17, 19, and 8 independent experiments for control siRNA, Mfn2-KD, and predepleted Mfn2-KD+Mfn2 MEFs, respectively. *P < 0.05.
Fig. 5.
Fig. 5.
Mfn2 ablation does not alter the dynamic of ER–mitochondria contacts. (A) Fluorescence image (modified as described in Materials and Methods) of a mit-RFP– and ER-GFP–expressing Mfn2−/− MEF with enlarged regions (boxes) corresponding to a time-lapse imaging of its stable ER–mitochondria interactions (white pixels indicated by cyan arrows) at the indicated time points (see also Movie S1). (Scale bar, 10 μm.) (B) Kinetics of the ratio (R, calculated as described in Fig. 3) on the entire Mfn2−/− cell shown in A but without any image modification. ΔR represents the difference between the R of one image (frame) and that of the previous one; frames were taken every 30 s; only two ΔRs are shown as an example. (C) Mean ΔR/R0 values (where R0 is the R of the first frame of each pair) of 100 frames from 10 different WT or Mfn2−/− MEF cells (Left) or of 60 frames from six different WT MEF cells expressing either an OMM-RFP (as control) or an artificial ER–mitochondrial linker (Right) (SI Materials and Methods). Data are shown as mean ± SEM; *P < 0.05.
Fig. 6.
Fig. 6.
Mfn2 down-regulation increases ER–mitochondria membrane association and sensitizes cells to mitochondrial Ca2+-dependent death. (A) Western blot of the specified proteins in total lysates and crude mitochondrial fractions isolated from the indicated MEFs. The relative protein levels in the mitochondrial fraction were calculated as described in Materials and Methods, taking into account their expression level in the total lysate. Data shown represent the mean ± SEM of five different experiments from three independent preparations; **P < 0.005, ***P < 0.001. (B) Representative fluorescence images of SH-SY5Y cells cotransfected with mit-RFP and either control siRNA or Mfn2-specific siRNA (Mfn2-KD), treated or not with 40 μM C2-ceramide + 100 nM bradykinin (BK) (Materials and Methods) and stained with Annexin-V-FLUOS (green). (C) The percentage of SH-SY5Y+ cells with both mit-RFP and Annexin-V-FLUOS staining treated as in B (n = 4 independent experiments) or with 60 μM etoposide (SI Materials and Methods). Data shown represent the mean ± SEM of three independent experiments; ***P < 0.001. (D) Pearson’s and Manders’ colocalization coefficients between endogenous cytochrome c (Left) and mit-RFP (Right) signals (Materials and Methods) in SH-SY5Y cells of the indicated type treated as described (n = 36, 37, 74, and 93 cells for control siRNA + DMSO, Mfn2-KD + DMSO, control siRNA + C2-ceramide + bradykinin, and Mfn2-KD + C2-ceramide + bradykinin treatment, respectively). Data shown represent the mean ± SEM; *P < 0.05, **P < 0.01.

Similar articles

Cited by

References

    1. Hayashi T, Rizzuto R, Hajnoczky G, Su TP. MAM: More than just a housekeeper. Trends Cell Biol. 2009;19(2):81–88. - PMC - PubMed
    1. Rowland AA, Voeltz GK. Endoplasmic reticulum-mitochondria contacts: Function of the junction. Nat Rev Mol Cell Biol. 2012;13(10):607–625. - PMC - PubMed
    1. Vance JE. Phospholipid synthesis in a membrane fraction associated with mitochondria. J Biol Chem. 1990;265(13):7248–7256. - PubMed
    1. Rusiñol AE, Cui Z, Chen MH, Vance JE. A unique mitochondria-associated membrane fraction from rat liver has a high capacity for lipid synthesis and contains pre-Golgi secretory proteins including nascent lipoproteins. J Biol Chem. 1994;269(44):27494–27502. - PubMed
    1. Bionda C, Portoukalian J, Schmitt D, Rodriguez-Lafrasse C, Ardail D. Subcellular compartmentalization of ceramide metabolism: MAM (mitochondria-associated membrane) and/or mitochondria? Biochem J. 2004;382(Pt 2):527–533. - PMC - PubMed

Publication types