. 2015 Apr 16;58(2):339-52.
doi: 10.1016/j.molcel.2015.03.005. Epub 2015 Apr 9.

Single mammalian cells compensate for differences in cellular volume and DNA copy number through independent global transcriptional mechanisms

Affiliations

Single mammalian cells compensate for differences in cellular volume and DNA copy number through independent global transcriptional mechanisms

Olivia Padovan-Merhar et al. Mol Cell. .

Abstract

Individual mammalian cells exhibit large variability in cellular volume, even with the same absolute DNA content, and so must compensate for differences in DNA concentration in order to maintain constant concentration of gene expression products. Using single-molecule counting and computational image analysis, we show that transcript abundance correlates with cellular volume at the single-cell level due to increased global transcription in larger cells. Cell fusion experiments establish that increased cellular content itself can directly increase transcription. Quantitative analysis shows that this mechanism measures the ratio of cellular volume to DNA content, most likely through sequestration of a transcriptional factor to DNA. Analysis of transcriptional bursts reveals a separate mechanism for gene dosage compensation after DNA replication that enables proper transcriptional output during early and late S phase. Our results provide a framework for quantitatively understanding the relationships among DNA content, cell size, and gene expression variability in single cells.


Figures

Figure 1
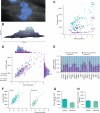
Figure 1. mRNA from many genes scales with cellular volume
A. Single molecule RNA FISH. DAPI stain in blue, TBCB mRNA FISH probe in white. B. Representative outline of a primary fibroblast cell found using our volume calculation algorithm. C. mRNA vs. volume for EEF2, LMNA, TBCB. Each point represents one single cell measurement. Each data set is a combination of at least two biological replicates, with at least 30 cells per replicate. D. GAPDH mRNA and volume in primary fibroblast cells. Marginal histograms show volume and mRNA distributions. Colors indicate cell cycle stage determined by Cyclin A2 (CCNA2) mRNA count. Dashed diagonal line is the best linear fit of RNA vs. volume. Vavg indicates the average primary fibroblast volume. We determined volume-independent and -dependent transcript levels using the linear fit and Vavg. Data are a 15% subset of 1868 cells spanning >30 biological replicates. E. Fraction of volume-independent and -dependent RNA expression from the linear fit of RNA vs. volume for 21 genes in primary fibroblast cells (we omitted highly variable genes whose volume-independent fractions were less than zero). Data for each gene are a combination of at least two biological replicates, with at least 30 cells per replicate. F. GAPDH mRNA vs. volume in cycling and quiescent primary fibroblast cells. Dashed lines are best fit line for GAPDH in cycling cells. Data are an 8% subset of 1868 cells spanning >30 biological replicates for cycling cells, and 10% subset of 1105 cells for quiescent. We only analyzed quiescent cells that had less than 20 CCNA2 mRNA. G. Mean GAPDH mRNA count and H. concentration in different growth conditions for data from (f). See also supplemental figs. 1-3.
Figure 2
Figure 2. mRNA scales with volume in vivo
A. Images of the two C. elegans strains. B. Quantification of the relative sizes of the two strains (N=24 for N2, N=20 for CB502). C. Number of mRNA molecules per cell in the gonad region for each type of worm for genes ama-1 and arf-3. We estimated the number of cells in each segment by counting nuclei stained with DAPI. Each bar is a compilation of 3 biological replicates, with >3 worms per replicate. D. Concentration of mRNA in the gonad region. All scale bars are 10μm. All error bars represent standard error of the mean.
Figure 3
Figure 3. Cells exhibit global volume-dependent transcriptional control over mRNA abundance
A, B. We inhibited transcription in primary fibroblast cells using Actinomycin D for 4 hours and allowed UBC (A) and IER2 (B) mRNA to degrade. Inset shows mRNA before and after inhibition. Each point represents a single-cell measurement. We calculated the decay constant for each cell using the best-fit line before inhibition (see Methods). Blue line shows fit if degradation were volume-dependent; red line shows fit if transcription were volume-dependent. Data represent one of two biological replicates. C. We fluorescently labeled nascent RNA produced in one hour using the Click-iT eU assay in primary fibroblast cells, and quantified the total fluorescence intensity by imaging the nuclei of single cells. Inset shows raw micrograph data. Blue line shows fit for volume-dependent degradation; red line shows fit for volume- dependent transcription. Data shown is from quiescent cells, and is one of three biological replicates. D. Distribution of cell volumes before and after transcription inhibition. E. We performed siRNA treatment for 72 hours in primary fibroblast cells using either a control siRNA (left), or an siRNA targeting LMNA mRNA (right). DAPI stain is shown in purple, and LMNA mRNA FISH probe is shown in white. White arrows indicate active transcription sites. F. Quantification of cytoplasmic LMNA mRNA knockdown by RNA FISH. Inset shows protein knockdown. G. Comparison of the number of LMNA transcription sites and transcription site intensity in siRNA control and LMNA knockdown conditions. We detected transcription sites through intron/exon colocalization using RNA FISH. All error bars represent standard error of the mean. Data in D, E are a combination of two biological replicates, n = 323 cells for control siRNA, 284 cells for LMNA siRNA.
Figure 4
Figure 4. A trans-acting limiting factor links gene expression to volume
A. Representative image of fused cells (heterokaryon, left) and unfused cells (WM983b, primary fibroblast, right). DAPI stain is in orange, GFP mRNA is in green, and GAS6 mRNA is in white. White arrows indicate transcription sites. B. Quantification of GFP mRNA in unfused and fused cells. Box extends to first and third quartile, and whiskers extend to the maximum-distance points within 1.5 inter-quartile ranges of the box. Data are a combination of two biological replicates. C. GFP vs. volume for fused and unfused cells. Upper dashed line represents fit for unfused cells. Lower dashed line has a slope that is half of the upper fit line. D. Schematic of transcriptional output of fused cells if the scaling of expression with volume were mediated by a volume sensor or a volume/DNA sensor. All error bars represent standard error of the mean.
Figure 5
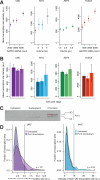
Figure 5. Transcriptional burst size increases in larger cells
A. Transcription site intensity and volume in primary fibroblast cells for genes UBC, MYC, EEF2, and TUSC3. Each data point represents the mean transcription site intensity per cell for a quartile of cells classified by volume or GAPDH. We detected transcription sites through intron/exon colocalization using RNA FISH. We calculated volume for EEF2 data using EEF2 as a guide, and volume for MYC data using GAPDH. We use GAPDH as a proxy for volume for UBC and TUSC3. B. Transcription site intensity and cell cycle stage in primary fibroblast cells. We determined cell cycle stage by Cyclin A2 and the histone 1H4E mRNA counts (see Methods and Supplemental Fig. 3). For intensity measurements, data for UBC, MYC, and EEF2 are from one of two biological replicates (EEF2: n = 190, UBC: n = 202, MYC: n = 103 transcription sites). Data for TUSC3 are combined from two biological replicates (n = 255 transcription sites). C. Western blot analysis reveals that >99% of the C-terminal domain hyper-phosphorylated form of RNA Polymerase II (IIO) is present in the chromatin fraction. The hypo-phosphorylated form of Pol II (IIA) is captured in all cellular fractions. We generated subcellular lysates from the same batch of primary fibroblast cells and probed with the F-12 antibody (Santa Cruz Biotechnology) that is directed against the N-terminal region of RPB1, the largest subunit of RNA polymerase II. We adjusted sample volumes so that Western blot signals of the subcellular fractions are comparable. D. Quantification of transcription site intensity before and after treatment with 100nM triptolide for one hour. P-value represents the probability of randomly finding the distributions of bright transcription sites (values to the right of the black line) in each condition. See also supplemental figs. 3-4.
Figure 6
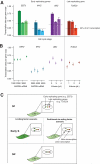
Figure 6. A cis-acting factor decreases transcription frequency immediately upon DNA replication
A. Number of transcription sites by cell cycle stage in primary fibroblast cells. We determined cell cycle stage by Cyclin A2 and Histone 1H4E mRNA counts. Dashed lines represent half the number of transcription sites in G1. We normalize all G1 data to two gene copies, and all G2 data to four gene copies. For EEF2, MYC, and UBC (early replicators), we normalize S phase data to four gene copies. For TUSC3 (late replicator), we normalize S phase data to two gene copies. B. Number of transcription sites per gene copy classified by volume in primary fibroblast cells. Each data point represents the mean number of transcription sites for a quartile of cells classified by volume. We calculated volume for EEF2 data using EEF2 as a guide, and volume for MYC data using GAPDH. We use GAPDH as a proxy for volume for UBC and TUSC3. For frequency measurements, data for EEF2, UBC, and TUSC3 are a combination of two biological replicates (EEF2: n = 516, UBC: n = 332, TUSC3: n = 255 transcription sites). Data for MYC is from one of two biological replicates (MYC: n = 103 transcription sites). C. Schematic depicting different potential mechanisms for changing gene expression with cell cycle. See also supplemental figs. 3-4.
Figure 7
Figure 7. Connection between single cell RNA-sequencing and RNA FISH reveals that cell-type specific genes exhibit higher noise levels
A. RNA FISH data. TBCB mRNA abundance and volume in primary fibroblast cells. Each point represents a single-cell measurement. Histogram indicates mRNA distribution. Arrow indicates volume-corrected noise measure. Gray line is best linear fit. B. Volume-corrected noise measure values for different genes in primary fibroblast cells. Each data point represents a collection of single-cell measurements for one gene. The straight gray line represents the Poisson limit. The curved gray line is the Poisson limit plus our experimental noise limit, a combination of the Poisson limit and a 15% measurement error. Error bars represent SEM. Data for each gene is a combination of at least two biological replicates, with at least 30 cells per replicate. C. Pipeline for converting FPKM from single-cell sequencing to RNA FISH-equivalent counts and cellular volume in picoliters. D. Qualitative comparison of count vs. volume from RNA FISH and single-cell RNA sequencing. Example low-Nm (GAPDH) and high-Nm gene (MYC). E. Comparison between Nm calculated from RNA FISH data and single-cell RNA-seq data. Each point represents a single gene. Nm is calculated by bootstrapping; error bars represent 95% confidence interval, calculated by bootstrapping. F. Breakdown of high- and low-noise genes into ubiquitously expressing genes and genes that express in a cell-type-dependent manner. See also supplemental figs. 5-7.

Similar articles

Cited by

References

    1. Bar-Even A, Paulsson J, Maheshri N, Carmi M, O'Shea E, Pilpel Y, Barkai N. Noise in protein expression scales with natural protein abundance. Nat. Genet. 2006;38:636–643. - PubMed
    1. Bensaude O. Inhibiting eukaryotic transcription: Which compound to choose? How to evaluate its activity? Transcription. 2011;2:103–108. - PMC - PubMed
    1. Bhatt DM, Pandya-Jones A, Tong A-J, Barozzi I, Lissner MM, Natoli G, Black DL, Smale ST. Transcript dynamics of proinflammatory genes revealed by sequence analysis of subcellular RNA fractions. Cell. 2012;150:279–290. - PMC - PubMed
    1. Bowsher CG, Swain PS. Identifying sources of variation and the flow of information in biochemical networks. Proc Natl Acad Sci USA. 2012;109:E1320–E1328. - PMC - PubMed
    1. Brennecke P, Anders S, Kim JK, Kołodziejczyk AA, Zhang X, Proserpio V, Baying B, Benes V, Teichmann SA, Marioni JC, et al. Accounting for technical noise in single-cell RNA-seq experiments. Nature Methods. 2013;10:1093–1095. - PubMed

Publication types

Associated data