. 2015 Apr 23;520(7548):511-7.
doi: 10.1038/nature14367. Epub 2015 Apr 8.

Structure of the TRPA1 ion channel suggests regulatory mechanisms

Affiliations

Structure of the TRPA1 ion channel suggests regulatory mechanisms

Candice E Paulsen et al. Nature. .

Erratum in

Abstract

The TRPA1 ion channel (also known as the wasabi receptor) is a detector of noxious chemical agents encountered in our environment or produced endogenously during tissue injury or drug metabolism. These include a broad class of electrophiles that activate the channel through covalent protein modification. TRPA1 antagonists hold potential for treating neurogenic inflammatory conditions provoked or exacerbated by irritant exposure. Despite compelling reasons to understand TRPA1 function, structural mechanisms underlying channel regulation remain obscure. Here we use single-particle electron cryo- microscopy to determine the structure of full-length human TRPA1 to ∼4 Å resolution in the presence of pharmacophores, including a potent antagonist. Several unexpected features are revealed, including an extensive coiled-coil assembly domain stabilized by polyphosphate co-factors and a highly integrated nexus that converges on an unpredicted transient receptor potential (TRP)-like allosteric domain. These findings provide new insights into the mechanisms of TRPA1 regulation, and establish a blueprint for structure-based design of analgesic and anti-inflammatory agents.


Figures
Extended Data Figure 1
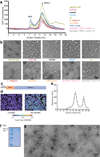
Extended Data Figure 1. Pre-cryo-EM screening of TRPA1 species orthologues and purification of hTRPA1
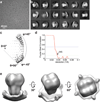
a, FSEC traces from EGFP-TRPA1 fusion proteins. Void volume and peak corresponding to tetrameric channels are indicated. b, Representative section of negative stain micrographs showing typical structure of tetrameric MBP-tagged TRPA1 from various species, as indicated (text color matches traces in panel a). Particles from species orthologes exhibited highly similar shapes, except rattlesnake TRPA1, which were not homogenous and tended to aggregate. The human TRPA1 orthologue was chosen after negative stain screening due to exemplary homogeneity of individual particles. c, Cartoon diagram of MBP-tagged construct used for single-particle cryo-EM studies. d, MBP-tagged hTRPA1 construct is active when transduced in HEK293T cells as assessed by calcium imaging (scale bar indicates relative calcium levels: low, blue to high, red). e, Gel filtration profile (Superose 6) of MBP-tagged human TRPA1 after detergent solubilization, purification on amylose affinity resin, followed by exchange into PMAL-C8. Peaks correspond to void (1), tetrameric MBP-hTRPA1 (2), and excess PMAL-C8 (3). f, Material from peak 2 migrates as a single, homogenous band (173 kDa) on SDS-PAGE (4–12% gradient gel, Coomassie stain). g, PMAL-C8-stabilized MBP-hTRPA1 appears as homogenous particles with a clear crescent density by negative stain imaging.
Extended Data Figure 2
Extended Data Figure 2. Initial single-particle cryo-EM study of hTRPA1
a, Raw micrograph of MBP-hTRPA1 recorded using a scintillator-based CMOS camera. b, 2D class averages of MBP-hTRPA1 particles. c, Euler angle distribution of initial 3D reconstruction. d, FSC curve of final 3D reconstruction. e, Final 3D reconstruction of MBP-hTRPA1 at 28Å resolution. This 3D reconstruction was used as the initial model for subsequent cryo-EM studies of hTRPA1 using a direct electron detection camera.
Extended Data Figure 3
Extended Data Figure 3. Single-particle cryo-EM studies of hTRPA1 with agonist (AITC)
a, Raw micrograph of MBP-hTRPA1 with agonist (AITC) recorded using K2 Summit operated in super-resolution counting mode. b, Gallery of 2D class averages. c, Euler angle distribution of all particles included in calculating the final 3D reconstruction. The size of the ball is proportional to the number of particles in this specific orientation. d, Selected slice views of the unsharpened 3D density map. The views are oriented in parallel with the membrane plane. The numbers of slices are marked. e, Two views of hTRPA1 density map filtered to 6Å resolution and displayed in two different isosurface levels (high in yellow and low in gray). At low isosurface level, density contributed by PMAL-C8 is visible. f, FSC curves between two independently refined half maps (red) and between the final combined density map and the map calculated from atomic model (blue). g, Voxel histogram corresponding to local resolution. There are significant numbers of voxels with higher than 4Å local resolution. h, Final 3D reconstruction colored with local resolution. i, Cryo-EM densities of the S4, S4–S5 linker, pore helices, S6, TRP-like domain, and coiled-coil in longitudinal cross sections are superimposed on an atomic model. Only two diagonally opposed subunits are shown for clarity. Dashed ovals indicate regions highlighted at sides.
Extended Data Figure 4
Extended Data Figure 4. Single-particle cryo-EM studies of hTRPA1 with antagonist (HC-030031)
a, Raw micrograph of MBP-hTRPA1 with single antagonist HC-030031 recorded using K2 Summit operated in super-resolution counting mode. b, Gallery of 2D class averages. c, Euler angle distribution of all particles included in calculating the final 3D reconstruction. The size of the ball is proportional to the number of particles in this specific orientation. d, FSC curve between two independently refined half maps. e, Three different views of the final density map. f, Voxel histogram corresponding to local resolution. g, Final 3D reconstruction colored with local resolution.
Extended Data Figure 5
Extended Data Figure 5. Single-particle cryo-EM studies of hTRPA1 with double antagonist (HC-030031 and A-967079)
a, Raw micrograph of MBP-hTRPA1 with double antagonists recorded using K2 Summit operated in super-resolution counting mode. b, Gallery of 2D class averages. c, Euler angle distribution of all particles included in calculating the final 3D reconstruction. The size of the ball is proportional to the number of particles in this specific orientation. d, FSC curve between two independently refined half maps. e, Three different views of the final density map. f, Voxel histogram corresponding to local resolution. g, Final 3D reconstruction colored with local resolution.
Extended Data Figure 6
Extended Data Figure 6. Refinement of de novo atomic model of hTRPA1 determined from cryo-EM density maps
a. Statistics of atomic model refinement. b. FSC curves between the density map calculated from the refined model and half map 1 (work, green curve), half map 2 (free, red curve) and summed map (blue).
Extended Data Figure 7
Extended Data Figure 7. Detailed views of unique structural features in hTRPA1
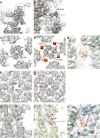
a, Density map showing the location of a poorly-resolved α-helix within the S1–S2 linker that extends into the extracellular space. b, Density map and α-carbon trace for an α-helix in the inner membrane leaflet located within a flexible loop connecting the third β-strand to the C-terminal coiled-coil. c Cross section of the density map corresponding to Fig. 3d. d, Cross section of the density map corresponding to Fig. 3c. IP6 density is depicted in orange. e, Size of the density corresponding to IP6 (yellow) is consistent with an IP6 molecule. f and g, Cryo-EM densities of D915 (f), and I957 and V961 (g) along the pore are superimposed on the atomic model; both panels represent views along the four-fold axis, showing residues from each subunit of the homotetrameric channel. h and i, Density maps and ribbon diagrams of atomic models showing the location of F909 in AITC (h) and double antagonist (i) samples. Density of A-967079 is indicated in the latter. j, Size of the density corresponding to A-967079 (yellow) is consistent with a A-967079 molecule. The resolution of these ligand densities (>6Å) is insufficient to propose a precise model for ligand binding. The positioning of coordinates for ligands represents only the scale-context and does not present any proposed mode of interaction with the channel.
Extended Data Figure 8
Extended Data Figure 8. Distal N-terminus contains an ankyrin repeat-rich region that forms a crescent-shaped density surrounding the main body of the particle
a, Sequence alignment indicates that the N-terminus of hTRPA1 contains at least 16 ARs. The last five can be modeled into all hTRPA1 density maps. b, 2D class averages of negatively stained MBP-hTRPA1 in PMAL-C8. c, Three selected 2D class averages indicating dimension of the crescent-shaped density. d, A homology model for the first 11 predicted ARs spanning a dimension of ~100Å, suggesting that the crescent-shaped density can accommodate at least 11 ARs. e and f, Two models for the extended ARs are superimposed on the hTRPA1 core atomic model determined by single-particle cryo-EM. Resolution of the crescent is insufficient to confidently determine extended ARD orientation, but which could assemble as a propeller (e) or independent wings (f). Based on the concerted movement of the crescent density in distinct negative stain particles (b), we favor a propeller orientation.
Extended Data Figure 9
Extended Data Figure 9. Characterization of F909T hTRPA1 sensitivity to A-967079
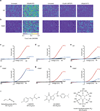
a and b, Ratiometric calcium imaging of HEK293 cells transiently transfected with wild-type (a) or F909T mutant (b) hTRPA1. Cells were stimulated with AITC (250µM) with (right) or without (left) pre-application of A-967079 (10µM). ch, Representative recordings from oocytes expressing wild-type (c – e) or F909T mutant (fh) hTRPA1 activated with AITC (200 µM) prior to co-application of A-967079 (10 µM) (c and f), HC-030031 (100 µM) (d and g), or ruthenium red (10 µM) (e and h). i, Chemical structures and molecular weights of compounds used in this study.
Figure 1
Figure 1. 3D reconstruction of hTRPA1
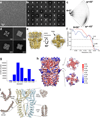
a, Representative cryo-EM 2D class averages of hTRPA1 (side views, left and middle; end-on view, right). b, Representative negative stain particles in amphipol. c, 3D density map of hTRPA1 from AITC-treated sample filtered to 3.5Å resolution with each subunit color-coded. Three views show side, top, and bottom. d, Ribbon diagram of rTRPV1 apo-state atomic model for comparison. e, Ribbon diagram of hTRPA1 atomic model for residues K446-T1078, including the last five ankyrin repeats. Channel dimensions are indicated; side, top, and bottom views are shown.
Figure 2
Figure 2. Structural details of a single hTRPA1 subunit
a, Linear diagram depicting major structural domains color-coded to match ribbon diagrams below. Dashed lines and boxes denote regions for which density was insufficient to resolve detailed structure (sequence prior to AR12, loop containing C665, S1–S2, S2–S3 and S3–S4 linkers, connection between third β-strand and coiled-coil, C-terminus subsequent to coiled-coil), or where specific residues could not be definitively assigned (portion of the linker prior and subsequent to the coiled-coil). b, Ribbon diagrams depicting three views of hTRPA1 subunit.
Figure 3
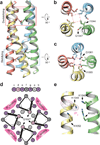
Figure 3. C-terminal coiled-coil mediates cytosolic interactions and polyphosphate association
a, Side view of hTRPA1 coiled-coil with two core glutamines boxed in red (destabilizing) or blue (stabilizing). b and c, Cross sections of coiled-coil at indicated regions with core residues depicted in stick format. Dashed red lines show residue interactions. d, Helical wheel presentation of residues K1046–K1052. Q1047 from each subunit is indicated with an arrow. Basic residues in ‘b, e’ and ‘c, g’ positions of neighboring helices form the binding site for IP6. Colors differentiate class of residues: light gray, aliphatic; dark gray, aromatic; light pink, polar; purple, basic. e, 3D reconstruction contains density for IP6 adjacent to positively-charged pocket formed by K1046, R1050 and K1048, K1052 between neighboring coiled-coil helices. Though not modeled, IP6 likely docks parallel to the coiled-coil such that each positively charged residue coordinates an individual phosphate moiety.
Figure 4
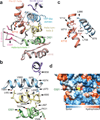
Figure 4. Cytoplasmic domains form an integrated nexus
a, Domain architecture and web of interactions between the TRP-like domain (blue) and pre-S1 helix (orange), the overlying S4–S5 linker (purple) and underlying linker region, consisting of two helix-turn-helix motifs (green and yellow) separated by two putative anti-parallel β-strands (pink). A third β-strand (pink) is contributed by residues following the TRP-like domain. Structurally resolved reactive cysteines and lysine (C621, C641, and K710) are shown in ball and stick format. The helix-turn-helices are stacked above the ARD (rose). b, The TRP-like domain forms hydrophobic interactions with the second helix-turn-helix motif and S4–S5 linker. The first helix-turn-helix (containing C621) is integrated with the TRP-like domain through interactions with the intervening second helix-turn-helix. c, The TRP-like domain also interacts with the pre-S1 helix. d, C621 is located in a closely-packed pocket lined by AR16 below and the second helix-turn-helix above. C621 is shown as a hydrophobicity surface.
Figure 5
Figure 5. Structural integration of the ARD
a, The interdigitated convex ‘stem’ region of the ARD consisting of AR12–16 (only AR15 and AR16 are shown; rose) couples to the allosteric TRP-like domain (blue) through interactions with two intervening helix-turn-helix motifs (green and yellow) of the linker region. AR15–16 stacking is stabilized through hydrophobic interactions. AR16 is also connected to the overlying first helix-turn-helix motif through hydrophobic and polar interactions. b and c, The ARD and linker region make connections with the coiled-coil through a series of hydrophobic, polar, and potentially π-cation interactions involving residues in AR12 and 13 (b) as well as AR16 and the first helix-turn-helix of the linker region (c). Coiled-coil α-helices from the same and neighboring subunit are colored orange and purple, respectively.
Figure 6
Figure 6. The ion permeation pathway and antagonist binding site
a, Solvent accessible pathway along the pore of AITC-treated channel mapped with HOLE program. D915 in a loop between the first and second pore helices is the sole contributor to the upper restriction, which is structurally analogous to M644 in TRPV1. In contrast, G914 and N917, structurally equivalent to G643 and D646 in TRPV1, do not appear to contribute to the upper constriction. A string of acidic residues in the second pore helix (E920, E924, E930) likely form a negatively charged conduit to attract cations and repel anions. The lower gate is formed by I957 and V961, the former of which is analogous to I679 in TRPV1. b, Radius of the pore as calculated through HOLE program. c, Cryo-EM map for the double antagonist-treated sample contains a unique density corresponding to A-967079 (orange) and located within a pocket formed by S5 (yellow), S6 (blue) and the first pore helix (green). Residues implicated in A-967079 antagonism are indicated, many of which line this pocket and undergo subtle conformational changes upon antagonist binding (AITC model shown in white). d, Quantification of antagonist-mediated inhibition of AITC-evoked currents in oocytes expressing wild-type or F909T mutant hTRPA1 channels. Responses were first evoked with AITC (200 µM) alone, and then in the presence of A-967079 (10 µM) or HC-030031 (100 µM). Data represent percentage of inhibition of the AITC-evoked maximal current at +80 mV (n = 7 independent cells per group, mean ± S.E.M, Student’s t-test). Representative current traces are in Extended Data Fig. 9.

Comment in

Similar articles

Cited by

References

    1. Julius D. TRP channels and pain. Annu Rev Cell Dev Biol. 2013;29:355–384. - PubMed
    1. Wang H, Woolf CJ. Pain TRPs. Neuron. 2005;46:9–12. - PubMed
    1. Bandell M, et al. Noxious cold ion channel TRPA1 is activated by pungent compounds and bradykinin. Neuron. 2004;41:849–857. - PubMed
    1. Bautista DM, et al. TRPA1 mediates the inflammatory actions of environmental irritants and proalgesic agents. Cell. 2006;124:1269–1282. - PubMed
    1. Bautista DM, et al. Pungent products from garlic activate the sensory ion channel TRPA1. Proc Natl Acad Sci U S A. 2005;102:12248–12252. - PMC - PubMed

Methods references

    1. Kawate T, Gouaux E. Fluorescence-detection size-exclusion chromatography for precrystallization screening of integral membrane proteins. Structure. 2006;14:673–681. - PubMed
    1. Chae PS, et al. Maltose-neopentyl glycol (MNG) amphiphiles for solubilization, stabilization and crystallization of membrane proteins. Nat Methods. 2010;7:1003–1008. - PMC - PubMed
    1. Ohi M, Li Y, Cheng Y, Walz T. Negative Staining and Image Classification - Powerful Tools in Modern Electron Microscopy. Biol Proced Online. 2004;6:23–34. - PMC - PubMed
    1. Li X, et al. Electron counting and beam-induced motion correction enable near-atomic-resolution single-particle cryo-EM. Nat Methods. 2013;10:584–590. - PMC - PubMed
    1. Mindell JA, Grigorieff N. Accurate determination of local defocus and specimen tilt in electron microscopy. J Struct Biol. 2003;142:334–347. - PubMed

Publication types

MeSH terms

Associated data