Natural T Cell-mediated Protection against Seasonal and Pandemic Influenza. Results of the Flu Watch Cohort Study
- PMID: 25844934
- PMCID: PMC4476562
- DOI: 10.1164/rccm.201411-1988OC
Natural T Cell-mediated Protection against Seasonal and Pandemic Influenza. Results of the Flu Watch Cohort Study
Abstract
Rationale: A high proportion of influenza infections are asymptomatic. Animal and human challenge studies and observational studies suggest T cells protect against disease among those infected, but the impact of T-cell immunity at the population level is unknown.
Objectives: To investigate whether naturally preexisting T-cell responses targeting highly conserved internal influenza proteins could provide cross-protective immunity against pandemic and seasonal influenza.
Methods: We quantified influenza A(H3N2) virus-specific T cells in a population cohort during seasonal and pandemic periods between 2006 and 2010. Follow-up included paired serology, symptom reporting, and polymerase chain reaction (PCR) investigation of symptomatic cases.
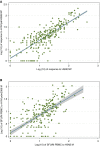
Measurements and main results: A total of 1,414 unvaccinated individuals had baseline T-cell measurements (1,703 participant observation sets). T-cell responses to A(H3N2) virus nucleoprotein (NP) dominated and strongly cross-reacted with A(H1N1)pdm09 NP (P < 0.001) in participants lacking antibody to A(H1N1)pdm09. Comparison of paired preseason and post-season sera (1,431 sets) showed 205 (14%) had evidence of infection based on fourfold influenza antibody titer rises. The presence of NP-specific T cells before exposure to virus correlated with less symptomatic, PCR-positive influenza A (overall adjusted odds ratio, 0.27; 95% confidence interval, 0.11-0.68; P = 0.005, during pandemic [P = 0.047] and seasonal [P = 0.049] periods). Protection was independent of baseline antibodies. Influenza-specific T-cell responses were detected in 43%, indicating a substantial population impact.
Conclusions: Naturally occurring cross-protective T-cell immunity protects against symptomatic PCR-confirmed disease in those with evidence of infection and helps to explain why many infections do not cause symptoms. Vaccines stimulating T cells may provide important cross-protective immunity.
Keywords: T lymphocytes; cellular immunity; cohort studies.
Figures


Similar articles
-
Comparative community burden and severity of seasonal and pandemic influenza: results of the Flu Watch cohort study.Lancet Respir Med. 2014 Jun;2(6):445-54. doi: 10.1016/S2213-2600(14)70034-7. Epub 2014 Mar 17. Lancet Respir Med. 2014. PMID: 24717637 Free PMC article.
-
Cross-reactive immunity against influenza viruses in children and adults following 2009 pandemic H1N1 infection.Antiviral Res. 2015 Feb;114:106-12. doi: 10.1016/j.antiviral.2014.12.008. Epub 2014 Dec 13. Antiviral Res. 2015. PMID: 25513756
-
Longevity and determinants of protective humoral immunity after pandemic influenza infection.Am J Respir Crit Care Med. 2015 Feb 1;191(3):325-32. doi: 10.1164/rccm.201410-1798OC. Am J Respir Crit Care Med. 2015. PMID: 25506631 Free PMC article.
-
Seroconversion to seasonal influenza viruses after A(H1N1)pdm09 virus infection, Quebec, Canada.Emerg Infect Dis. 2012 Jul;18(7):1132-4. doi: 10.3201/eid1807.111680. Emerg Infect Dis. 2012. PMID: 22710312 Free PMC article.
-
Recalling the Future: Immunological Memory Toward Unpredictable Influenza Viruses.Front Immunol. 2019 Jul 2;10:1400. doi: 10.3389/fimmu.2019.01400. eCollection 2019. Front Immunol. 2019. PMID: 31312199 Free PMC article. Review.
Cited by
-
Priming Vaccination With Influenza Virus H5 Hemagglutinin Antigen Significantly Increases the Duration of T cell Responses Induced by a Heterologous H5 Booster Vaccination.J Infect Dis. 2016 Oct 1;214(7):1020-9. doi: 10.1093/infdis/jiw310. Epub 2016 Jul 20. J Infect Dis. 2016. PMID: 27443611 Free PMC article.
-
In vitro immune evaluation of adenoviral vector-based platform for infectious diseases.BioTechnologia (Pozn). 2023 Dec 21;104(4):403-419. doi: 10.5114/bta.2023.132775. eCollection 2023. BioTechnologia (Pozn). 2023. PMID: 38213479 Free PMC article.
-
Avian influenza A(H7N9) and (H5N1) infections among poultry and swine workers and the general population in Beijing, China, 2013-2015.Sci Rep. 2016 Sep 27;6:33877. doi: 10.1038/srep33877. Sci Rep. 2016. PMID: 27670286 Free PMC article.
-
Back to the Future: Lessons Learned From the 1918 Influenza Pandemic.Front Cell Infect Microbiol. 2018 Oct 8;8:343. doi: 10.3389/fcimb.2018.00343. eCollection 2018. Front Cell Infect Microbiol. 2018. PMID: 30349811 Free PMC article. Review.
-
How the COVID 19 pandemic will shape influenza public health initiatives: The UK experience.Hum Vaccin Immunother. 2022 Nov 30;18(5):2056399. doi: 10.1080/21645515.2022.2056399. Epub 2022 Apr 18. Hum Vaccin Immunother. 2022. PMID: 35435806 Free PMC article.
References
-
- Carrat F, Vergu E, Ferguson NM, Lemaitre M, Cauchemez S, Leach S, Valleron AJ. Time lines of infection and disease in human influenza: a review of volunteer challenge studies. Am J Epidemiol. 2008;167:775–785. - PubMed
-
- Wang TE, Lin CY, King CC, Lee WC. Estimating pathogen-specific asymptomatic ratios. Epidemiology. 2010;21:726–728. - PubMed
-
- Noble GR. Epidemiological and clinical aspects of influenza. In: Beare AS, editor. Basic and applied influenza research. Boca Raton, FL: CRC Press; 1982. pp. 11–50.
MeSH terms
Grants and funding
LinkOut - more resources
Full Text Sources
Other Literature Sources
Medical
Miscellaneous

