Telomere dysfunction causes alveolar stem cell failure
- PMID: 25840590
- PMCID: PMC4413294
- DOI: 10.1073/pnas.1504780112
Telomere dysfunction causes alveolar stem cell failure
Abstract
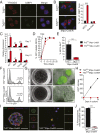
Telomere syndromes have their most common manifestation in lung disease that is recognized as idiopathic pulmonary fibrosis and emphysema. In both conditions, there is loss of alveolar integrity, but the underlying mechanisms are not known. We tested the capacity of alveolar epithelial and stromal cells from mice with short telomeres to support alveolar organoid colony formation and found that type 2 alveolar epithelial cells (AEC2s), the stem cell-containing population, were limiting. When telomere dysfunction was induced in adult AEC2s by conditional deletion of the shelterin component telomeric repeat-binding factor 2, cells survived but remained dormant and showed all the hallmarks of cellular senescence. Telomere dysfunction in AEC2s triggered an immune response, and this was associated with AEC2-derived up-regulation of cytokine signaling pathways that are known to provoke inflammation in the lung. Mice uniformly died after challenge with bleomycin, underscoring an essential role for telomere function in AEC2s for alveolar repair. Our data show that alveoloar progenitor senescence is sufficient to recapitulate the regenerative defects, inflammatory responses, and susceptibility to injury that are characteristic of telomere-mediated lung disease. They suggest alveolar stem cell failure is a driver of telomere-mediated lung disease and that efforts to reverse it may be clinically beneficial.
Keywords: emphysema; idiopathic pulmonary fibrosis; senescence; telomerase.
Conflict of interest statement
The authors declare no conflict of interest.
Figures


Similar articles
-
Lung alveolar integrity is compromised by telomere shortening in telomerase-null mice.Am J Physiol Lung Cell Mol Physiol. 2009 Jan;296(1):L57-70. doi: 10.1152/ajplung.90411.2008. Epub 2008 Oct 24. Am J Physiol Lung Cell Mol Physiol. 2009. PMID: 18952756 Free PMC article.
-
Pulmonary Alveolar Stem Cell Senescence, Apoptosis, and Differentiation by p53-Dependent and -Independent Mechanisms in Telomerase-Deficient Mice.Cells. 2021 Oct 26;10(11):2892. doi: 10.3390/cells10112892. Cells. 2021. PMID: 34831112 Free PMC article.
-
Telomerase reverse transcriptase ameliorates lung fibrosis by protecting alveolar epithelial cells against senescence.J Biol Chem. 2019 May 31;294(22):8861-8871. doi: 10.1074/jbc.RA118.006615. Epub 2019 Apr 18. J Biol Chem. 2019. PMID: 31000627 Free PMC article.
-
Molecular Mechanisms of Alveolar Epithelial Stem Cell Senescence and Senescence-Associated Differentiation Disorders in Pulmonary Fibrosis.Cells. 2022 Mar 3;11(5):877. doi: 10.3390/cells11050877. Cells. 2022. PMID: 35269498 Free PMC article. Review.
-
Tissue formation and tissue engineering through host cell recruitment or a potential injectable cell-based biocomposite with replicative potential: Molecular mechanisms controlling cellular senescence and the involvement of controlled transient telomerase activation therapies.J Biomed Mater Res A. 2015 Dec;103(12):3993-4023. doi: 10.1002/jbm.a.35515. Epub 2015 Aug 14. J Biomed Mater Res A. 2015. PMID: 26034007 Review.
Cited by
-
You Say You Want a Resolution (of Fibrosis).Am J Respir Cell Mol Biol. 2020 Oct;63(4):424-435. doi: 10.1165/rcmb.2020-0182TR. Am J Respir Cell Mol Biol. 2020. PMID: 32640171 Free PMC article. Review.
-
The short and long telomere syndromes: paired paradigms for molecular medicine.Curr Opin Genet Dev. 2015 Aug;33:1-9. doi: 10.1016/j.gde.2015.06.004. Epub 2015 Jul 29. Curr Opin Genet Dev. 2015. PMID: 26232116 Free PMC article. Review.
-
Targeting Alveolar Repair in Idiopathic Pulmonary Fibrosis.Am J Respir Cell Mol Biol. 2021 Oct;65(4):347-365. doi: 10.1165/rcmb.2020-0476TR. Am J Respir Cell Mol Biol. 2021. PMID: 34129811 Free PMC article. Review.
-
mTert induction in p21-positive cells counteracts capillary rarefaction and pulmonary emphysema.EMBO Rep. 2024 Mar;25(3):1650-1684. doi: 10.1038/s44319-023-00041-1. Epub 2024 Feb 29. EMBO Rep. 2024. PMID: 38424230 Free PMC article.
-
Advances in cellular senescence in idiopathic pulmonary fibrosis (Review).Exp Ther Med. 2023 Feb 15;25(4):145. doi: 10.3892/etm.2023.11844. eCollection 2023 Apr. Exp Ther Med. 2023. PMID: 36911379 Free PMC article. Review.
References
-
- de la Fuente J, Dokal I. Dyskeratosis congenita: Advances in the understanding of the telomerase defect and the role of stem cell transplantation. Pediatr Transplant. 2007;11(6):584–594. - PubMed
Publication types
MeSH terms
Substances
Associated data
- Actions
Grants and funding
LinkOut - more resources
Full Text Sources
Other Literature Sources
Medical
Molecular Biology Databases
Research Materials

