

Nox2 mediates skeletal muscle insulin resistance induced by a high fat diet
- PMID: 25825489
- PMCID: PMC4505590
- DOI: 10.1074/jbc.M114.626077
Nox2 mediates skeletal muscle insulin resistance induced by a high fat diet
Abstract
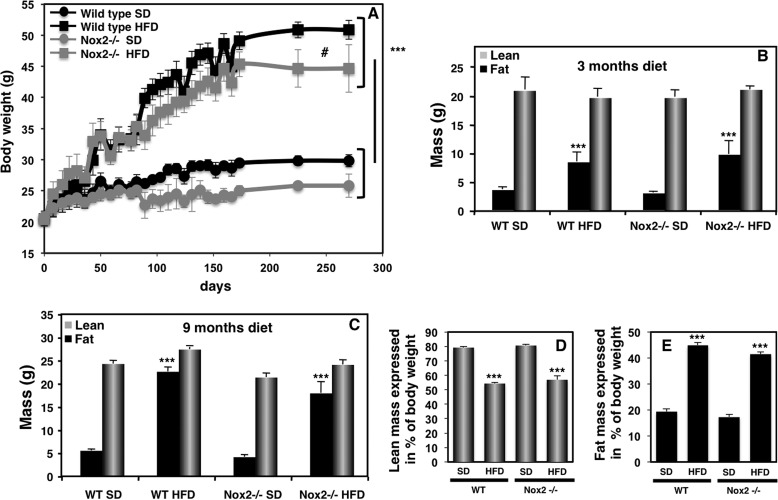
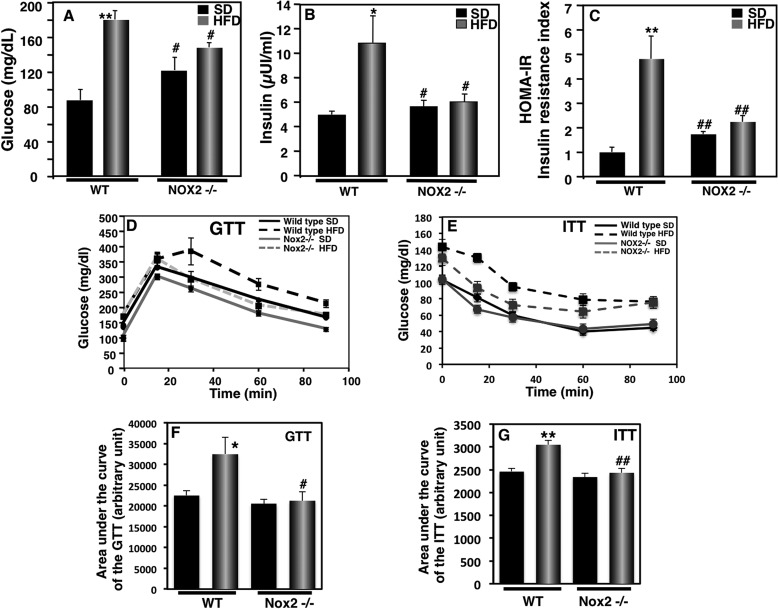
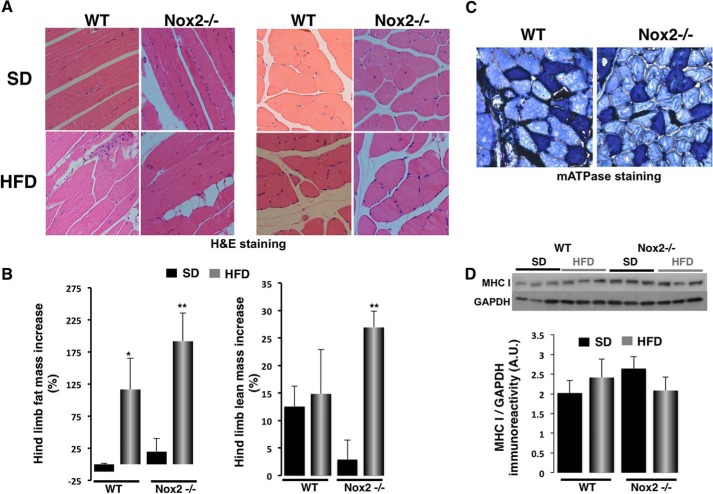
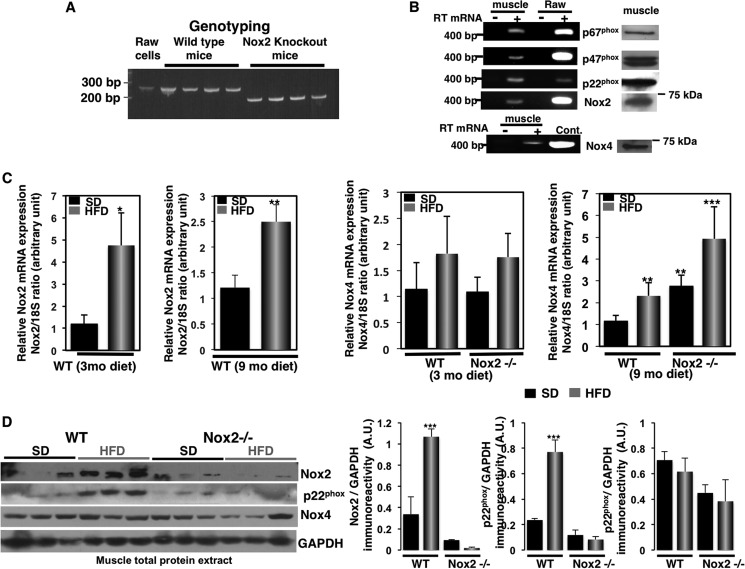
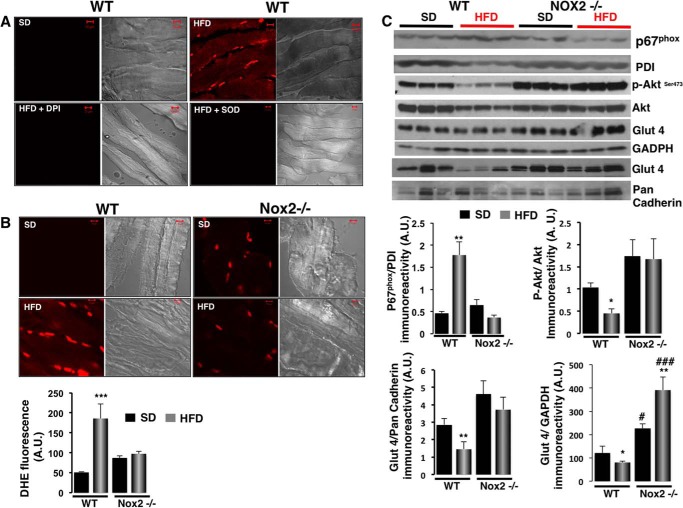
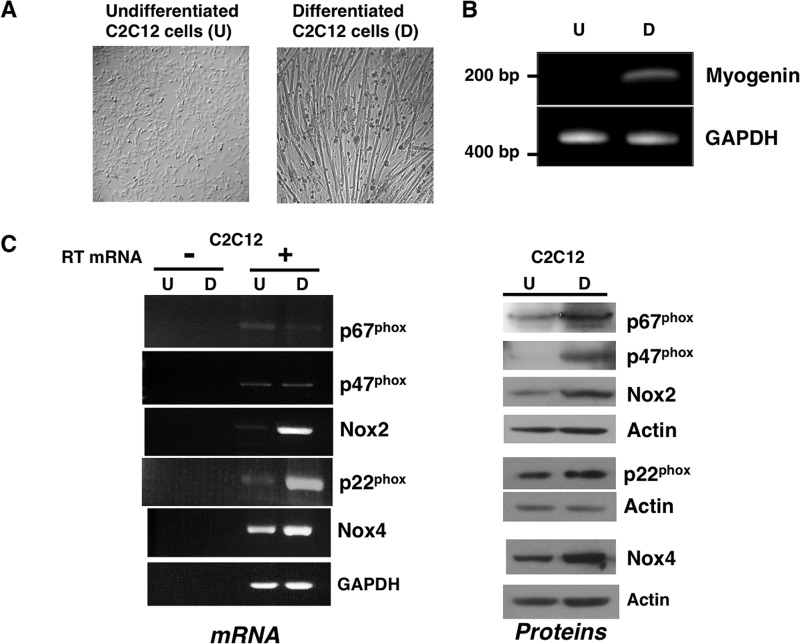
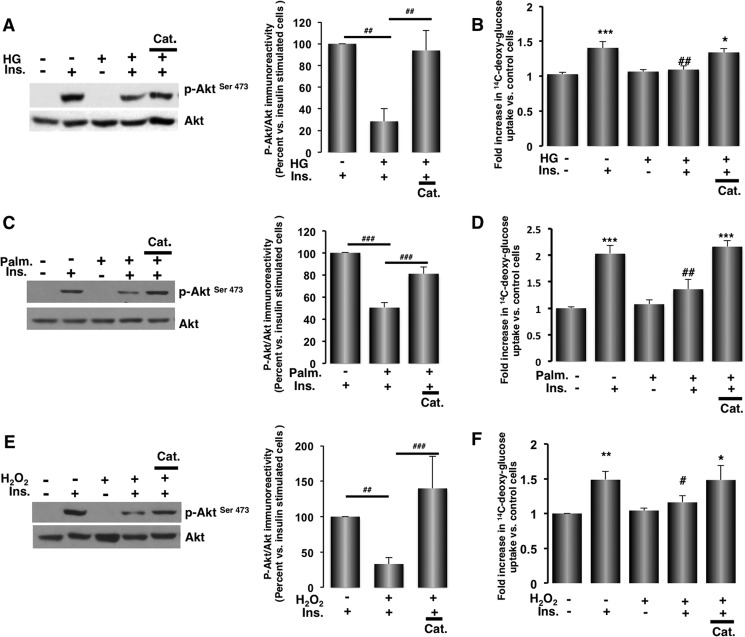
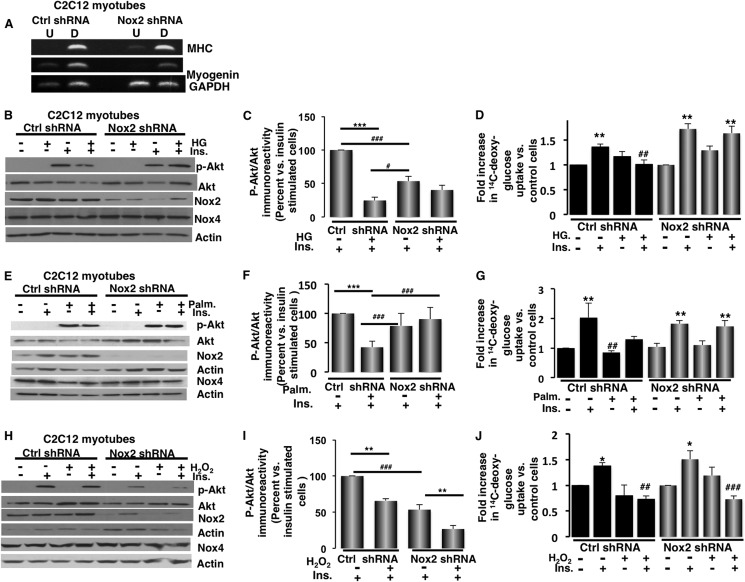
Inflammation and oxidative stress through the production of reactive oxygen species (ROS) are consistently associated with metabolic syndrome/type 2 diabetes. Although the role of Nox2, a major ROS-generating enzyme, is well described in host defense and inflammation, little is known about its potential role in insulin resistance in skeletal muscle. Insulin resistance induced by a high fat diet was mitigated in Nox2-null mice compared with wild-type mice after 3 or 9 months on the diet. High fat feeding increased Nox2 expression, superoxide production, and impaired insulin signaling in skeletal muscle tissue of wild-type mice but not in Nox2-null mice. Exposure of C2C12 cultured myotubes to either high glucose concentration, palmitate, or H2O2 decreases insulin-induced Akt phosphorylation and glucose uptake. Pretreatment with catalase abrogated these effects, indicating a key role for H2O2 in mediating insulin resistance. Down-regulation of Nox2 in C2C12 cells by shRNA prevented insulin resistance induced by high glucose or palmitate but not H2O2. These data indicate that increased production of ROS in insulin resistance induced by high glucose in skeletal muscle cells is a consequence of Nox2 activation. This is the first report to show that Nox2 is a key mediator of insulin resistance in skeletal muscle.
Keywords: Diabetes; Insulin Resistance; NADPH Oxidase; Reactive Oxygen Species (ROS); Skeletal Muscle; Superoxide Ion.
© 2015 by The American Society for Biochemistry and Molecular Biology, Inc.
Figures
Similar articles
-
Crucial roles of Nox2-derived oxidative stress in deteriorating the function of insulin receptors and endothelium in dietary obesity of middle-aged mice.Br J Pharmacol. 2013 Nov;170(5):1064-77. doi: 10.1111/bph.12336. Br J Pharmacol. 2013. PMID: 23957783 Free PMC article.
-
NOD2 activation induces oxidative stress contributing to mitochondrial dysfunction and insulin resistance in skeletal muscle cells.Free Radic Biol Med. 2015 Dec;89:158-69. doi: 10.1016/j.freeradbiomed.2015.07.154. Epub 2015 Sep 21. Free Radic Biol Med. 2015. PMID: 26404168
-
Angiotensin II-induced skeletal muscle insulin resistance mediated by NF-kappaB activation via NADPH oxidase.Am J Physiol Endocrinol Metab. 2008 Feb;294(2):E345-51. doi: 10.1152/ajpendo.00456.2007. Epub 2007 Dec 11. Am J Physiol Endocrinol Metab. 2008. PMID: 18073321
-
The Emerging Roles of Nicotinamide Adenine Dinucleotide Phosphate Oxidase 2 in Skeletal Muscle Redox Signaling and Metabolism.Antioxid Redox Signal. 2019 Dec 20;31(18):1371-1410. doi: 10.1089/ars.2018.7678. Epub 2019 Nov 1. Antioxid Redox Signal. 2019. PMID: 31588777 Free PMC article. Review.
-
Oxidative stress and the etiology of insulin resistance and type 2 diabetes.Free Radic Biol Med. 2011 Sep 1;51(5):993-9. doi: 10.1016/j.freeradbiomed.2010.12.005. Epub 2010 Dec 13. Free Radic Biol Med. 2011. PMID: 21163347 Free PMC article. Review.
Cited by
-
Exercise-stimulated glucose uptake - regulation and implications for glycaemic control.Nat Rev Endocrinol. 2017 Mar;13(3):133-148. doi: 10.1038/nrendo.2016.162. Epub 2016 Oct 14. Nat Rev Endocrinol. 2017. PMID: 27739515 Review.
-
NOX2 deficiency exacerbates diet-induced obesity and impairs molecular training adaptations in skeletal muscle.Redox Biol. 2023 Sep;65:102842. doi: 10.1016/j.redox.2023.102842. Epub 2023 Aug 6. Redox Biol. 2023. PMID: 37572454 Free PMC article.
-
NADPH Oxidase 2 Mediates Myocardial Oxygen Wasting in Obesity.Antioxidants (Basel). 2020 Feb 19;9(2):171. doi: 10.3390/antiox9020171. Antioxidants (Basel). 2020. PMID: 32093119 Free PMC article.
-
Autophagy-induced degradation of Notch1, achieved through intermittent fasting, may promote beta cell neogenesis: implications for reversal of type 2 diabetes.Open Heart. 2019 May 22;6(1):e001028. doi: 10.1136/openhrt-2019-001028. eCollection 2019. Open Heart. 2019. PMID: 31218007 Free PMC article. No abstract available.
-
Pro-inflammatory hepatic macrophages generate ROS through NADPH oxidase 2 via endocytosis of monomeric TLR4-MD2 complex.Nat Commun. 2017 Dec 21;8(1):2247. doi: 10.1038/s41467-017-02325-2. Nat Commun. 2017. PMID: 29269727 Free PMC article.
References
-
- Evans J. L., Goldfine I. D., Maddux B. A., Grodsky G. M. (2002) Oxidative stress and stress-activated signaling pathways: a unifying hypothesis of type 2 diabetes. Endocr. Rev. 23, 599–622 - PubMed
-
- Dupuy C., Ohayon R., Valent A., Noël-Hudson M.-S., Dème D., Virion A. (1999) Purification of a novel flavoprotein involved in the thyroid NADPH oxidase: cloning of the porcine and human cDNAs. J. Biol. Chem. 274, 37265–37269 - PubMed
-
- Suh Y. A. (1999) Cell transformation by the superoxide-generating oxidase Mox1. Nature 401, 79–82 - PubMed
-
- Hidalgo C., Sánchez G., Barrientos G., Aracena-Parks P. (2006) A transverse tubule NADPH oxidase activity stimulates calcium release from isolated triads via ryanodine receptor type 1 S -glutathionylation. J. Biol. Chem. 281, 26473–26482 - PubMed
Publication types
MeSH terms
Substances
Grants and funding
- K01 DK084297/DK/NIDDK NIH HHS/United States
- P01 AG019316/AG/NIA NIH HHS/United States
- KL2 TR000118/TR/NCATS NIH HHS/United States
- P30 AG013319/AG/NIA NIH HHS/United States
- T32-HL007446/HL/NHLBI NIH HHS/United States
- R01 DK033665/DK/NIDDK NIH HHS/United States
- T32 HL007446/HL/NHLBI NIH HHS/United States
- UL1 TR000149/TR/NCATS NIH HHS/United States
- P30 CA054174/CA/NCI NIH HHS/United States
- UL1 TR001120/TR/NCATS NIH HHS/United States
- KL2-TR000118/TR/NCATS NIH HHS/United States
- R01 DK033665-24/DK/NIDDK NIH HHS/United States
- UL1-TR000149/TR/NCATS NIH HHS/United States
LinkOut - more resources
Full Text Sources
Molecular Biology Databases
Miscellaneous
