. 2015 Apr 13;27(4):589-602.
doi: 10.1016/j.ccell.2015.02.016. Epub 2015 Mar 26.

Pharmacologic inhibition of the Menin-MLL interaction blocks progression of MLL leukemia in vivo

Affiliations

Pharmacologic inhibition of the Menin-MLL interaction blocks progression of MLL leukemia in vivo

Dmitry Borkin et al. Cancer Cell. .

Abstract

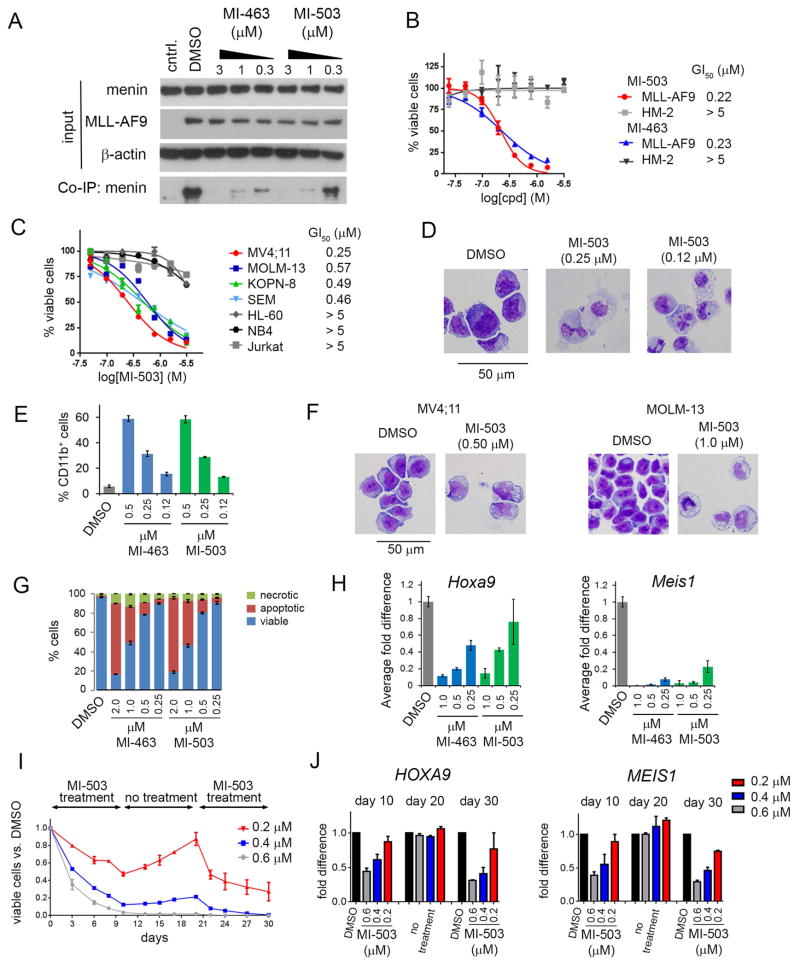
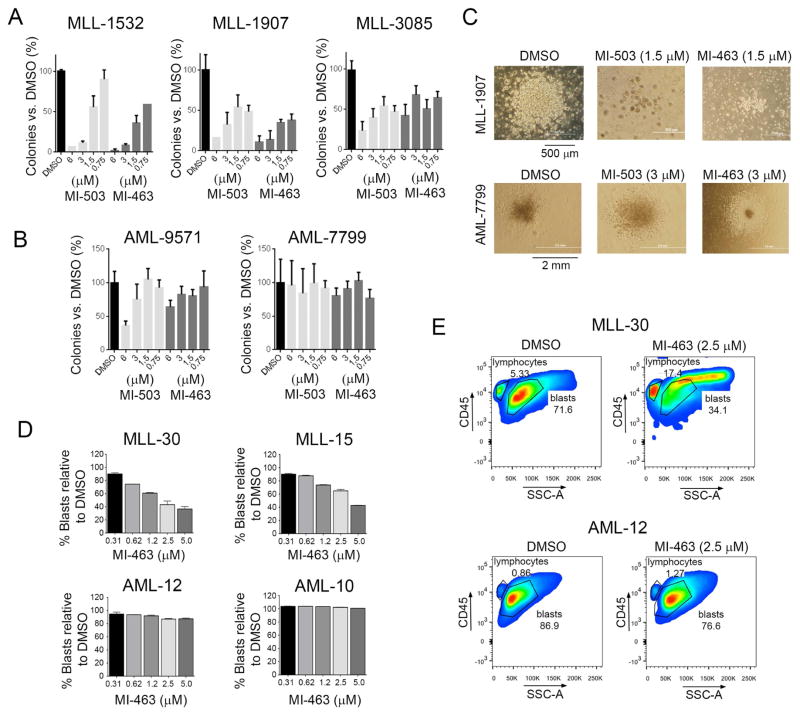
Chromosomal translocations affecting mixed lineage leukemia gene (MLL) result in acute leukemias resistant to therapy. The leukemogenic activity of MLL fusion proteins is dependent on their interaction with menin, providing basis for therapeutic intervention. Here we report the development of highly potent and orally bioavailable small-molecule inhibitors of the menin-MLL interaction, MI-463 and MI-503, and show their profound effects in MLL leukemia cells and substantial survival benefit in mouse models of MLL leukemia. Finally, we demonstrate the efficacy of these compounds in primary samples derived from MLL leukemia patients. Overall, we demonstrate that pharmacologic inhibition of the menin-MLL interaction represents an effective treatment for MLL leukemias in vivo and provide advanced molecular scaffold for clinical lead identification.


Conflict of interest statement

Conflict of interest

The authors have no relevant conflict of interest.

Figures

Figure 1
Figure 1. Structure-based development of potent menin-MLL inhibitors
(A) Chemical structure and in vitro activity for MI-136. IC50 was measured by fluorescence polarization assay and Kd was determined by Isothermal Titration Calorimetry (ITC). (B) Summary of structure-activity relationship for menin-MLL inhibitors. R1, R2 and R3 indicate substitution sites explored for modifications. Best substituents at R1, R2 and R3 positions are shown. (C) Structures and activities of MI-463 and MI-503 menin-MLL inhibitors. (D) Binding isotherm from ITC for MI-503 binding to menin, demonstrating binding affinity (Kd) and stoichiometry (N). (E) Crystal structure of MI-503 bound to menin. Protein is shown in ribbon representation and key menin residues involved in interactions with MI-503 are shown as sticks. MI-503 is shown in stick representation with colors corresponding to the atom type (green: carbons, dark blue: nitrogens, yellow: sulfur, light blue: fluorine). Dashed lines represent hydrogen bonds between the ligand and protein. See also Figure S1 and Tables S1, S2 and S3.
Figure 2
Figure 2. Activity of menin-MLL inhibitors in MLL leukemia cells
(A) Co-immunoprecipitation experiment in HEK293 cells transfected with MLL-AF9 upon treatment with DMSO, MI-463 and MI-503. Control (cntrl) represents an untransfected sample. (B) Titration curves from MTT cell viability assay after 7 days of treatment with MI-463 and MI-503 of MLL-AF9 and Hoxa9/Meis1 (HM-2) transformed murine bone marrow cells (BMCs); mean ± SD, n = 4. (C) Titration curves from MTT assay performed for 7 days of treatment of human MLL leukemia cell lines with MI-503: MV4;11 (MLL-AF4), MOLM-13 (MLL-AF9), KOPN-8 (MLL-ENL) and SEM (MLL-AF4) and control AML cell lines without MLL translocations: HL-60, NB4 and Jurkat; mean ± SD, n = 4. (D) Wright-Giemsa-stained cytospins for MLL-AF9 transformed BMCs after 10 days of treatment with MI-503. (E) Quantification of CD11b expression in MLL-AF9 transformed BMCs treated for 7 days with MI-463 and MI-503 detected by flow cytometry; mean ± SD, n = 2. (F) Wright-Giemsa-stained cytospins for MV4;11 and MOLM-13 after 7 days of treatment with MI-503. (G) Apoptosis and cell death induced by MI-463 and MI-503 after 7 days of treatment in the MLL-AF9 BMC. Quantification of Annexin V and Propidium Iodide (PI) staining was detected by flow cytometry; mean ± SD, n = 2. (H) Quantitative real-time PCR performed in MLL-AF9 BMCs after 6 days of treatment with MI-463 and MI-503. Expression of Hoxa9 and Meis1 was normalized to β-actin and referenced to DMSO-treated cells; mean ± SD, n = 2. (I) Long term viability studies with different concentrations of MI-503 in MV4;11 cells. Cells were treated for 10 days, followed by 10 days of no treatment with subsequent 10 days of additional treatment. Viable cells were normalized to DMSO control. (J) Quantitative RT- PCR performed in MV4;11 cells upon treatment with MI-503 or DMSO at the end of each treatment or withdrawal phase (days 10, 20 and 30). Expression of HOXA9 and MEIS1 was normalized to 18S rRNA and referenced to DMSO-treated cells. Data in I and J represent mean values for duplicates ± SD. See also Figure S2.
Figure 3
Figure 3. Effect of menin-MLL inhibitors on gene expression in MLL-rearranged human leukemia cells
(A, B) Gene Set Enrichment Analysis (GSEA) of genes downregulated upon treatment with MI-389 in MV4;11 cells as compared with genes bound by MLL-AF4 in human SEM cells (Guenther et al., 2008) (A) or MLL-AF9 targets (Bernt et al., 2011) (B). (C) GSEA of genes upregulated by MI-389 treatment of MV4;11 cells as compared with genes underexpressed in primitive hematopoietic progenitor cells (Jaatinen et al., 2006). The heat maps show genes comprising the leading edge of the GSEA plots. Red indicates high expression, blue indicates low expression. Triplicate samples were used for global gene expression studies. NES: Normalized Enrichment Score, FDR: False Discovery Rate. (D) Quantitative RT-PCR performed in MV4;11 cells after 10 days of treatment with 0.6 μM of MI-503. (E) Quantitative RT-PCR performed in MOLM-13 cells after 6 days of treatment with MI-389 (2 μM) or MI-503 (1 μM). Expression of genes in (D) and (E) was normalized to 18S rRNA and referenced to DMSO-treated cells. Data in (D) and (E) represent mean values for duplicates ± SD. See also Figure S3 and Table S4.
Figure 4
Figure 4. Menin-MLL inhibitors block hematological tumors in vivo, increase survival and reduce MLL leukemia tumor burden
(A) Pharmacokinetic studies in mice performed for MI-503 (top panel, mean ± SD, n = 2) and MI-463 (bottom panel, mean ± SD, n = 2) demonstrating blood concentration of the compounds after oral (p.o.) dose of 30 mg/kg or 100 mg/kg as well as intravenous (i.v.) administration at 15 mg/kg. (B) In vivo inhibition of the tumor growth by MI-503 (top panel) and MI-463 (bottom panel) after subcutaneous injection of 1 × 10⁷ MV4;11 cells into BALB/c nude mice, n = 6 per group. Mice were treated once daily with MI-503 (60 mg/kg) or MI-463 (35 mg/kg) via i.p. (p < 0.003 for each compound). Error bars represent SEM. (C) Expression of HOXA9 and MIES1 measured by qRT-PCR of RNA extracted from tumor samples harvested at the end point of treatment with MI-503 (day 38, top panel) or MI-463 (day 28, bottom panel). HOXA9 and MEIS1 transcripts levels are normalized to the mean transcript level in tumors from the vehicle treated groups; n = 4 per group. Boxes represent the first and third quartiles, the line represents the median and the whiskers show the lowest and the highest values. (D) Bioluminescent imaging of NSGS mice transplanted with MV4;11 human MLL leukemia cells expressing luciferase at the indicated days after initiation of treatment with MI-503 (60 mg/kg, twice daily every 12 hr, i.p.) or vehicle, n = 9 mice per group. (E) Quantification of bioluminescence imaging in NSG mice transplanted with luciferase-expressing MV4;11 cells at the indicated days after initiation of treatment with MI-463 (45 mg/kg, twice daily, p.o.) or vehicle, n = 6–7 mice per group. Error bars represent SEM. (F) Bioluminescence imaging of mice from panel (E) at the last day of treatment (day 20). (G) Flow cytometry quantification of human CD45+ cells in blood, spleen and bone marrow samples harvested from NSG mice transplanted with MV4;11 cells after last treatment (day 20) with MI-463 or vehicle. Error bars represent SEM, n = 5–6. (H) Expression of HOXA9, MIES1, MEF2C and ITGAM measured by qRT-PCR of RNA extracted from spleen samples harvested after last treatment (day 20) with MI-463 or vehicle. Transcripts levels are normalized to GAPDH and referenced to the mean transcript level in vehicle treated group, which is set as 1 (n = 6 independent samples per group). Error bars represent SEM. See also Figure S4.
Figure 5
Figure 5. Treatment with menin-MLL inhibitor blocks progression of MLL leukemia in vivo
(A) Kaplan-Meier survival curves of vehicle and MI-503 or MI-463 treated C57BL/6 mice transplanted with 1 × 10⁵ syngeneic MLL-AF9 leukemic cells isolated from primary recipient mice (n = 9 mice per group). Time of treatment is indicated on each graph. P values were calculated using Log-rank (Mantel-Cox) test, and are p < 0.0001 for each compound. (B) Representative photographs of the spleen from control and MI-463 treated (40 mg/kg, twice daily, p.o.) MLL-AF9 leukemia mice (n = 6–7 mice per group). Treatment was initiated 5 days after transplantation and continued for 10 days. Samples from all mice were collected one day after treatment was stopped. (C) Comparison of spleen weight for the MLL-AF9 leukemia mice treated with vehicle (n = 6) or MI-463 (n = 7), treatment as described in panel (B); mean ± SEM. (D) Quantification of leukemic blasts in bone marrow of MLL-AF9 leukemia mice upon treatment with MI-463 or vehicle (n = 6 mice per group) by flow cytometry analysis. GFP (Green Fluorescent Protein) is detected as a surrogate for MLL-AF9 expressed from the MigR1 vector, reflecting MLL-AF9 expressing leukemic blasts. Boxes represent the first and third quartiles, the line represents the median and the whiskers show the lowest and the highest values. (E) Representative histograms from flow cytometry analysis of the leukemic blasts in bone marrow samples of the MLL-AF9 mice treated with vehicle or MI-463. SS – side scatter. (F) Histological sections of liver parenchyma from control and MI-463 treated mice. (G) Wright-Giemsa-stained cytospins for bone marrow samples isolated from MLL-AF9 mice treated with MI-463 and vehicle (treatment described in B). Bone marrow cells with neutrophil-like morphology in MI-463 treated mice are indicated by black arrows. (H) Treatment with MI-463 reduces white blood cell (WBC) level in the peripheral blood; mean ± SEM, n = 6. (I) Expression of Hox9, Meis1, Mef2c, Flt3 and Itgam measured by qRT-PCR of RNA extracted from bone marrow samples harvested the next day after last treatment (treatment was continued for 10 days) with MI-463 or vehicle. Transcripts levels are normalized to β-actin and referenced to the mean transcript level in vehicle treated group, which is set as 1 (n = 4 replicates per group). Boxes represent the first and third quartiles, the line represents the median, and the whiskers show the lowest and the highest values. See also Figure S5.
Figure 6
Figure 6. Pharmacologic inhibition of the menin-MLL interaction does not impair normal hematopoiesis in mice
(A) Analysis of bone marrow (BM) cellularity after 10 days of treatment of normal C57BL/6 mice with MI-463 (40 mg/kg), MI-503 (70 mg/kg) or vehicle control (twice daily via oral gavage; n = 8–9/group, mean ± SD). ns – not significant. (B) Representative histograms from flow cytometry analysis of hematopoietic stem and progenitor cells: LSK (LinSca-1+c-Kit+) and long-term repopulating cells (LT-HSC, defined as LinSca-1+c-Kit+CD48CD150+), left panel. Right panel: quantification of LSK and LT-HSC cell frequency by flow cytometry (n = 8–9/group, mean +/− SD), *p<0.05, ***p<0.001 (treatment described in panel A). (C) Representative histograms (left panel) and quantification (right panel) from fIow cytometry analysis of mature myeloid cells in bone marrow (BM) samples isolated from mice treated with vehicle, MI-463 or MI-503 (n = 8–9/group, mean ± SD); treatment described in panel (A). (D) Representative histograms (left panel) and quantification (right panel) from flow cytometry analysis of BM pro-B cell populations (B220+CD43hisIgMnegCD19+AA4.1+) (n = 8–9/group, mean ± SD). *p<0.05. (E) Expression of Hoxa9 measured by qRT-PCR of RNA extracted from LSK cells harvested after 10 days of treatment with MI-463, MI-503 or vehicle. Transcripts levels are normalized to Hprt1 and referenced to the mean transcript level in vehicle treated group, which is set as 1 (n = 5–6 per group), mean ± SD. (F) Analysis of bone marrow cellularity and mature myeloid cells after 38 days of treatment with MI-503 (60 mg/kg, once daily, i.p.) or vehicle in the subcutaneous MV4;11 xenograft mice (BALB/c nude); mean ± SD, n = 5–6 per group. (G) Analysis of hematopoietic progenitor cells after 38 days of treatment with MI-503 (60 mg/kg, once daily, i.p., n = 5–6/group, mean ± SD). Analysis was performed in the subcutaneous MV4;11 xenograft mice (BALB/c nude), *p<0.05. See also Figure S6.
Figure 7
Figure 7. Menin-MLL inhibitors selectively kill MLL leukemia primary patient samples
(A, B) Colony counts for methylcellulose colony forming assay performed upon 14 days of treatment with MI-463 and MI-503 in primary patient samples with MLL leukemia (A) and in AML primary patient samples without MLL translocations (B). Colony counts are normalized to DMSO treated samples (mean ± SD, n= 2). (C) Pictures of colonies in one primary sample with MLL translocation (MLL-1907, top) and one AML primary sample without MLL translocation (AML-7799, bottom) treated as indicated. (D) Flow cytometry analysis of human CD45+ cells upon 7 days of treatment of primary patient samples with MLL translocations (MLL-30, MLL-15) and without MLL translocations (AML-12, AML-10) with MI-463 or DMSO. Percentage of blasts in each sample is shown (mean ± SD, n = 2). (E) Histograms from flow cytometry analysis of blasts level (hCD45+ cells) upon treatment of primary patient samples with MI-463 and DMSO. See also Figure S7.

Comment in

Similar articles

Cited by

References

    1. Artinger EL, Mishra BP, Zaffuto KM, Li BE, Chung EK, Moore AW, Chen Y, Cheng C, Ernst P. An MLL-dependent network sustains hematopoiesis. Proc Natl Acad Sci U S A. 2013;110:12000–12005. - PMC - PubMed
    1. Bernt KM, Zhu N, Sinha AU, Vempati S, Faber J, Krivtsov AV, Feng Z, Punt N, Daigle A, Bullinger L, et al. MLL-rearranged leukemia is dependent on aberrant H3K79 methylation by DOT1L. Cancer Cell. 2011;20:66–78. - PMC - PubMed
    1. Caslini C, Yang Z, El-Osta M, Milne TA, Slany RK, Hess JL. Interaction of MLL amino terminal sequences with menin is required for transformation. Cancer Res. 2007;67:7275–7283. - PMC - PubMed
    1. Daigle SR, Olhava EJ, Therkelsen CA, Majer CR, Sneeringer CJ, Song J, Johnston LD, Scott MP, Smith JJ, Xiao Y, et al. Selective killing of mixed lineage leukemia cells by a potent small-molecule DOT1L inhibitor. Cancer Cell. 2011;20:53–65. - PMC - PubMed
    1. Dawson MA, Prinjha RK, Dittmann A, Giotopoulos G, Bantscheff M, Chan WI, Robson SC, Chung CW, Hopf C, Savitski MM, et al. Inhibition of BET recruitment to chromatin as an effective treatment for MLL-fusion leukaemia. Nature. 2011;478:529–533. - PMC - PubMed

Publication types

MeSH terms