

Spring-loaded unraveling of a single SNARE complex by NSF in one round of ATP turnover
- PMID: 25814585
- PMCID: PMC4441202
- DOI: 10.1126/science.aaa5267
Spring-loaded unraveling of a single SNARE complex by NSF in one round of ATP turnover
Abstract
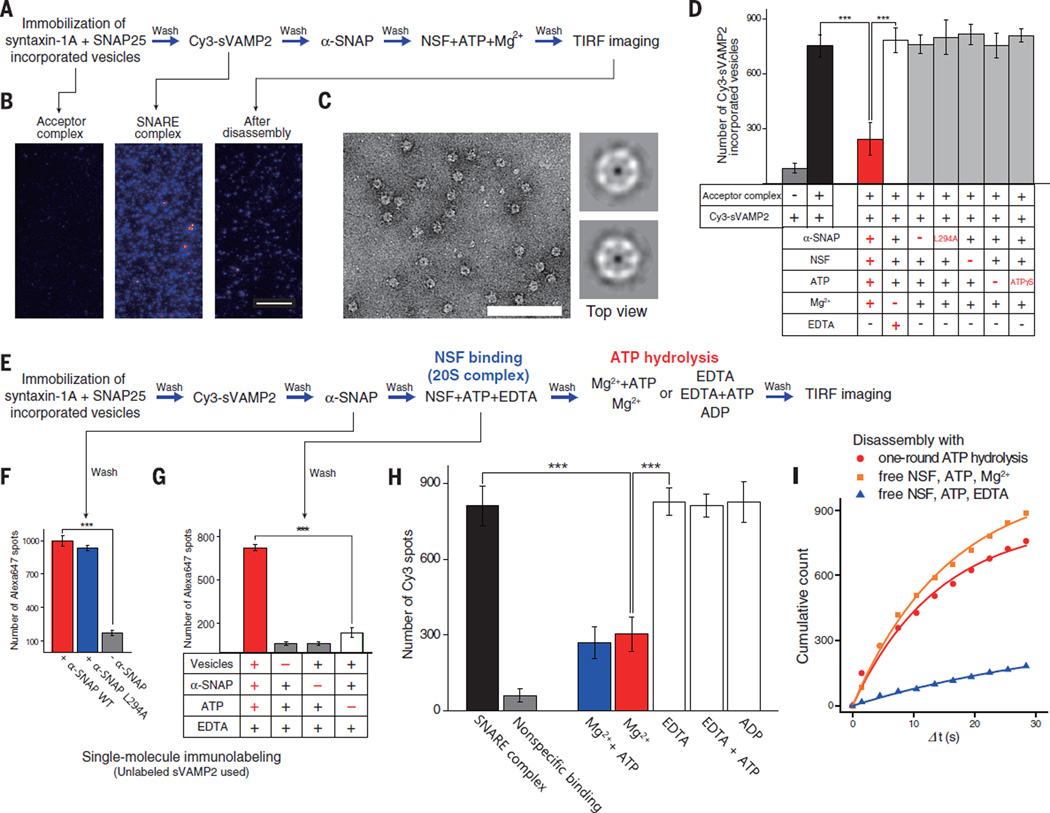
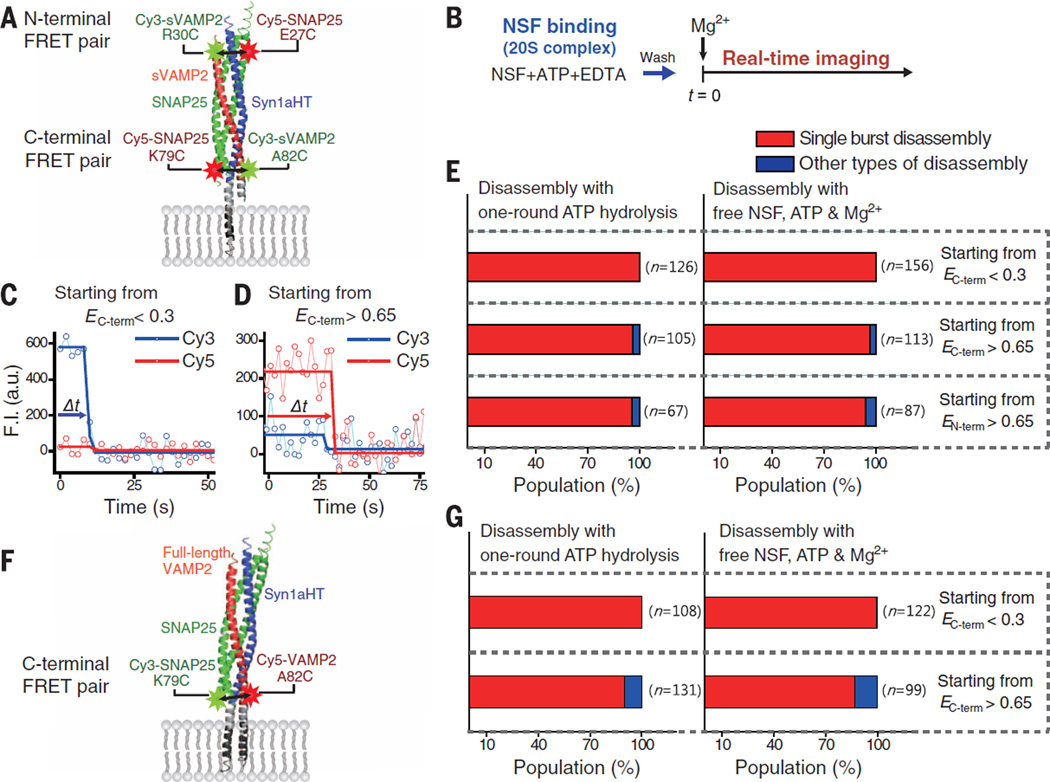
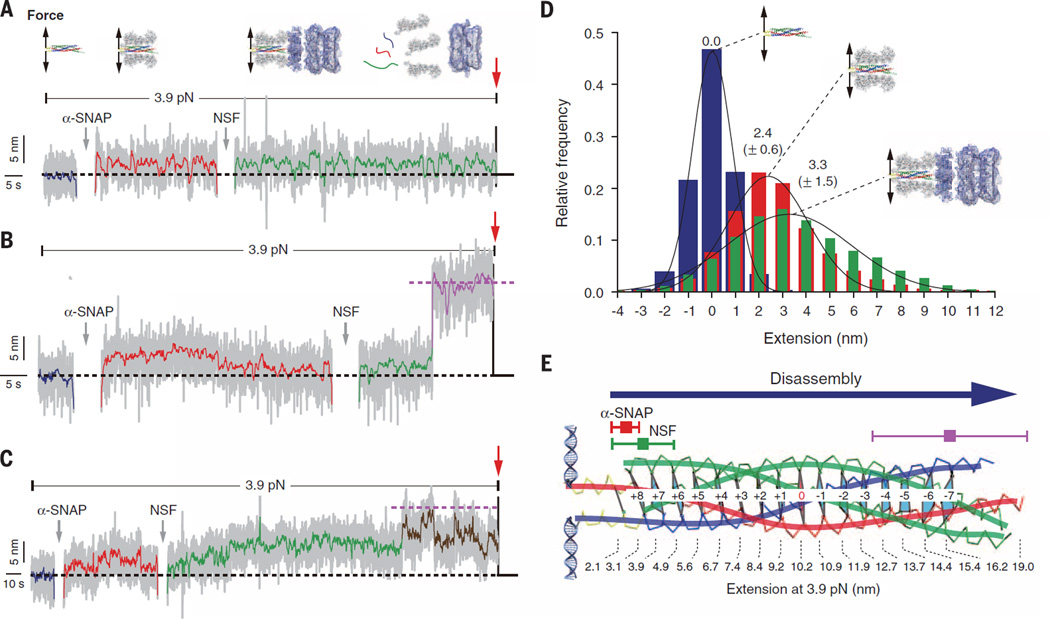
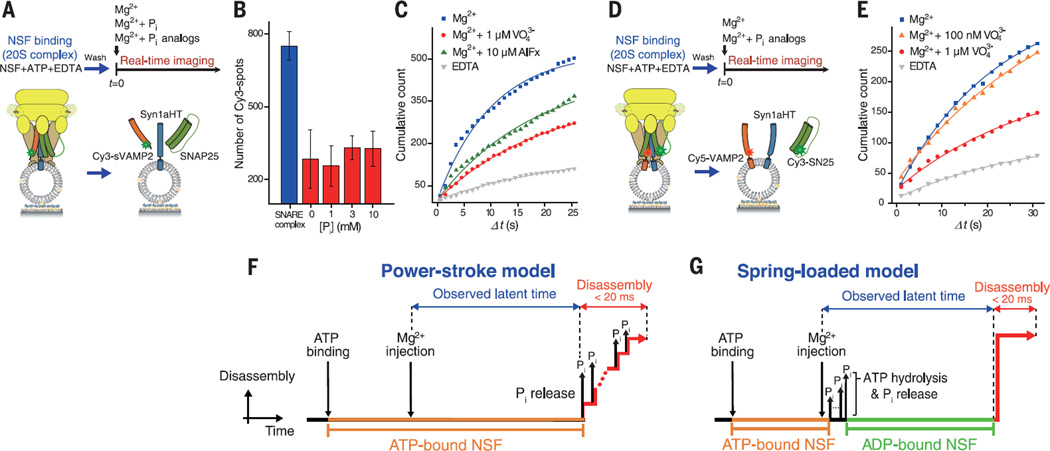
During intracellular membrane trafficking, N-ethylmaleimide-sensitive factor (NSF) and alpha-soluble NSF attachment protein (α-SNAP) disassemble the soluble NSF attachment protein receptor (SNARE) complex for recycling of the SNARE proteins. The molecular mechanism by which NSF disassembles the SNARE complex is largely unknown. Using single-molecule fluorescence spectroscopy and magnetic tweezers, we found that NSF disassembled a single SNARE complex in only one round of adenosine triphosphate (ATP) turnover. Upon ATP cleavage, the NSF hexamer developed internal tension with dissociation of phosphate ions. After latent time measuring tens of seconds, NSF released the built-up tension in a burst within 20 milliseconds, resulting in disassembly followed by immediate release of the SNARE proteins. Thus, NSF appears to use a "spring-loaded" mechanism to couple ATP hydrolysis and unfolding of substrate proteins.
Copyright © 2015, American Association for the Advancement of Science.
Figures
Similar articles
-
Disassembly of all SNARE complexes by N-ethylmaleimide-sensitive factor (NSF) is initiated by a conserved 1:1 interaction between α-soluble NSF attachment protein (SNAP) and SNARE complex.J Biol Chem. 2013 Aug 23;288(34):24984-91. doi: 10.1074/jbc.M113.489807. Epub 2013 Jul 8. J Biol Chem. 2013. PMID: 23836889 Free PMC article.
-
Extreme parsimony in ATP consumption by 20S complexes in the global disassembly of single SNARE complexes.Nat Commun. 2021 May 28;12(1):3206. doi: 10.1038/s41467-021-23530-0. Nat Commun. 2021. PMID: 34050166 Free PMC article.
-
Cellular functions of NSF: not just SNAPs and SNAREs.FEBS Lett. 2007 May 22;581(11):2140-9. doi: 10.1016/j.febslet.2007.03.032. Epub 2007 Mar 21. FEBS Lett. 2007. PMID: 17397838 Free PMC article. Review.
-
A conserved membrane attachment site in alpha-SNAP facilitates N-ethylmaleimide-sensitive factor (NSF)-driven SNARE complex disassembly.J Biol Chem. 2009 Nov 13;284(46):31817-26. doi: 10.1074/jbc.M109.045286. Epub 2009 Sep 17. J Biol Chem. 2009. PMID: 19762473 Free PMC article.
-
Requirements for the catalytic cycle of the N-ethylmaleimide-Sensitive Factor (NSF).Biochim Biophys Acta. 2012 Jan;1823(1):159-71. doi: 10.1016/j.bbamcr.2011.06.003. Epub 2011 Jun 13. Biochim Biophys Acta. 2012. PMID: 21689688 Free PMC article. Review.
Cited by
-
Interactions between a subset of substrate side chains and AAA+ motor pore loops determine grip during protein unfolding.Elife. 2019 Jun 28;8:e46808. doi: 10.7554/eLife.46808. Elife. 2019. PMID: 31251172 Free PMC article.
-
Structural and kinetic basis for the regulation and potentiation of Hsp104 function.Proc Natl Acad Sci U S A. 2020 Apr 28;117(17):9384-9392. doi: 10.1073/pnas.1921968117. Epub 2020 Apr 10. Proc Natl Acad Sci U S A. 2020. PMID: 32277033 Free PMC article.
-
Recent Advances in Deciphering the Structure and Molecular Mechanism of the AAA+ ATPase N-Ethylmaleimide-Sensitive Factor (NSF).J Mol Biol. 2016 May 8;428(9 Pt B):1912-26. doi: 10.1016/j.jmb.2015.10.026. Epub 2015 Nov 3. J Mol Biol. 2016. PMID: 26546278 Free PMC article. Review.
-
A simple DNA handle attachment method for single molecule mechanical manipulation experiments.Protein Sci. 2016 Aug;25(8):1535-44. doi: 10.1002/pro.2952. Epub 2016 Jun 6. Protein Sci. 2016. PMID: 27222403 Free PMC article.
-
Focused clamping of a single neuronal SNARE complex by complexin under high mechanical tension.Nat Commun. 2018 Sep 7;9(1):3639. doi: 10.1038/s41467-018-06122-3. Nat Commun. 2018. PMID: 30194295 Free PMC article.
References
Publication types
MeSH terms
Substances
Grants and funding
LinkOut - more resources
Full Text Sources
Other Literature Sources
Molecular Biology Databases
