. 2015 May 15;26(10):1797-810.
doi: 10.1091/mbc.E14-11-1500. Epub 2015 Mar 25.

Competition between RNA-binding proteins CELF1 and HuR modulates MYC translation and intestinal epithelium renewal

Affiliations

Competition between RNA-binding proteins CELF1 and HuR modulates MYC translation and intestinal epithelium renewal

Lan Liu et al. Mol Biol Cell. .

Abstract

The mammalian intestinal epithelium is one of the most rapidly self-renewing tissues in the body, and its integrity is preserved through strict regulation. The RNA-binding protein (RBP) ELAV-like family member 1 (CELF1), also referred to as CUG-binding protein 1 (CUGBP1), regulates the stability and translation of target mRNAs and is implicated in many aspects of cellular physiology. We show that CELF1 competes with the RBP HuR to modulate MYC translation and regulates intestinal epithelial homeostasis. Growth inhibition of the small intestinal mucosa by fasting in mice was associated with increased CELF1/Myc mRNA association and decreased MYC expression. At the molecular level, CELF1 was found to bind the 3'-untranslated region (UTR) of Myc mRNA and repressed MYC translation without affecting total Myc mRNA levels. HuR interacted with the same Myc 3'-UTR element, and increasing the levels of HuR decreased CELF1 binding to Myc mRNA. In contrast, increasing the concentrations of CELF1 inhibited formation of the [HuR/Myc mRNA] complex. Depletion of cellular polyamines also increased CELF1 and enhanced CELF1 association with Myc mRNA, thus suppressing MYC translation. Moreover, ectopic CELF1 overexpression caused G1-phase growth arrest, whereas CELF1 silencing promoted cell proliferation. These results indicate that CELF1 represses MYC translation by decreasing Myc mRNA association with HuR and provide new insight into the molecular functions of RBPs in the regulation of intestinal mucosal growth.


Figures

FIGURE 1:
FIGURE 1:
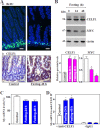
Fasting-induced intestinal mucosal atrophy associates with an increased CELF1 but decreased MYC. (A) Changes in cell proliferation as measured by BrdU labeling (a) and immunohistochemical staining of CELF1 (b) in small intestinal mucosa after fasting for 48 h. Green, BrdU, 1 h after injection, S-phase; brown, CELF1. (B) Changes in the levels of CELF1 and MYC proteins in control mice and mice fasted for 24 or 48 h. Top, representative immunoblots of CELF1 and MYC proteins; bottom, quantitative analysis of the immunoblotting signals as measured by densitometry. Values are the means ± SEM (n = 3). *, p < 0.05 compared with control. (C) Levels of Myc mRNA as measured by RT-qPCR analysis in the mucosa described in B. (D) Association of CUGBP1 with Myc mRNA in small intestinal mucosa as measured by RNP-IP/RT-qPCR analysis. After IP of RNA–protein complexes using either anti-CELF1 antibody (Ab) or control IgG1, RNA was isolated and measured with RT-qPCR analysis. The levels of Myc mRNA in IP material were normalized to the levels of Gapdh mRNA in each sample; values are the means ± SEM (n = 5).
FIGURE 2:
FIGURE 2:
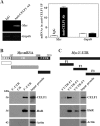
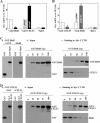
CELF1 binds the 3′-UTR of Myc mRNA via a GRE. (A) Association of endogenous CELF1 with endogenous Myc mRNA in IEC-6 cells. The levels of Myc mRNA in samples immunoprecipitated by using anti-CELF1 antibody (Ab) or control IgG1 were measured by RT-PCR (left) and RT-qPCR (right) analyses. Low-level amplification of Gapdh mRNA served to monitor the evenness in sample input. Values are the means ± SEM from triplicate samples. (B) Representative CELF1 and HuR immunoblots using the pull-down materials by biotinylated transcripts of the Myc 5′-UTR, CR, or 3′-UTR. Top, schematic representation of the biotinylated transcripts used in this study. Cytoplasmic lysates were incubated with 6 μg biotinylated Myc 5′-UTR, CR, or 3′-UTR, and the resulting RNP complexes were pulled down by using streptavidin-coated beads. The presence of CUGBP1 or HuR in the pull-down material was assayed by Western blotting. β-Actin in the pull-down material was also examined and served as a negative control. (C) Binding of CELF1 or HuR to different fractions of 3′-UTR of the Myc mRNA. Top, schematic representation of the Myc 3′-UTR biotinylated transcripts. After incubation of cytoplasmic lysates with various fractions (F1–F3) of the Myc 3′-UTR, the resulting RNP complexes were pulled down, and the abundance of CELF1, HuR, and β-actin proteins in the pull-down material was examined.
FIGURE 3:
FIGURE 3:
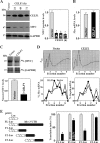
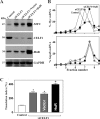
CELF1 overexpression inhibits MYC translation via the Myc 3′-UTR. (A) Changes in the levels of MYC after ectopic CELF1 overexpression. Cells were transfected with the vector expressing CELF1 or control empty vector; protein levels were assessed by Western blot analysis at various times after the transfection. Left, representative immunoblots of CELF1 and MYC proteins; right, quantitative analysis of the immunoblotting signals as measured by densitometry. Values are the means ± SEM (n = 3). *, p < 0.05 compared with vector. (B) Levels of Myc mRNA 48 h after transfection, as measured by RT-qPCR analysis. Data were normalized to Gapdh mRNA levels, and values are shown as the means ± SEM (n = 3). (C) Newly translated MYC protein in cells treated as described in B. Cells were incubated with l-[35S]methionine and l-[35S]cysteine for 20 min; this was followed by IP by using anti-MYC antibody, resolving immunoprecipitated samples by SDS–PAGE, and transferring for visualization of signals by using a PhosphorImager. The translation of housekeeping control GAPDH was measured similarly. (D) Distributions of Myc and Gapdh mRNAs in each gradient fraction of polysomal profile in cells described in B. Top, polysomal profiles in cells described in B. Nuclei were pelleted, and the resulting supernatants were fractionated through a 10–50% liner sucrose gradient. Bottom, the levels of Myc and Gapdh mRNAs in different fractions as measured by RT-qPCR analysis and plotted as a percentage of the levels of total Myc mRNA (left) and Gapdh mRNA (right). (E) Changes in MYC translation efficiency as measured by Myc 3′-UTR luciferase reporter assays. Left, schematic of plasmids: control (pGL3-Luc); chimeric firefly luciferase–full-length Myc 3′-UTR (FL-Luc); and luciferase–various Myc 3-UTR fractions (F). Right, levels of activities of luciferase reporters containing Myc 3′-UTR or its different fractions. Forty-eight hours after the Luc reporters or pGL3-Luc (negative control) were cotransfected with a Renilla luciferase reporter, luciferase activity was measured using the Dual Luciferase Assay System. For measurement of translational changes, the ratio of firefly luciferase to Renilla luciferase was further normalized to the levels of Firefly and Renilla mRNAs. The values were expressed as means ± SEM (n = 3). *, p < 0.05 compared with cells transfected with control vector.
FIGURE 4:
FIGURE 4:
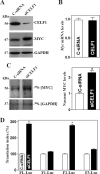
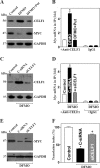
CELF1 silencing enhances MYC translation. (A) Representative immunoblots of CELF1 and MYC proteins. Forty-eight hours after cells were transfected with either siRNA targeting the CELF1 mRNA CR (siCELF1) or control siRNA (C-siRNA), whole-cell lysates were harvested for Western blot analysis. (B) Levels of Myc mRNA as measured by RT-qPCR analysis in cells described in A. The data were normalized to Gapdh mRNA levels and are shown as the means ± SEM of data from triplicate experiments. (C) Newly translated MYC protein in cells described in A as measured by [35S]methionine/[35S]cysteine incorporation assays. Left, immunoblots; right panel, quantitative analysis of the immunoblotting signals as measured by densitometry. Values are the means ± SEM (n = 3). *, p < 0.05 compared with C-siRNA. (D) Changes in MYC translation efficiency as measured by using Myc 3′-UTR luciferase reporter assays in cells described in A. Twenty-four hours after cells were transfected with the Luc-Myc-3′-UTR or pGL3-Luc, the levels of luciferase activity were examined and normalized to the mRNA levels to calculate the translation efficiencies.
FIGURE 5:
FIGURE 5:
HuR competitively represses [Myc mRNA-CELF1] association. (A) Changes in binding of Myc mRNA to CELF1 and HuR as detected by RNP-IP/RT-qPCR analysis in cells 48 h after transfection with siHuR or C-siRNA. Values are means ± SEM from triplicate samples. *, p < 0.05 compared with cells transfected with C-siRNA. (B) Binding of Myc mRNA to CELF1 and HuR 48 h after transfection with siCELF1 or C-siRNA. (C) Effect of GST-HuR added to the binding reaction on association of HuR or CELF1 with the Myc 3′-UTR: (a) GST-HuR fusion protein identified by anti-GST antibody (left) or recognized by anti-HuR antibody (right); (b) protein input in the binding reaction mixture; and (c) interactions of HuR and CELF1 with the Myc 3′-UTR. Various concentrations of GST-HuR were used; the levels of binding complexes were detected by pull-down assays. Three independent experiments were performed showing similar results. (D) Effect of GST-CELF1 on association of HuR or CELF1 with the Myc 3′-UTR: (a) GST-CELF1 fusion protein; (b) protein input in the binding reaction mixture; and (c) binding of HuR and CELF1 to the Myc 3′-UTR.
FIGURE 6:
FIGURE 6:
CELF1 silencing and HuR induction increase MYC translation synergistically. (A) Representative immunoblots of MYC, CELF1, and HuR in cells 48 h after transfection with siCELF1 alone or cotransfection with siCELF1 and the HuR expression vector. (B) Distributions of Myc (top) and Gapdh (bottom) mRNAs in each gradient fraction of polysomal profile in cells described in A. (C) Changes in MYC translation efficiency as measured by Myc 3′-UTR luciferase reporter assays. Values were expressed as means ± SEM of data from three separate experiments. *,+, p < 0.05 compared with cells transfected with control or siCELF1-trasfected cells, respectively.
FIGURE 7:
FIGURE 7:
Polyamine depletion represses MYC translation by inducing the association of CELF1 with Myc mRNA. (A) Representative immunoblots of CELF1 and MYC after polyamine depletion. Cells were exposed to DFMO alone or DFMO plus putrescine (Put) for 4 d; the levels of CELF1 and MYC proteins were examined by Western blot analysis. (B) Association of endogenous CELF1 with endogenous Myc mRNA as measured by RNP-IP/RT-qPCR analysis in cells described in A. Values are means ± SEM from three separate experiments. *, p < 0.05 compared with control cells and cells exposed to DFMO plus Put. (C) Representative immunoblots of CELF1 after CELF1 silencing. Cells were exposed to DFMO for 2 d and then transfected with siCELF1 or C-siRNA. Whole-cell lysates were harvested 48 h after the transfection in the presence of DFMO. (D) CELF1/Myc mRNA association in cells described in C. Values are means ± SEM of data from three separate experiments. *,+, p < 0.05 compared with control or cells transfected with siCELF1, respectively. (E) Changes in expression of MYC protein in cells described in C. (F) Changes in MYC translation efficiency as measured by Myc 3′-UTR luciferase reporter assays.
FIGURE 8:
FIGURE 8:
CELF1 results in G1-phase growth arrest. (A) Flow cytometric analysis of cell cycle distribution in Caco-2 cells transfected with CELF1 expression vector for 48 h. Black line: area; blue line: curve fit; FL2-A: DNA content. (B) The relative G1, S, and G2/M compartments calculated from data described in A. Values are the means of three separate experiments. *, p < 0.05 compared with vector. (C) Changes in cell numbers at different times after transfection with the CELF1 expression vector or control vector. Values are the means ± SEM (n = 6). *, p < 0.05 compared with control and cells transfected with control vector. (D and E) Flow cytometric analysis of cell cycle distribution in cells 48 h after transfection with siCELF1 or C-siRNA. *, p < 0.05 compared with C-siRNA. (F) Changes in cell numbers after CELF1 silencing. Values are the means ± SEM (n = 6). *, p < 0.05 compared with C-siRNA.

Similar articles

Cited by

References

    1. Abdelmohsen K, Pullmann R, Jr, Lal A, Kim HH, Galban S, Yang X, Blethrow JD, Walker M, Shubert J, Gillespie DA, Furneaux H, Gorospe M. Phosphorylation of HuR by Chk2 regulates SIRT1 expression. Mol Cell. 2007;25:543–557. - PMC - PubMed
    1. Brook JD, McCurrach ME, Harley HG, Buckler AJ, Church D, Aburatani H, Hunter K, Stanton VP, Thirion JP, Hudson T, et al. Molecular basis of myotonic dystrophy: expansion of a trinucleotide (CTG) repeat at the 3′ end of a transcript encoding a protein kinase family member. Cell. 1992;68:799–808. - PubMed
    1. Cao S, Xiao L, Ra JN, Zou T, Liu L, Zhang D, Turner DJ, Gorospe M, Wang JY. Inhibition of Smurf2 translation by miR-322/503 modulates TGF-β/Smad2 signaling and intestinal epithelial homeostasis. Mol Biol Cell. 2014;25:1234–1243. - PMC - PubMed
    1. Cardani R, Bugiardini E, Renna LV, Rossi G, Colombo G, Valaperta R, Novelli G, Botta A, Meola G. Overexpression of CUGBP1 in skeletal muscle from adult classic myotonic dystrophy type 1 but not from myotonic dystrophy type 2. PLoS One. 2013;8:e83777. - PMC - PubMed
    1. Casero RA, Jr, Marton LJ. Targeting polyamine metabolism and function in cancer and other hyperproliferative diseases. Nat Rev Drug Discov. 2007;6:373–390. - PubMed

Publication types