. 2015 May;25(5):633-44.
doi: 10.1101/gr.178426.114. Epub 2015 Mar 23.

Global variability in gene expression and alternative splicing is modulated by mitochondrial content

Affiliations

Global variability in gene expression and alternative splicing is modulated by mitochondrial content

Raul Guantes et al. Genome Res. 2015 May.

Abstract

Noise in gene expression is a main determinant of phenotypic variability. Increasing experimental evidence suggests that genome-wide cellular constraints largely contribute to the heterogeneity observed in gene products. It is still unclear, however, which global factors affect gene expression noise and to what extent. Since eukaryotic gene expression is an energy demanding process, differences in the energy budget of each cell could determine gene expression differences. Here, we quantify the contribution of mitochondrial variability (a natural source of ATP variation) to global variability in gene expression. We find that changes in mitochondrial content can account for ∼50% of the variability observed in protein levels. This is the combined result of the effect of mitochondria dosage on transcription and translation apparatus content and activities. Moreover, we find that mitochondrial levels have a large impact on alternative splicing, thus modulating both the abundance and type of mRNAs. A simple mathematical model in which mitochondrial content simultaneously affects transcription rate and splicing site choice can explain the alternative splicing data. The results of this study show that mitochondrial content (and/or probably function) influences mRNA abundance, translation, and alternative splicing, which ultimately affects cellular phenotype.


Figures

Figure 1.
Figure 1.
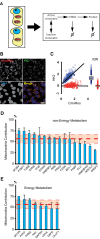
Mitochondrial contribution to protein variability. (A) Differences in the mitochondrial content of isogenic cells can act as a global factor generating variability in all steps of gene expression (chromatin remodeling, transcription, and translation) as well as affecting mRNA and protein stabilities. (B) Mitochondrial content (CMXRos) and protein levels (the enzyme Hexokinase 2 is shown here) are simultaneously quantified in single cells by fluorescence microscopy. (C) Dependence of HK2 protein levels as a function of mitochondrial content in a population of clonal cells (blue dots, r2= 0.62). CMXRos and protein values are normalized by their average levels. We decorrelate protein levels from mitochondria by rotating the distribution around the best-fit line (red dots). The box plots of both distributions are shown on the right. From the ratio of interquartile ranges (IQR) of the normal and detrended distributions, we can calculate the mitochondrial contribution to protein variability in the population. (D) Mitochondrial contribution to global variability (MCV) in protein levels from 16 housekeeping genes, none related to energy metabolism. (E) MCV in protein content from eight genes involved in energy metabolism. The thick red dashed line is the average contribution of all proteins. Thin lines are standard deviations. Error bars are standard deviations of three independent biological replicates (with 200–400 cells per experiment).
Figure 2.
Figure 2.
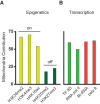
Mitochondrial contribution to variability in chromatin remodeling and transcription. Changes in mitochondrial content affect different molecular factors and biosynthetic processes involved in gene expression. (A) Mitochondrial contribution to variability in different epigenetic marks on histones associated with chromatin activation (yellow bars, “On” label) and chromatin repression (dark green bars, “Off” label). (B) Mitochondrial contribution to variability of factors responsible for transcription (green bars) and of transcriptional activities (measured as the amount of nascent RNA, Br-RNA, and total mRNA, poly[A], red bars).
Figure 3.
Figure 3.
Mitochondrial contribution to variability in translation. Mitochondrial contribution to variability in translation factors. (A) Yellow bars are elongation translation factors. (B) Heterogeneity in ribosomes and ribosome apparatus synthesis. YOYO-1 stain is specific for double-stranded RNA, which is almost exclusive of ribosomes. UBTF evidences ribosome biosynthesis, and NCL and NPM1 are involved in ribosome maturation. (C) Variability induced by mitochondria in protein synthesis: (red bars) nascent protein as measured by the precursor AHA, and activated protein synthesis, P-RPS6.
Figure 4.
Figure 4.
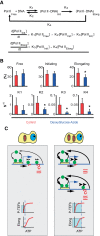
ATP dependence of RNA Pol II transcription kinetics. (A) Kinetic model for RNA Pol II transcription cycle (arrows with rate constants represent transitions) and the corresponding mass-action equations for the amount of initiating and elongating RNA Pol II. (B) Quantification of the fraction of free, initiating and elongating polymerase (first row) and the different rate constants (second row) by FLIP analysis of RNA Pol II-GFP (Supplemental Fig. S4; Supplemental Text). Red bars are values in control cells, and blue bars values in ATP-depleted cells (treated with deoxyglucose and azide). Error bars are SD. For each data point, at least 50 cells were used. (C) Cartoon of the different kinetic modes of RNA Pol II in cells with low (left) and high (right) ATP content. The cartoon exemplifies a typical gene with the promoter (yellow box) and RNA Pol II molecules (green circles), DNA (blue line), and RNA (red line). In cells with low mitochondrial content (left), RNA Pol II binds and detaches continuously at the promoter (arrow thickness illustrates the magnitude of the effect). A fraction of the RNA Pol II molecules are able to commit into elongation (arrow under the DNA). Then elongating RNA Pol II molecules track on the DNA at slow speed (illustrated by the arrowheads over RNA Pol II), which determines the speed of production of RNA (red lines). Once RNA Pol II finish the elongation phase, it detaches from DNA and RNA accumulates. At the bottom of the panel we show the dependency on ATP of the P-TEFb complex (kinase responsible for conversion of RNA Pol II into elongation mode) (hyperbolic kinetics, KM ∼30 μM). “Elong” stands for the elongating phase of RNA Pol II transcription cycle. This phase shows a sigmoidal dependency on ATP with a S0.5 ∼900 μM. Under low mitochondria (low ATP), the process of transition from initiation to elongation works near to full speed, but the speed of elongation is strongly diminished by the low ATP concentration. These two effects result in the accumulation of RNA Pol II molecules in the body of the gene due to the mismatch between entry and exit of RNA Pol II on the gene. In the right panel we illustrate the case of a cell with high mitochondrial mass. In these cells, more genes are active. The dynamic exchange of RNA Pol II molecules on the promoter is not affected: Although K1 and K2 are lower in cells with low mitochondria, the ratio between these constants is maintained (for this reason both arrows are thicker). The fraction of the RNA Pol II molecules that are able to commit to elongation (arrow under the DNA) is higher than in low mitochondria conditions. Then, RNA Pol II molecules elongate at high speed (thick arrowheads over elongating RNA Pol II). Therefore, more RNA molecules are produced per unit of time in high mitochondria conditions. As the speed of elongation is high, the speed of RNA Pol II detachment is higher than in low mitochondrial content cells (thicker arrow). At the bottom of the panel, we explain why the loading of RNA Pol II on DNA is higher in cells with high mitochondrial content. Under high ATP conditions, the complex P-TEFb is working at full speed and likewise the elongation phase of the transcription cycle. As both kinetic processes are balanced, the entry and exit of RNA Pol II on the gene are also balanced.
Figure 5.
Figure 5.
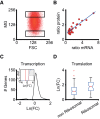
Genome-wide influence of mitochondrial content on gene expression. (A) HeLa cells were sorted according to the mitochondrial content after staining with MitoTracker Green FM. Two populations of cells were split for RNA-seq analysis, with a difference in average mitochondrial content of around fivefold (High and Low regions). (B) Correspondence between mRNA and protein content of 24 selected genes (Methods). The plot of the ratio (High level/Low level) of mRNA from RNA-seq experiments and the cognate protein from inmunostaining assays for equivalent cell populations is shown (correlation: r2= 0.8; slope: 0.36). (C) Distribution of logarithmic fold change (High/Low) ratios for all the genes belonging to the “transcription” family according to the gene ontology classification (Supplemental Table S1). The cumulative distribution (inset) shows that ∼50% of the transcription genes present differences in fold change larger than three (shaded area), which means approximately doubling protein content according to B. There is a small fraction of genes (∼3%) that are down-regulated, showing a threefold decrease in the High condition. (D) Box plot of the distributions of logarithmic fold changes for genes in the “translation” family, separating those coding for ribosomal proteins. These genes are specially affected by mitochondrial content.
Figure 6.
Figure 6.
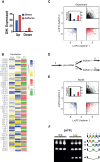
Effect of mitochondrial content on alternative splicing. (A) Variability in mRNA isoform expression is larger than variability in average gene expression. We show the fraction of isoforms up-regulated (FC > 3) or down-regulated (FC < 1/3, red bars) by mitochondrial content compared with the fraction of genes up- or down-regulated (blue bars). (B) Heat map displaying the levels of expression in High and Low cells (blue to yellow) and the logarithmic FC (red to green). This panel shows a group of genes in which alternative mRNA types are inverted in High versus Low cells. (C) Scatter plot of logarithmic FCs for pairs of alternatively spliced transcripts with FC > 10(FC < 1/10). The threshold value of FC (black squares) defines three domains in which AS is drastically altered by mitochondrial content: (black) both AS forms are overexpressed in mito-high conditions; (blue) both forms are down-regulated; (red) one form is overexpressed and the other is underexpressed. The inset shows the quantification of the fraction of dots in each domain. (D) Schematic representation of the two-step model involving pre-mRNA formation (with transcription rate k) and conversion to alternatively spliced forms with splicing rates α1 and α2. These mature mRNA forms can be degraded with rates δ1 and δ2, respectively. (E) Scatter plot of logarithmic fold changes for pairs of alternatively spliced forms simulated from the two-step model (see Supplemental Text for details). The threshold in FC and color code is the same as in B. (F) Changes in ATP affect alternative splicing. Jurkat cells treated for 12 h with deoxyglucose, which affects the splicing of PTPRC. Under low ATP conditions, the spliced form of PTPRC lacking exons 4, 5, and 6 is overexpressed. For both treatments, each line is a biological replicate.

Similar articles

Cited by

References

    1. Altschuler SJ, Wu LF. 2010. Cellular heterogeneity: do differences make a difference? Cell 141: 559–563. - PMC - PubMed
    1. Balázsi G, van Oudenaarden A, Collins JJ. 2011. Cellular decision making and biological noise: from microbes to mammals. Cell 144: 910–925. - PMC - PubMed
    1. Braunschweig U, Gueroussov S, Plocik AM, Graveley BR, Blencowe BJ. 2013. Dynamic integration of splicing within gene regulatory pathways. Cell 152: 1252–1269. - PMC - PubMed
    1. Brock A, Chang H, Huang S. 2009. Non-genetic heterogeneity—a mutation-independent driving force for the somatic evolution of tumours. Nat Rev Genet 10: 336–342. - PubMed
    1. Brown JM, Green J, das Neves RP, Wallace HA, Smith AJ, Hughes J, Gray N, Taylor S, Wood WG, Higgs DR, et al.2008. Association between active genes occurs at nuclear speckles and is modulated by chromatin environment. J Cell Biol 182: 1083–1097. - PMC - PubMed

Publication types