. 2015 Mar 26;519(7544):482-5.
doi: 10.1038/nature14281. Epub 2015 Mar 18.

N6-methyladenosine marks primary microRNAs for processing

Affiliations

N6-methyladenosine marks primary microRNAs for processing

Claudio R Alarcón et al. Nature. .

Abstract

The first step in the biogenesis of microRNAs is the processing of primary microRNAs (pri-miRNAs) by the microprocessor complex, composed of the RNA-binding protein DGCR8 and the type III RNase DROSHA. This initial event requires recognition of the junction between the stem and the flanking single-stranded RNA of the pri-miRNA hairpin by DGCR8 followed by recruitment of DROSHA, which cleaves the RNA duplex to yield the pre-miRNA product. While the mechanisms underlying pri-miRNA processing have been determined, the mechanism by which DGCR8 recognizes and binds pri-miRNAs, as opposed to other secondary structures present in transcripts, is not understood. Here we find in mammalian cells that methyltransferase-like 3 (METTL3) methylates pri-miRNAs, marking them for recognition and processing by DGCR8. Consistent with this, METTL3 depletion reduced the binding of DGCR8 to pri-miRNAs and resulted in the global reduction of mature miRNAs and concomitant accumulation of unprocessed pri-miRNAs. In vitro processing reactions confirmed the sufficiency of the N(6)-methyladenosine (m(6)A) mark in promoting pri-miRNA processing. Finally, gain-of-function experiments revealed that METTL3 is sufficient to enhance miRNA maturation in a global and non-cell-type-specific manner. Our findings reveal that the m(6)A mark acts as a key post-transcriptional modification that promotes the initiation of miRNA biogenesis.


Conflict of interest statement

Competing financial interests

The authors declare no competing financial interests.

Figures

Extended Data Figure 1
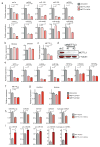
a, Unbiased search for cis-regulatory elements using the FIRE algorithm. FIRE motif discovery analysis of pre-miRNAs and pri-miRNA sequences as well as random sequences of the same length reveals over-representation of the METTL3 motif in pri-miRNAs sequences but not in pre-miRNAs. Yellow represents over-representation, and blue depicts under-representation of the motif. The magnitude of the over/under-representation is represented by the linear scale heat-map on the left. A schematic representation of a pre and a pri-miRNA is shown on the right. b, qRT-PCR and western blot (c) quantifications of METTL3 upon transduction with two independent shRNAs targeting METTL3 (METTL3 KD1 and METTL3 KD2) in MDA-MB-231 cells. Samples were normalized to GAPDH. The data from biological triplicates is shown. Bar graphs represent a linear scale and error bars represent s.d. ***, p-value <5E-4. d, A volcano plot representation of the microarray of miRNAs shown in Figure 2a, where the y-axis represents the −log10 of the p-value, and the x-axis represents the fold change (log2) between the expression levels of the miRNA from the METTL3 depletion (average of two independent shRNAs) versus the average of two control samples.
Extended Data Figure 2
a, Quantification of representative miRNAs that were affected by METTL3 depletion in MDA-MB-231 cells as measured by qRT-PCR. Expression values were normalized to SNORD44 (RNU44). b, An example of a small RNA that did not display expression level changes upon METTL3 knockdown (SNORD44, small nucleolar RNA) normalized to 18S. All experiments were conducted in biological replicates. Bar graphs represent a linear scale and error bars represent s.e.m.***, p-value <5E-4; **, p-value <1E-3; *, p-value <5E-2.
Extended Data Figure 3
a, qRT-PCR quantification of examples of miRNAs that were modulated upon METTL3 depletion in HeLa cells. Samples were normalized to RNU44. b, Expression levels of genes used for normalization. All experiments were done in biological replicates. c, qRT-PCR and western blot (d) quantifications of METTL3 levels upon transduction with two independent shRNAs targeting METTL3. e, Expression levels of representative miRNAs that were affected by METTL3 depletion in HUVEC cells, as measured by qRT-PCR. Normalization was done by using RNU44 as endogenous control. f, qRT-PCR quantification of METTL3 depletion upon transduction with two independent shRNAs targeting METTL3. g, Quantification of the expression levels of control genes. h and i, Examples of miRNAs affected in mouse embryonic stem cells in which METTL3 has been targeted using CRISPR, whose expression was measured by qRT-PCR. All experiments were done in biological replicates. Bar graphs represent a linear scale and error bars represent s.d. ***, p value <5E-4; **, p value <1E-3
Extended Data Figure 4
a, qRT-PCR quantification of expression of representative miRNAs modulated upon METTL3 over-expression (METTL3 OE) in MDA-MB-231 cells. Samples were normalized to RNU44. b, qRT-PCR quantification of control RNU44 and GAPDH–genes normalized to 18S. All experiments were done in biological replicates. Bar graphs represent a linear scale and error bars represent s.d. ***, p value <5E-4; **, p value <1E-3.
Extended Data Figure 5
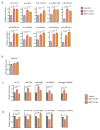
a, qRT-PCR quantification of representative pri-miRNAs that were impacted by METTL3 depletion using two independent hairpins in MDA-MB-231 cells. Expression levels were normalized to GAPDH. b, qRT-PCR quantification of GAPDH, endogenous control. All experiments were done in biological replicates. Quantification of mature (c) and pri-miRNAs (d) upon stable transduction of MDA-MB-231 with either wildtype or a catalytic mutant METTL3. Mature miRNA expression was normalized to RNU44 and pri-miRNAs to GAPDH expression levels. The last bar graph shows the averaged value for all individual miRNAs tested. The experiments were done in biological replicates. Bar graphs represent a linear scale and error bars represent s.d. ****, p value <1E-4, ***, p value <5E-4; **, p value <1E-3; *, p value <5E-2; ns= not significant.
Extended Data Figure 6
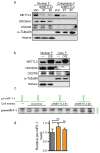
a, Western blot analysis of METTL3, DROSHA and DGCR8 obtained from nuclear and cytoplasmic fractions of cells transduced with two independent shRNAs targeting METTL3 (shMETTL3 #1 and #2) or with an shRNA control (shC). Tubulin and Histone 3 were used as loading controls as well as controls for the efficiency of the fractionation. b, Same as (a), but in this case, lysate from cells overexpressing METTL3 were compared to wildtype control cells. c, In vitro pri-miRNA processing reactions. Whole-cell extracts of control cells or cells depleted of METTL3 with 2 independent shRNAs were used to process in vitro transcribed pri-miR-1-1 to produce pre-miR-1-1 in vitro. Pre-miR-1-1 levels were then analyzed by Northern blot. d, Hybridization intensities of (c) were quantified, normalized by their inputs and shown in a bar graph format. Bar graphs represent a linear scale and error bars represent s.d.
Extended Data Figure 7
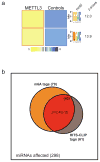
a, FIRE motif discovery analysis of the METTL3 HITS-CLIP binding sites compared to control sequences; two over-represented versions of the METTL3 motif are shown with a z-score as indicated. The heat-map represents a linear scale. b, Venn diagram representation of the overlap of miRNAs affected by METTL3 depletion and bearing the m6A and/or the METTL3 HITS-CLIP tags within 1kb from any particular miRNA locus. The overlap of miRNAs containing both m6A and METTL3 HITS-CLIP tags is depicted in red, p-value=2.4E-15.
Extended Data Figure 8
a, Schematic representation of the reporters used to study the role of the METTL3 on pri-miRNA processing. Represented in red is the pri-let-7e sequence and in green, the control pri-miR-1-1. The top reporter contains a wildtype sequence of the pri-let-7e and the potential sites of methylations are depicted as red dots. The reporter on the bottom contains a mutant version of pri-let-7e in which the 5 putative adenines of the METTL3 motif were mutated. b, HEK293T cells were transfected with the reporters depicted in (a), RNA was extracted, and mature miRNA expression quantified by qRT-PCR. The bar graph represents the relative expression levels of mature let-7e normalized to mature miR-1-1. c, In vitro binding assays using immunopurified DGCR8. Samples containing in vitro transcribed pri-let-7e with N6-methyladenosine or unmodified adenosines were incubated with magnetic bead bound-DGCR8, washed, eluted and analyzed by Northern blot. All reactions contained unmodified pri-miR-1-1 as endogenous control. The upper panel shows pri-let-7e and the lower panel pri-miR-1-1. On the right side the bar graph is depicted the average intensity of pri-let-7e normalized by pri-miR-1-1 levels. The experiment was done in biological triplicate. Bar graphs represent a linear scale and error bars represent s.d. ***, p-value <5E-4, ns= not statistically significant.
Extended Data Figure 9
Immunoprecipitation of endogenous DGCR8 crosslinked to RNA of control cells or cells depleted of METTL3 using two independent shRNAs. After immunoprecipitation, the RNA was extracted and the expression levels of a set of pri-miRNAs were quantified by qRT-PCR. The average quantification is presented in Figure 4h. Bar graphs represent a linear scale and error bars represent s.d. ****, p value <1E-4; ***, p value <1E-3; **, p value <1E-2; *, p value <5E-2.
Figure 1
Figure 1. m6A mark is present in pri-miRNA regions
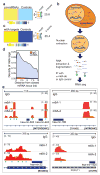
a, Motif discovery analysis in pri-miRNA sequences using FIRE reveals over-representation of the METTL3 motif; yellow represents over-representation and blue under-representation. The magnitude of the over/under-representation is reflected in the linear scale heat-map shown at the bottom. The z-score is specified on the right. b, Schematic representation of the m6A-seq protocol. c, FIRE motif analysis of m6A peaks compared to controls sequences of the same length. The over-represented motif and their z-score are depicted on the right as in (a). d, Density plot of the abundance of m6A marks and their proximity to given miRNAs within transcripts. Peaks obtained from the IgG immunoprecipitation were used as controls. e, IGV tracks displaying examples of sequencing read clusters from two m6A-seq replicates are shown next to the pre-miRNA genomic loci. The green dots at the bottom of the tracks depict the position of METTL3 consensus motifs.
Figure 2
Figure 2. METTL3 modulates the expression levels of miRNAs
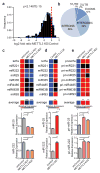
a, Histogram depicting fold change (log2) in miRNA expression. The ratio of the average value for two independent shRNAs over the average of the two controls is shown. The p-value of the analysis is indicated. b, Pie-chart representation of the genomic locations of miRNAs downregulated upon METTL3 depletion. c, Heat-map representation of qRT-PCR quantification of eight representative mature miRNAs that were affected by METTL3 depletion. Red represents increased expression while blue represents reduced expression. A heat map depicts their aggregate expression change upon METTL3 modulation. At the bottom, bar graphs showing specific examples. d, Heat-map representation of mature miRNA quantification from (c) by qRT-PCR upon METTL3 over-expression (OE). e, Heat-map representing the quantification of pri-miRNA forms of miRNAs from (c–d) by qRT-PCR upon METTL3 depletion. All heat-maps and bar graphs represent a linear scale. Error bars represent s.d. ***, p value <5E-4; **, p value <1E-3.
Figure 3
Figure 3. METTL3 targets pri-miRNAs for m6A methylation
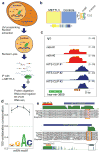
a, Schematic representation of the HITS-CLIP protocol used. b, FIRE analysis of the motif of METTL3 HITS-CLIP binding sites. The color scale of the linear scale heat-map is the same as in Fig. 1a. c, An example of sequencing clusters obtained from METTL3 HITS-CLIP (blue) and m6A-seq (red). m6A seq was done in duplicate using IgG as control. METTL3 HITS-CLIP was done in triplicate. The purple boxes at the bottom of the tracks represent conserved METTL3 motifs. d, Average vertebrate conservation of the METTL3 motif of a group of conserved pri-miRNAs using the PhastCons software. The dotted green line depicts the average conservation of a region of 100nt that surrounds (and includes) the motifs. Error bars represent s.e.m. e, Two examples of pri-miRNA genomic regions containing HITS-CLIP tags are shown. At top, pre-miRNAs are marked in red boxes and METTL3 HITS-CLIP tags in blue boxes. The conserved METTL3 motif is framed in red with the putative methylated adenosine in red.
Figure 4
Figure 4. m6A methylation of pri-miRNAs is required for normal processing by DGCR8
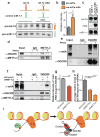
a, In vitro pri-miRNA processing reactions. Pri-let-7e, was transcribed with either modified N6-methyladenosine (depicted in the schematic as red dots) or with unmodified bases. Hybridization intensities were quantified, normalized to the controls and shown in the bar graph (b). c, Input for experiment shown in (a). d, Co-immunoprecipitation of the METTL3-interacting protein DGCR8. Western blot using the indicated antibodies with IgG used as control for the IP. e, Immunoprecipitation of endogenous DGCR8. Western blot using an antibody against m6A methylated RNA. f, Similar as e, but control cells or cells depleted of METTL3 were compared. g, Similar immunoprecipitation as e, however, after immunoprecipitation of DGCR8, a radio-labeled RNA linker was ligated to the RNA bound by DGCR8. Bars represent the average normalized intensity of three biological replicates. ***, p <0.001. h, Similar as g but the pri-miRNA bound by DGCR8 were extracted and quantified by qRT-PCR. The bar graph shows the average level of a panel of miRNAs analyzed and shown in more detail in Extended Data Figure 9. i, Model of METTL3 regulation of miRNA biogenesis. The molecules represented in the schematic are: Histones (yellow), RNA Pol II (orange), METTL3 (green), m6A (red), DGCR8 (blue), DROSHA (pink) and a putative unknown reader of the m6A mark (gray).

Similar articles

Cited by

References

    1. Denli AM, Tops BB, Plasterk RH, Ketting RF, Hannon GJ. Processing of primary microRNAs by the Microprocessor complex. Nature. 2004;432:231–235. doi: 10.1038/nature03049. - DOI - PubMed
    1. Gregory RI, et al. The Microprocessor complex mediates the genesis of microRNAs. Nature. 2004;432:235–240. doi: 10.1038/nature03120. - DOI - PubMed
    1. Han J, et al. The Drosha-DGCR8 complex in primary microRNA processing. Genes & development. 2004;18:3016–3027. doi: 10.1101/gad.1262504. - DOI - PMC - PubMed
    1. Landthaler M, Yalcin A, Tuschl T. The human DiGeorge syndrome critical region gene 8 and Its D. melanogaster homolog are required for miRNA biogenesis. Current biology: CB. 2004;14:2162–2167. doi: 10.1016/j.cub.2004.11.001. - DOI - PubMed
    1. Han J, et al. Molecular basis for the recognition of primary microRNAs by the Drosha-DGCR8 complex. Cell. 2006;125:887–901. doi: 10.1016/j.cell.2006.03.043. - DOI - PubMed

Publication types

Associated data