. 2015 Apr 2;520(7545):57-62.
doi: 10.1038/nature14344. Epub 2015 Mar 18.

Ferroptosis as a p53-mediated activity during tumour suppression

Affiliations

Ferroptosis as a p53-mediated activity during tumour suppression

Le Jiang et al. Nature. .

Abstract

Although p53-mediated cell-cycle arrest, senescence and apoptosis serve as critical barriers to cancer development, emerging evidence suggests that the metabolic activities of p53 are also important. Here we show that p53 inhibits cystine uptake and sensitizes cells to ferroptosis, a non-apoptotic form of cell death, by repressing expression of SLC7A11, a key component of the cystine/glutamate antiporter. Notably, p53(3KR), an acetylation-defective mutant that fails to induce cell-cycle arrest, senescence and apoptosis, fully retains the ability to regulate SLC7A11 expression and induce ferroptosis upon reactive oxygen species (ROS)-induced stress. Analysis of mutant mice shows that these non-canonical p53 activities contribute to embryonic development and the lethality associated with loss of Mdm2. Moreover, SLC7A11 is highly expressed in human tumours, and its overexpression inhibits ROS-induced ferroptosis and abrogates p53(3KR)-mediated tumour growth suppression in xenograft models. Our findings uncover a new mode of tumour suppression based on p53 regulation of cystine metabolism, ROS responses and ferroptosis.


Figures

Extended Data Figure 1
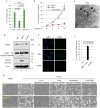
Extended Data Figure 1. SLC7A11expression is downregulated by p53 and identification of p53 binding sites for mouse Slc7a11gene
a, Messenger RNA levels of SLC7A11 in tet-on wild-type p53 stable line and parental H1299 cells treated with doxycycline (0.1 μg ml−1). b, U2OS cells were treated with doxorubicin (0.2 μg ml−1) and mRNA was quantified. c, Osteosarcoma cell lines, U2OS (p53 wild type) and SAOS-2 (p53 null) cells, were treated with doxorubicin (0.2 μg ml−1) and mRNA levels were determined. d, Lung cancer cell lines, H1299 (p53 null) and H460 (p53 wild type) cells, were treated with doxorubicin (0.2 μg ml−1) and RT–PCR was used to determine mRNA expression. e, The breast cancer cell line MCF7 was treated with doxorubicin (0.2 μg ml−1) for indicated duration and RT–qPCR was used to measure mRNA expression. f, RT–qPCR were used to determine the mRNA level of Slc7a11 in MEFs with indicated genotype. g, Schematic diagram representing potential p53 binding locations and sequences on the mouse Slc7a11 gene. TSS, transcription start site; light blue box, 5′-UTR. h, ChIP–qPCR was performed on MEFs that were treated with nutlin (10 μM) for 6 h. All qPCR was performed in two technical replicates and mean ± s.d. are shown. All experiments were repeated independently three times.
Extended Data Figure 2
Extended Data Figure 2. Characterization of erastin-induced cell death in MEFs
a, Quantification of cell death as shown in Fig. 3a. Error bars are s.d. from two technical replicates. b, Kinetics of cell death induced by erastin (1 μM) over a 24-h period in MEFs with indicated genotypes. Technical replicates were performed and mean ± s.d. are shown (n = 2). c, Transmission electron microscopy image of wild-type MEFs that were treated with TNFα (20 ng ml−1) and CHX (5 μg ml−1) for 16 h with arrows pointing to fragmented nuclei. d, Wild-type MEFs were treated with mouse TNFα (20 ng ml−1) and CHX (5 μg ml−1) or erastin (1 μM) for 8 h followed by western blots.e, TUNEL assay was carried out using wild-type MEFs treated as in d. f, Quantification of TUNEL signals for e. Mean ± s.d. from ten random microscope views are shown (magnification, ×20). g, MEFs with indicated p53 status were treated with erastin (4 μM) and specific cell death inhibitors for 8 h before images were taken (magnification, ×10). 3-MA, 3-methylademine. All experiments were repeated at least three times and representative data are shown.
Extended Data Figure 3
Extended Data Figure 3. Effectiveness of cell death inhibitors
a, Wild-type MEF cells were starved in DMEM medium deprived of glucose, sodium pyruvate or l-glutamine for 2 h with or without 3-methylademine (2 mM) followed by western blots. b, Wild-type MEFs were treated for 48 h with TNFα (20 ng ml−1), SMAC mimetic (100 nM) and Z-VAD-FMK (10 μg ml−1) to induced necroptosis with or without the presence of necrostatin-1 (10 μg ml−1) (magnification, ×10). c, Quantification of cell death as shown in b. PI, propidium iodide. Mean ± s.d. from two technical replicates are shown. d, Wild-type MEFs were treated for 48 h with TNFα (20 ng ml−1), SMAC mimetic (100 nM) and necrostatin-1 (10 μg ml−1) to induce apoptosis with or without the presence of Z-VAD-FMK (10 μg ml−1) (magnification, ×10). e, Quantification of cell death as shown in d. Mean ± s.d. from two technical replicates are shown. f, p533KR/3KR MEFs were treated with erastin (4 μM) and various chemicals that block ferroptosis for 24 h before the percentage of cell death was determined; error bars, s.d. from two technical replicates. DMSO, dimethyl sulfoxide; DFO, deferoxamine; U0126, 1,4-diamino-2,3-dicyano-1,4-bis[2-aminophenylthio] butadiene; β-ME, β-mercaptoethanol; NAC, N-acetyl-l-cysteine. All experiments were independently repeated three times.
Extended Data Figure 4
Extended Data Figure 4. SLC7A11 is overexpressed in tumours of human cancer patients
a–c, Quantitative RT–PCR was used to determine the expression levels of SLC7A11 in paired normal and cancer tissues from colon (a), kidney (b) and liver (c); average expression levels from normal tissues were normalized to 1 in each type of cancer. Mean ± s.d. from two technical replicates are shown. d, Representative heamotoxylin and eosin (H&E) and immunofluorescence staining of SLC7A11 on frozen sections of paired patient cancer and adjacent normal tissues. Magnifcation, ×20. N, normal tissue; C, cancer tissue. Blue, DAPI; green, anti-ATP1A1; red, anti-SLC7A11. e, DNA sequencing was performed on colon cancer samples and specific mutations were identified. Independent experiments were repeated three times and representative data are shown.
Extended Data Figure 5
Extended Data Figure 5. Cell death induced by p533KR and erastin is ferroptosis and effect of SLC7A11 overexpression on colony formation
a, Representative phase-contrast images of cell cultures as treated in Fig. 4b (magnification, ×10). b, p533KR tet-on stable line cells were treated as indicated and the percentage of cell death was quantified (DFO, deferoxamine; U0126, 1,4-diamino-2,3-dicyano-1,4-bis[2-aminophenylthio] butadiene; β-ME, beta-mercaptoethanol; NAC, N-acetyl-l-cysteine). Mean ± s.d. from two technical replicates are shown. c, H1299 cells were transfected with indicated plasmids followed by western blot 24 h later. HA, haemagglutinin d, Representative images of colony formation assay in 10-cm plates as transfected in c. e, Quantification of colony formation assay as shown in d. Numbers of colonies formed in control plates were normalized to 100 and mean ± s.d. from two technical replicates are shown. All experiments were repeated three times with representative data shown.
Extended Data Figure 6
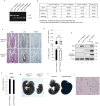
Extended Data Figure 6. p533KR/3KRMdm2−/− mice are embryonic lethal
a, Representative gel images for genotyping of Mdm2 status in p533KR/3KR background mice. b, Summary of numbers of live embryos and pups recovered from p533KR/3KRMdm2+/− intercross breeding. c, Haematoxylin and eosin (H&E) and immunohistochemistry staining of p53 and TUNEL assay on E7.5 embryos of indicated genotype (magnification, ×20). d, Percentage of cells with positive TUNEL or BrdU were determined by counting 100 cells in each section from three different embryos. Error bars, s.d.; N.S., not significant. e, Whole-embryo extracts from E9.5 embryos were used for western blot. As positive controls, thymus protein lysate from irradiated (IR) wild-type mouse (8 Gy) was used. f, Messenger RNA expression levels of Puma were determined by RT–qPCR using E9.5 embryos with indicated genotype (n=3 for p533KR/3KRMdm2+/+ and n=5 for p533KR/3KRMdm2−/−; error bars, s.d.; N.S, not significant). g, Representative images of whole-mount senescence-associated β-galactosidase staining using E9.5 mouse embryos with indicated genotype (magnification, ×2). h, Same protocol as in g was used to stain control wild-type embryos and embryos of HAUSP heterozygous knockouts, which express β-galactosidase (magnification, ×2). i, Late passage senescent wild-type MEFs were stained for senescence-associated β-galactosidase activity using the same protocol as in g (magnification, ×10).
Extended Data Figure 7
Extended Data Figure 7. Ferrostatin-1 partially rescues p533KR/3KRMdm2−/− mice
a, Representative morphologies of E11.5 mouse embryos of indicated genotype (magnification, ×3). b, Representative embryos recovered from p533KR/3KRMdm2+/− intercross with or without ferr-1 injection. The dashed line marked by an asterisk highlights the body of a dead p533KR/3KRMdm2−/− embryo, which disintegrated upon further dissection (magnification, ×1.5). c, Head-to-tail lengths of p533KR/3KRMdm2−/− embryos were measured and compared to p533KR/3KRMdm2+/+ controls (n = 4 for each group of p533KR/3KRMdm2−/− embryos with or without ferr-1 treatment; error bars, s.d.). d, Representative haematoxylin and eosin (H&E) staining of eye structures of p533KR/3KRMdm2+/+ and p533KR/3KRMdm2−/− mouse embryos (magnification, ×20 and ×40 as indicated).
Extended Data Figure 8
Extended Data Figure 8. Synergized ferroptosis by nutlin/ROS
a, Percentage of cell death has shown in Fig. 6a was quantified. Mean ± s.d. from two technical replicates are shown. b, U2OS cells with stable knockdown of p53 were treated by nultin (10 μM) for 24 h followed by addition of ROS (tert-butyl hydroperoxide, 350 μM) for 4 h. Western blots were performed. c, Quantification of cell death as shown in Fig. 6c. Mean ± s.d. from two technical replicates are shown. d, U2OS cells were treated with nutlin (10 μM) for 24 h first, followed by ROS (tert-butyl hydroperoxide, 350 μM) along with indicated cell death inhibitors; cell death were quantified 24 h later. Error bars, s.d. from two technical replicates. e, U2OS cells were treated with DNA-damaging agents (etoposide, 20 μM; doxorubicin, 0.2 μg ml−1) for 48 h with or without the presence of ferr-1 (2 μM) (magnification, ×10); cell death was quantified in f with mean ± s.d. shown (n = 2 technical replicates). All data were repeated three times independently.
Extended Data Figure 9
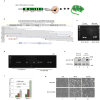
Extended Data Figure 9. Generation of BAC transgenic mice for Slc7a11 overexpression
a, Schematic diagram showing the procedure for generation of Slc7a11-BAC transgenic mice. b, Snap shot of BACs surrounding mouse Slc7a11 genes. BAC (RP24-242E11) that contains only the Slc7a11 gene was selected for injection. c, PCR at both ends of the BAC construct identified founders (no. 21 and no. 22) as positive BAC transgenic mice. d, Germline transmission was confirmed from both founders identified in c. NC, no template control. e, Thymus and brain tissues from 3-week-old litter mates of control and Slc7a11-BAC transgenic mice were lysed and examined by western blots. f, MEF cells with indicated genotypes were treated as in Fig. 6e for 2 h and mRNA levels were determined by RT–qPCR. Mean ± s.d. from two technical replicates are shown. g, Representative images of cells treated as in Fig. 6e (magnification, ×10).
Figure 1
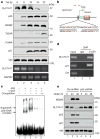
Figure 1. Identification of SLC7A11as a target of p53
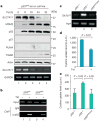
a, Western blot and RT–PCR for tet-on p53 stable line cells treated with doxycycline. VIN, vinculin. b, Schematic diagram of p53 binding location and sequence on human SLC7A11 gene. Identified p53 binding sequence was compared with consensus sequence (R, A/G; W, A/T; Y, C/T; nucleotides C and G in red are essential for p53 binding). TSS, transcription start site. Facing arrows indicate primers for generating probes in c and PCR in d. c, EMSA was performed with indicated components. The double plus sign represents that more competition cold probes were added compared to the single plus sign (200-fold versus 100-fold to radioactive-labelled hot probes). d, ChIP assay was carried out in U2OS cells. e, U2OS cells with p53 knockdown were treated with nutlin and analysed by western blot. All data are representative of three independent experiments.
Figure 2
Figure 2. p533KR in regulating SLC7A11and cystine uptake activity
a, Tet-on p533KR stable line cells were treated with doxycycline followed by western blots and RT–PCR. b, ChIP assay was performed in wild-type p53 (p53WT) and p533KR tet-on stable line cells. c, Messenger RNA level of Slc7a11 in MEFs with indicated genotype was determined by RT–PCR with Hprt as endogenous control. d, Cystine uptake activity (c.p.m., count per minute) was determined in p533KR stable line cells. Mean ± s.d. from two technical replicates are shown. e, Cystine uptake levels (c.p.m.) were measured in MEFs derived from three individual embryos for each genotype (error bars, s.e.m.). All data were repeated independently three times with representatives shown.
Figure 3
Figure 3. Roles of p53 in ferroptosis
a, Representative phase-contrast images of MEFs treated with 4 μM erastin for 8h (magnification, ×10). b, Kinetics of cell death induced by 4 μM erastin over a 24-h period. Mean ± s.d. from two replicate experiments are shown. PI, propidium iodide. c, Wild-type MEFs were treated with dimethyl sulfoxide (DMSO) or erastin and subjected to transmission electron microscopy. Arrows, nuclei; arrow heads, mitochondria. d, MEFs were treated with erastin and specific cell death inhibitors for 8 h and the percentage of cell death was determined (error bars, s.d. from two technical replicates). 3-MA, 3-methylademine. All data are representative of three independent experiments.
Figure 4
Figure 4. Regulation of p53-mediated ferroptosis by SLC7A11
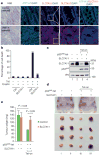
a, Representative immunofluorescence staining of SLC7A11 on paired colon cancer and adjacent normal tissues. H&E, haematoxylin and eosin (magnification, ×20). Numbers in the top left are specific tissue identification numbers of a normal/cancer tissue pair from one colon cancer patient. b, Tet-on p533KR cells were transfected with either control or plasmid overexpressing SLC7A11 followed by treatment as indicated. Quantification of cell death from two technical replicates is shown (mean ± s.d.). c, Western bot analysis of tet-on p533KR cells with or without SLC7A11 overexpression. VIN, vinculin. d, Xenograft tumours from tet-on p533KR cells shown in c. e, Tumour weight was determined (error bars, s.d. from from four tumours). Independent experiments were repeated three times and representative data are shown.
Figure 5
Figure 5. p53-mediated metabolic regulation in embryonic development
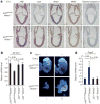
a, Representative haematoxylin and eosin (H&E) and immunohistochemistry staining on E7.5 embryos with indicated genotype (magnification, ×20). b, Messenger RNA expression levels of Slc7a11 in E9.5 embryos with indicated genotype (error bars, s.d.; n = 3 for p533KR/3KRMdm2+/+ and n = 5 for all other genotypes). c, Representative morphologies of E14.5 embryos treated with either dimethyl sulfoxide or ferr-1 (magnification, ×1.5). d, Messenger RNA expression levels of Ptgs2 determined similarly as in b. All data were repeated independently at least three times and representatives are shown.
Figure 6
Figure 6. p53-mediated ferroptosisin ROS responses
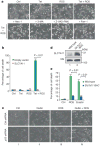
a, Tet-on p533KR cells were treated with doxycycline and ROS with specific cell death inhibitors for24 h. Nec-1, necrostatin-1 (magnification, ×10). b, Tet-on p533KRcells were transfected with either control or plasmid overexpressing SLC7A11 followed by treatment of doxycycline and ROS for 16 h. Quantification of cell death from two technical replicates is shown (mean ± s.d.). c, U2OS cells with p53 knockdown were treated with nutlin and ROS for 24 h when images were taken. d, Western blots of MEFs generated from wild-type or Slc7a11-BAC transgenic mice. VIN, vinculin. e, MEFs from indicated genotype were treated with ROS or erastin for 8 h and quantification of cell death from two technical replicates (mean ± s.d.) is shown. All experiments were performed independently three times and representative data are shown.

Comment in

  • Cancer: A piece of the p53 puzzle.
    Bieging KT, Attardi LD. Bieging KT, et al. Nature. 2015 Apr 2;520(7545):37-8. doi: 10.1038/nature14374. Epub 2015 Mar 18. Nature. 2015. PMID: 25799989 No abstract available.

Similar articles

Cited by

References

    1. Berkers CR, Maddocks OD, Cheung EC, Mor I, Vousden KH. Metabolic regulation by p53 family members. Cell Metab. 2013;18:617–633. - PMC - PubMed
    1. Jackson JG, Lozano G. The mutant p53 mouse as a pre-clinical model. Oncogene. 2013;32:4325–4330. - PubMed
    1. Aylon Y, Oren M. New plays in the p53 theater. Curr Opin Genet Dev. 2011;21:86–92. - PMC - PubMed
    1. Junttila MR, Evan G. I p53–a Jack of all trades but master of none Nature Rev Cancer. 2009;9:821–829. - PubMed
    1. Wang SJ, Gu W. To be, or not to be: functional dilemma of p53 metabolic regulation. Curr Opin Oncol. 2014;26:78–85. - PMC - PubMed

Publication types

MeSH terms

Associated data