. 2015 Mar 26;519(7544):491-4.
doi: 10.1038/nature14280. Epub 2015 Mar 18.

hiCLIP reveals the in vivo atlas of mRNA secondary structures recognized by Staufen 1

Affiliations

hiCLIP reveals the in vivo atlas of mRNA secondary structures recognized by Staufen 1

Yoichiro Sugimoto et al. Nature. .

Abstract

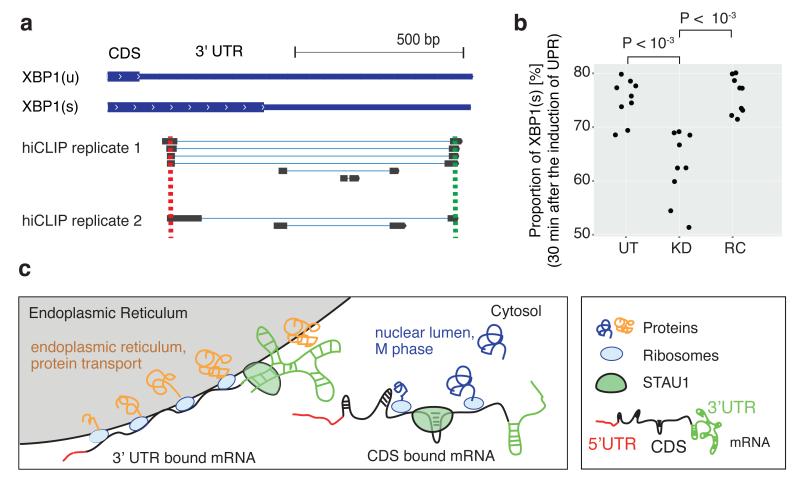
The structure of messenger RNA is important for post-transcriptional regulation, mainly because it affects binding of trans-acting factors. However, little is known about the in vivo structure of full-length mRNAs. Here we present hiCLIP, a biochemical technique for transcriptome-wide identification of RNA secondary structures interacting with RNA-binding proteins (RBPs). Using this technique to investigate RNA structures bound by Staufen 1 (STAU1) in human cells, we uncover a dominance of intra-molecular RNA duplexes, a depletion of duplexes from coding regions of highly translated mRNAs, an unexpected prevalence of long-range duplexes in 3' untranslated regions (UTRs), and a decreased incidence of single nucleotide polymorphisms in duplex-forming regions. We also discover a duplex spanning 858 nucleotides in the 3' UTR of the X-box binding protein 1 (XBP1) mRNA that regulates its cytoplasmic splicing and stability. Our study reveals the fundamental role of mRNA secondary structures in gene expression and introduces hiCLIP as a widely applicable method for discovering new, especially long-range, RNA duplexes.


Figures

Extended Data Figure 1
Extended Data Figure 1. Diagrams explaining the mapping of hybrid reads, duplex assignment and use of terms
a, Schematic overview of the hiCLIP protocol. (1) Cells are irradiated with UV-C light. (2) After lysis, the unprotected sections of RNAs are digested by RNase I, and the RBP is co-immunoprecipitated with the cross-linked RNA duplex. (3) Two designated adaptors are ligated to both strands of the RNA duplex. Adaptor A (cloning adaptor) has a permanent 3′ block whilst adaptor B (linker adaptor) has a removable 3′ block. (4) 3′ block of adaptor B is removed. (5) The two strands of the RNA duplex are ligated via adaptor B. (6) The RNA hybrid product is then converted into a cDNA library and sequenced as in iCLIP protocol. The resulting data comprise hybrid and non-hybrid reads. (7) Hybrid reads are selected and adaptors trimmed to define the sequences of left (L) and right (R) arms, which are mapped independently to the transcriptome. b and c, The left arm of hybrid read locates upstream of adaptor B, and the right arm locates downstream of adaptor B. Each arm is mapped independently to transcriptome. If both arms locate into the same gene, then the duplex is considered to be formed by the same RNA. If the arms locate to different genes, then the duplex is formed by two different RNAs. d, A diagram describing how a hybrid read is used to identify an RNA duplex. e, A diagram describing how the loop (intervening sequence) is defined for each RNA duplex.
Extended Data Figure 2
Extended Data Figure 2. Autoradiography analysis of the STAU1-RNA complex, and analysis of hybrid reads in a known STAU1 mRNA target, ARF1
a, Autoradiograph of STAU1-RNA complex that was isolated for the hiCLIP experiment. hiCLIP experiments were performed with high and low RNase conditions, and the two controls omitted either the 2nd intermolecular ligation or STAU1 induction. After adaptor ligation, STAU1 cross-linked RNA was radio labeled and the complex was analyzed by denaturing gel electrophoresis and membrane transfer. The size of the band is slightly higher compared to that in Fig. 1a, presumably due to the efficient adaptor ligation that adds to the size of the RNAs (the experiment shown in Fig. 1a didn’t include adaptor ligation). b, Correlation analysis of the non-hybrid read count on each RNA between the replicates of the hiCLIP experiments. c, Schematic representations of ARF1 mRNA and the known STAU1-target RNA duplex, along with the position of STAU1 hybrid reads and cross-link sites identified by non-hybrid reads. The left and right arms of hybrid reads are depicted as black boxes, and lines connect reads originating from the same cDNA. The previously studied STAU1-target RNA duplex, is indicated by green and red boxes. In addition to the known duplex, hybrid reads also identified additional duplexes in the ARF1 3′ UTR. Interestingly, two newly identified duplexes are part of overlapping secondary structures, both of which represent the minimum free energy of folding the local sequence, as predicted by RNAfold (shown on the right). This suggests that some regions of the ARF1 3′ UTR may adopt alternative conformations. The overlapping region of the two structures is shaded in blue. d, The constructs of reporters (ARF1 WT and Δ) used for the validation by formaldehyde crosslinking and co-immunoprecipitation experiment are shown. The reporter has firefly luciferase (FLuc) CDS and ARF1 3′ UTR. e, The ratio of ARF1 WT and Δ in total cell lysate fraction or STAU1 co-immunopreciptated fraction were analyzed by RT-PCR using forward primer annealed to CDS of FLuc and reverse primer annealed to downstream of the deletion site. The ratios (log2) of two populations are compared by Welch’s t test (n = 3). The corresponding Qiaxcel electropherograms are available at: figshare.com/s/5f83e88e929b11e4b77106ec4b8d1f61.
Extended Data Figure 3
Extended Data Figure 3. Hybrid reads identify RNA duplexes
a, Analysis of hybrid reads in 3′ UTRs demonstrates significantly smaller ensemble folding energy compared to random RNA fragments as calculated by RNAhybrid. The kernel density estimate of ensemble folding energy distribution is plotted, and the ensemble folding energy for hybrid reads and random RNAs is compared by Mann-Whitney U test (n = 4492 for both hybrid reads and random RNAs). b, Similar to a, but the analysis is restricted to hybrid reads in CDS (n = 958). c, Similar to a, but the analysis is restricted to inter-molecular hybrid reads (i.e., hybrid reads whose left arm and right arm originated from different genes; n = 257). d, Similar to a, but the analysis is restricted to hybrid reads in rRNAs (n = 3502). e, Median normalised PARS scores were calculated around center of all mRNA duplexes. PARS scores were obtained from Wan et al, and positions with 0 values were removed. PARS score represents a ratio between reads starts after cutting with dsRNase (positive) / ssRNase (negative). Assuming that the double-stranded RNase fully digests each duplex, it is expected that the positive values in PARS-seq will be highest at the last nucleotide of each duplex. This might explain why maximum PARS values occur at the positions closer to the 3′ end of duplexes. f, Metaprofiles of the distribution of STAU1 cross-link sites, identified by the start sites of non-hybrid hiCLIP reads (blue), or the randomly repositioned sites (black, mean value of 10 randomizations; gray, standard deviation of the 10 randomizations) around the positions of hiCLIP duplexes. g, Distribution of mRNA median probabilities to be single-stranded from −50 to 100 nucleotides around the cross-link sites.
Extended Data Figure 4
Extended Data Figure 4. Analysis of duplexes identified by hiCLIP in the secondary structure of human ribosomal RNAs
a, The position of duplexes identified by hybrid reads in the 28S rRNA secondary structure. 2962 hybrid mapped to 28S rRNA. We first removed the duplexes with only one read, obtaining a final list of 2816 hybrid reads uniquely mapped to 28S rRNA, and 2020 of these reads (72%) identified duplexes that were previously determined with CryoEM structure. These duplexes are marked by blue rectangles, and the number of reads that identify each duplex is marked. 756 hybrid reads (27%) map to different double stranded regions of the 28S rRNA while the remaining 40 hybrid reads (1%) map to single strand regions of the rRNA 28S known structure. The metazoan-specific rRNA expansion segments are indicated by gray shadowing. b, Similar to a, but the position of duplexes identified by hybrid reads in the 18S rRNA secondary structure. 218 hybrid reads uniquely mapped to 18S rRNA, and 170 of these reads identified duplexes that were previously determined with CryoEM structure. Red lines mark the putative newly identified duplexes that are not part of the CryoEM structure, but are complementary and are identified by hybrid reads. The numbers next to the lines shows the number of unique hybrid reads that identify each of these putative duplexes, and the three newly identified duplexes (helices) that are aligned in Fig. 1e are marked as hA, hB and hC. Complementarity of the novel duplex is conserved from yeast to human as seen at: figshare.com/s/47473d24929c11e493f106ec4bbcf141. The rRNA secondary structure is reprinted by permission from Macmillan Publishers Ltd: Nature copyright (2013).
Extended Data Figure 5
Extended Data Figure 5. Analysis of RNA types, stem lengths, and sequence motifs at STAU1-target RNA duplexes
a, Relative proportions of RNA types that were identified by hybrid reads, where each arm maps to the same (left) or different RNAs (right). b, Distribution of duplex stem lengths for 3′ UTR duplexes. c, Sequence motifs enriched at STAU1-target 3′ UTR duplexes when compared to surrounding regions of same 3′ UTRs (controls). d, Purine content is plotted within each arm of randomly selected 2291 3′ UTR duplexes that were detected using RNAfold in mRNAs that don’t contain any STAU1-target hiCLIP duplex in their 3′ UTR, and surrounding sequence up to 40nt on each side. e, Purine content is plotted within each arm of 494 CDS-CDS STAU1-target duplexes and surrounding sequence up to 40nt on each side. f, Boxplots showing the frequencies of consecutive purine tracks in the 3′ UTR STAU1-target duplexes (boxplot on the left) and in the randomly selected 3′ UTR duplexes that were detected using RNAfold in mRNAs that don’t contain any STAU1-target hiCLIP duplex in their 3′ UTR (boxplot on the right).
Extended Data Figure 6
Extended Data Figure 6. Analysis of repeat elements and SNPs at STAU1-target RNA duplexes
a, Enrichment analysis of repeat elements. The enrichment was calculated by comparing the proportion of repeat elements in the cytoplasmic STAU1 iCLIP (i.e., hiCLIP non-hybrid reads), STAU1 iCLIP from the total cellular fraction, and hnRNP C iCLIP reads with mRNA-Seq reads using Repeat Enrichment Estimator software. The enrichment was estimated for all repeat element families (e.g. AluJb, AluJo, LTR1, and LTR10A) defined by the Repeat Enrichment Estimator. The top panels show the enrichment of different types of repeat element; all families of Alu repeat elements are plotted in red, and all remaining repeat elements are plotted in gray. The bottom box plots show the enrichment distribution for all repeat elements excluding Alus, or just for Alus. b, Box plots showing the SNPs frequency in all the 3′ UTRs of the targets (box plot on the left) and inside the duplexes in the 3′ UTRs. A binomial test has been performed to test the statistical significance of the depletion of SNPs inside the duplexes, compared to the total 3′ UTRs (P < 10−04). c, Normalized count profile of SNPs occurrence in the long-range 3′ UTR-3′ UTR hiCLIP duplexes; those that have a loop longer than 500nts. d, Normalized count profile of SNPs occurrence in random control 3′ UTR-3′ UTR duplexes with a loop of at least 80 nucleotides that are identified by RNAfold but not by STAU1 hiCLIP.
Extended Data Figure 7
Extended Data Figure 7. Analysis of mRNA abundance and translational efficiency with mRNA-Seq and ribosome profiling
a, Venn diagram shows that few mRNAs contain hiCLIP duplexes both in their 3′ UTR and CDS. b, Metagene analysis of ribosome profiling reads. The position + 12 from the 5′ end of the sequence reads was used as the definition of the read positions. The number of reads mapped around start codon or stop codon is shown. The color of dots corresponds to the positions in each codon. The sharp peak at start codon shows our definition of read position well approximated the position of ribosome A site, and trinucleotide periodicity of peak confirms that the reads captured the codon dependent positioning of ribosome. c, Translational efficiency was independent of the mRNA level [RPKN: read per kilo base per normalized library]. All mRNAs that passed our filter are plotted (see Methods, for detail). d, Western blotting analysis for untreated (UT), STAU1 knockdown (KD) and knockdown with rescue (RC) condition for the cell sample used for ribosome profiling and mRNA-Seq library generation. Duplicate experiments were performed for each condition. e, In order to examine the potential off-target effects of siRNA treatment, we analyzed sequence motifs enriched in mRNAs down-regulated in KD condition compared to UT using SylArray. The plot shows the incremental hypergeometric p-value of the 3 most significantly enriched 7mer motifs in the gene list sorted by the down-regulation level (the leftmost gene is the most down-regulated). The most significantly enriched motif corresponded to the seed sequence of siRNA, indicating that most changes in mRNA abundance between UT and KD corresponded to off-target effects. Therefore, we focused our analyses on the comparison between RC and KD, which had no significant enrichment of such motifs by the SylArray analysis. f, The cumulative fraction of mRNAs relative to their fold change of mRNA abundance or translation efficiency between STAU1 rescue (RC) and knockdown (KD) cells is plotted. The p-value was calculated by Mann–Whitney U test (n = 2269, 752, and 12122 for the RNAs containing the duplexes in their 3′ UTR or CDS or other mRNAs for the analysis of mRNA abundance and n = 1986, 694, and 8199 for the mRNAs containing the duplexes in their 3′ UTR or CDS or other mRNAs for the analysis of translational efficiency).
Extended Data Figure 8
Extended Data Figure 8. STAU1 regulates the cytoplasmic splicing of XBP1 mRNA
a, Schematic represents the unspliced (XBP1(u)) and spliced (XBP1(s)) mRNA, together with hybrid reads that identified a long-range STAU1-target RNA structure. The constructs of reporters (XBP1 wt and Δ) used for the validation by formaldehyde cross-linking, co-immunoprecipitation or reporter assay experiment are shown at the bottom. b, STAU1 interacts with XBP1 via the long-range RNA structure. The ratio of XBP1 wt and Δ in total cell lysate fraction or STAU1 co-immunoprecipitated fraction were analyzed by RT-PCR. The ratios (log2) of two populations are compared by two-tailed Welch’s t test (n = 3). The corresponding Qiaxcel electropherograms are available at: figshare.com/s/f0e32272929b11e4a56606ec4b8d1f61. c, Overview of XBP1(u) and XBP1(s) mRNAs. The position of cytoplasmic splicing site is indicated by an arrow. The longer RNA duplex overlaps with the region translated in XBP1(s). d, Thapsigargin induces UPR and cytoplasmic splicing of XBP1. We confirmed that after 30 min of the UPR induction, XBP1 was actively spliced. e, Real-time PCR analysis of reporter mRNA levels containing wt, mut or com XBP1 3′ UTR (as marked in a). Analysis is done in untreated cells (UT), in cells treated with siRNA against STAU1 (KD), or in cells where siRNA-resistant STAU1 is induced with doxycycline to rescue expression of STAU1 in spite of knockdown (RC). Differences in expression are compared by two-tailed Student’s t-Test. The two independent experiments are marked by black and blue colour, and each dot represents replicates performed on separate wells of cells as part of the same experiment. Disruption of duplex destabilises the mRNA, and compensatory mutation restores the stability slightly above the wt level. This may be because the duplex in the ‘com’ reporter is longer by 2 nt compared to ‘wt’. The mechanism whereby the long-range duplex impacts mRNA stability remains to be determined.
Extended Data Figure 9
Extended Data Figure 9. Gene Ontology analysis and schematic of STAU1 function in 293 cells
Gene ontology analysis of the genes bound by STAU1 in the 3′ UTR (red) and in the CDS (purple), using the DAVID Gene Ontology Tool and visualized using ReviGO. Node colour indicates the p-value (threshold: p-value < 10−6 - FDR < 0.01), and node size indicates the frequency of the GO term in the GOA database. Each gene is mapped only to the most specific terms that are applicable to it (in each ontology). Highly similar GO terms are linked by edges in the graph, with the edge width depicting the degree of similarity. a, Diagram summarizing the enriched Biological Processes GO terms. 3′ UTR-bound mRNAs tend to encode proteins that function in intracellular transport (in red), whereas CDS-bound mRNAs tend to encode proteins that function in the cell cycle M phase (in blue). b, Diagram summarizing the enriched Cellular Components GO terms in the context of their location in the cell. 3′ UTR-bound mRNAs tend to encode membrane proteins that are translated at the ER (in red), whereas CDS-bound mRNAs tend to encode nuclear proteins (in blue). c, Schematic diagram of the functional analyses of CDS and 3′ UTR bound mRNAs. 3′ UTR-bound mRNAs tend to be highly translated and encode membrane proteins that are translated at the ER (in gray). CDS-bound mRNAs tend to be lowly translated and encode nuclear proteins that function in the cell cycle M phase. Loops formed by RNA duplexes in the 3′ UTR tend to be longer than in the CDS, and 3′ UTRs have higher density of bound duplexes.
Extended Data Figure 10
Extended Data Figure 10. Analysis of confident duplexes that were identified by >1 hybrid read
a, Sequence motifs enriched at confident STAU1-target RNA duplexes. b, Visualisation of purine content at confident duplexes (as in Fig. 2a). c, Normalized count profile of SNPs occurrence in confident 3′ UTR-3′ UTR duplexes with a loop of at least 80 nucleotides. d, Comparison of range (the length of loop + duplex) distribution among all duplexes and confident duplexes (those with more than 1 unique hybrid read) located in 3′ UTRs. e, Gene Ontology analysis of mRNAs containing confident STAU1 duplexes in 3′ UTRs (as in Extended Data Figure 9).
Figure 1
Figure 1. hiCLIP identifies RNA duplexes bound by STAU1
a, Autoradiography analysis of the STAU1-RNA complex at different RNase I concentrations or in the absence of cross-linking or STAU1 induction. b, The proportion of uniquely annotated hybrid reads in the hiCLIP libraries at high and low RNase conditions and from the control in which the second ligation (step 5 in Extended Data Fig. 1a) was omitted. c, Mapping summary of the arms of hybrid reads. d, Probability density distributions of minimum free energies of hybridization between the two arms of hybrid reads from mRNAs and long non-coding RNAs, or randomly repositioned sequences. Distributions were compared using the Mann-Whitney U test (n = 6120 for both). e, Alignment of three newly identified duplexes (hA, hB and hC) that connect distal regions of the human 18S rRNA. The nucleotide position and the nearest annotated helix from the CryoEM structure of the rRNA (Extended Data Fig. 4b) are marked in a different colour for each region. f, (Top) Proportion of hybrid reads that map to same or different RNA species. (Bottom) For hybrid reads mapping to same mRNA species, proportion in CDS, 3′ UTR, or other (i.e., 5′ UTR or spanning across two regions).
Figure 2
Figure 2. Properties of STAU1-target RNA duplexes
a, Heatmap of purine content around the two arms of 2,291 duplexes in 3′ UTRs (only duplexes with distance >80 nucleotides between the two arms are shown in order to allow analysis of loop sequence). Duplexes are oriented so that the arm with the higher purine content is on the left hand side of the plot. Line graphs on both sides show the nucleotide content of each arm. b, Metaprofile of the normalized occurrences of SNPs in the regions around the two arms of the 2,291 duplexes.
Figure 3
Figure 3. Insights into the secondary structures of mRNAs
a, Circos plot illustrating the position of two arms of all duplexes within a standardized mRNA. The mRNA is shown at the circumference of the plot, divided into the 5′ UTR, CDS and 3′ UTR. The left and right arms are positioned relative to the start and end of each segment. The lines connecting the two arms are coloured according to the loop length. b, Probability density distributions of loop lengths among hiCLIP duplexes in the CDS and 3′ UTRs. Counts of RNA duplexes were weighted by the count of hybrid reads. Distributions were compared using the Mann-Whitney U test (n = 953 reads from 894 unique duplexes for CDS and n = 4447 reads from 3530 unique duplexes for 3′ UTR). c, Probability density distribution of loop lengths among hiCLIP duplexes in 3′ UTRs that were or were not predicted by RNAfold. Distributions were compared using the Mann-Whitney U test (n = 1348 and 2182, respectively). d, Probability density distributions of translational efficiencies among mRNAs with hybrid reads in the CDS or 3′ UTR, compared with all mRNAs. mRNA counts were weighted by the count of hybrid reads. Translational efficiencies were compared using the Mann-Whitney U test (n = 8199 from 8199 mRNAs for all, 885 from 696 mRNAs for CDS, and 4064 from 1986 mRNAs for 3′ UTR).
Figure 4
Figure 4. STAU1 regulates cytoplasmic splicing of XBP1 mRNA
a, Schematic representation of the unspliced XBP1(u) and spliced XBP1(s) mRNA, shown together with hybrid reads that identify RNA duplexes. b, Proportion of XBP1(s) mRNA 30 min after ER stress induction in untreated (UT), STAU1 knockdown (KD), and rescued (RC) cells. The proportions of XBP1(s) in different conditions were compared using the two-tailed Welch’s t test (n = 9 from 3 independent experiments). c, Schematic diagram summarizing the functional analyses of STAU1-target mRNAs. 3′ UTR bound mRNAs tend to be highly translated and encode membrane proteins that are translated at the ER (in gray). CDS bound mRNAs tend to be lowly translated and encode proteins that function in the cell cycle M phase. Loops formed by RNA duplexes in the 3′ UTR tend to be longer than in the CDS.

Comment in

Similar articles

Cited by

References

    1. Wan Y, Kertesz M, Spitale RC, Segal E, Chang HY. Understanding the transcriptome through RNA structure. Nat Rev Genet. 2011;12:641–655. - PMC - PubMed
    1. Ding Y, et al. In vivo genome-wide profiling of RNA secondary structure reveals novel regulatory features. Nature. 2014;505:696–700. - PubMed
    1. Rouskin S, Zubradt M, Washietl S, Kellis M, Weissman JS. Genome-wide probing of RNA structure reveals active unfolding of mRNA structures in vivo. Nature. 2014;505:701–705. - PMC - PubMed
    1. Wan Y, et al. Landscape and variation of RNA secondary structure across the human transcriptome. Nature. 2014;505:706–709. - PMC - PubMed
    1. Li F, et al. Global analysis of RNA secondary structure in two metazoans. Cell Rep. 2012;1:69–82. - PubMed

Publication types