. 2015 Mar 17;42(3):443-56.
doi: 10.1016/j.immuni.2015.02.008.

Cytomegalovirus infection drives adaptive epigenetic diversification of NK cells with altered signaling and effector function

Affiliations

Cytomegalovirus infection drives adaptive epigenetic diversification of NK cells with altered signaling and effector function

Heinrich Schlums et al. Immunity. .

Abstract

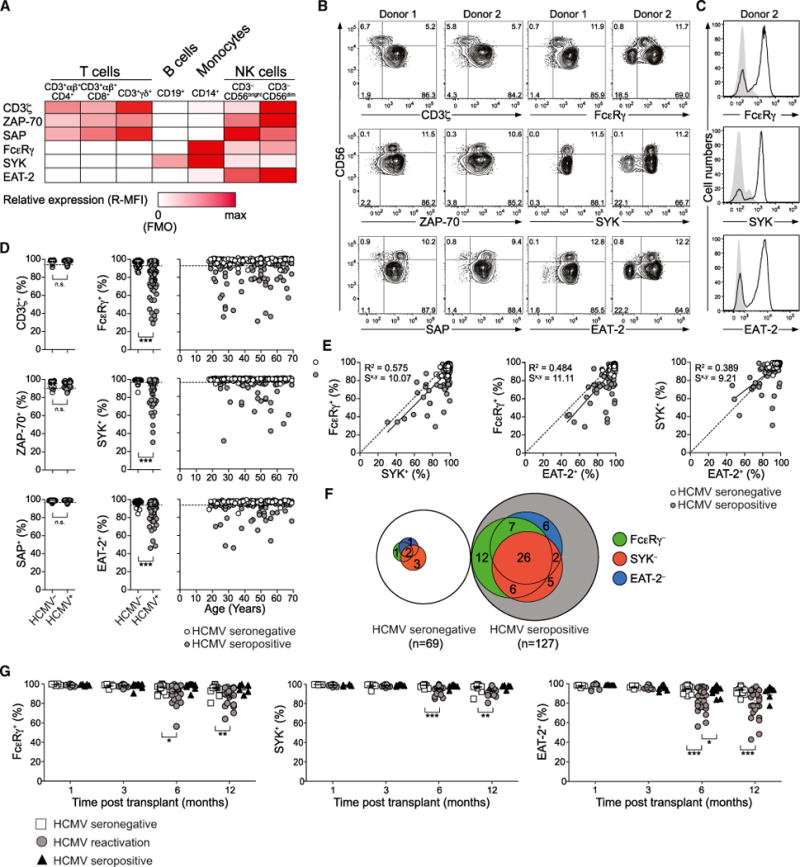
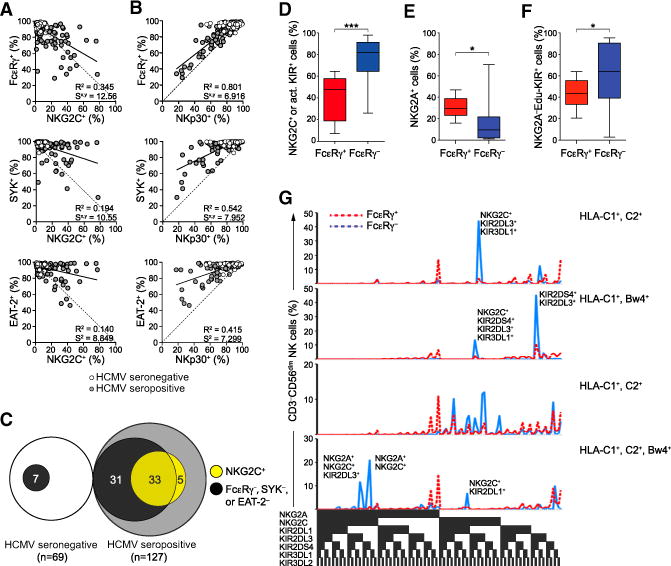
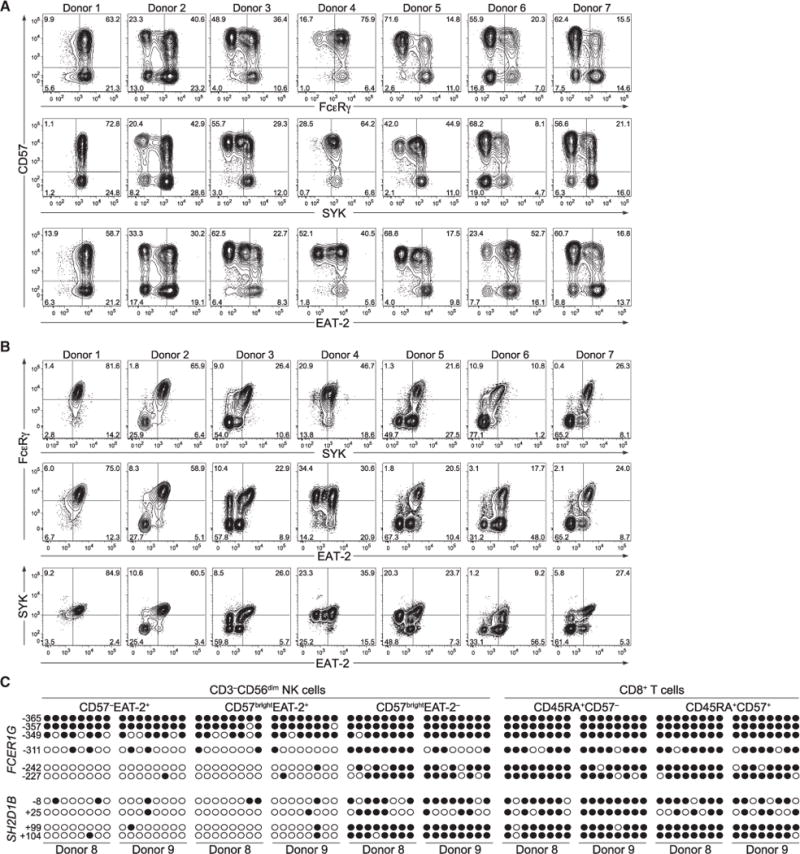
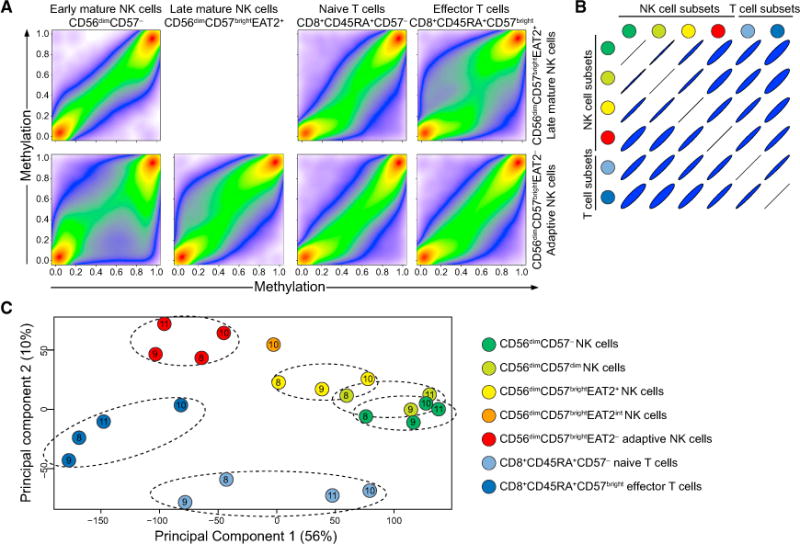
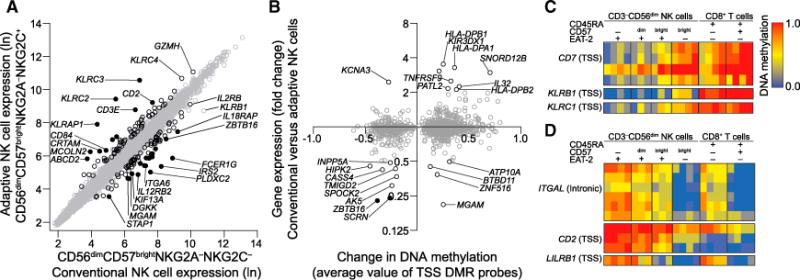
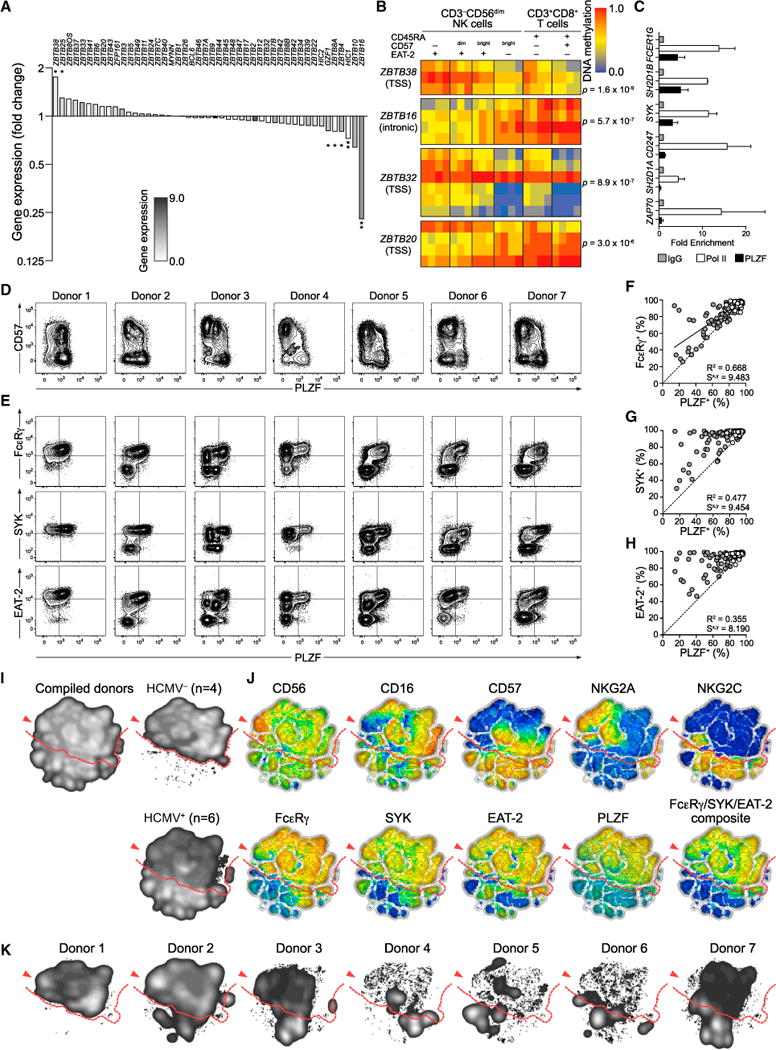
The mechanisms underlying human natural killer (NK) cell phenotypic and functional heterogeneity are unknown. Here, we describe the emergence of diverse subsets of human NK cells selectively lacking expression of signaling proteins after human cytomegalovirus (HCMV) infection. The absence of B and myeloid cell-related signaling protein expression in these NK cell subsets correlated with promoter DNA hypermethylation. Genome-wide DNA methylation patterns were strikingly similar between HCMV-associated adaptive NK cells and cytotoxic effector T cells but differed from those of canonical NK cells. Functional interrogation demonstrated altered cytokine responsiveness in adaptive NK cells that was linked to reduced expression of the transcription factor PLZF. Furthermore, subsets of adaptive NK cells demonstrated significantly reduced functional responses to activated autologous T cells. The present results uncover a spectrum of epigenetically unique adaptive NK cell subsets that diversify in response to viral infection and have distinct functional capabilities compared to canonical NK cell subsets.


Figures

Figure 1
Figure 1. The Presence of NK Cell Subsets Devoid of FcɛRγ, SYK, and EAT-2 Expression Is Associated with Cytomegalovirus Infection
(A–F) PBMCs from healthy human blood donors were analyzed by flow cytometry. (A) Relative median fluorescence intensity (MFI) of CD3ζ, ZAP-70, SAP, FcɛRγ, SYK, and EAT-2 expression in immune cell subsets. Data represent mean MFI values from three donors. (B) Expression of CD3ζ, ZAP-70, SAP, FcɛRγ, SYK, and EAT-2 in CD3CD56dim NK cells from two representative donors. (C) Expression of FcɛRγ, SYK, and EAT-2 in CD4+ T cells (filled histograms) and CD3CD56dim NK cells (black lines) in a representative donor lacking signaling proteins. (D) Frequency of CD3CD56dim NK cells expressing CD3ζ, ZAP-70, SAP, FcɛRγ, SYK, and EAT-2 from 196 healthy donors versus age of the individuals. HCMV (open circles) and HCMV+ (filled circles) individuals are indicated. Dotted lines indicate a threshold for outliers calculated as the mean of HCMV individuals plus 3 SD. ***p < 0.001 (Mann-Whitney test). (E) Relationship between the frequencies of CD3CD56dim NK cells expressing FcɛRγ, SYK, or EAT-2. Solid lines represent the correlation for HCMV+ individuals only. The coefficient of determination (R2) and standard error of estimate (Sx,y) values for HCMV+ individuals are indicated. (F) Relationship between donors with CD3CD56dim NK cells lacking FcɛRγ (green), SYK (red), or EAT-2 (blue) expression among HCMV+ and HCMV donors. See also Figure S1. (G) PBMCs from 78 allogeneic hematopoietic cell transplant patients with a total of 37 HCMV reactivation events were analyzed by flow cytometry for intracellular FcɛRγ, SYK, and EAT-2 expression within the CD3CD56dim NK cell subset at 1, 3, 6, and 12 months after transplant. Transplant patients were monitored weekly for HCMV reactivation, which occurs between 30 and 90 days after transplant, by PCR for HCMV DNA copy number. *p < 0.05, **p < 0.01, and ***p < 0.001 (Student’s t test).
Figure 2
Figure 2. FcɛRγ, SYK, and EAT-2 NK Cells Display an Adaptive NK Cell Phenotype
(A–C) PBMCs from 196 healthy human blood donors were analyzed by flow cytometry. The relationship between the frequencies of CD3CD56dim NK cells expressing NKG2C (A) or NKp30 (B) versus FcɛRγ, SYK, and EAT-2. Solid lines represent the correlation for HCMV+ individuals only. The coefficient of determination (R2) and standard error of estimate (Sx,y) values for HCMV+ individuals are indicated. Relationship (C) between donors with CD3CD56dim NK cells lacking FcɛRγ, SYK, and/or EAT-2 expression (black) versus displaying elevated NKG2C expression (light gray) among HCMV+ and HCMV donors. (D–G) PBMCs from 15 healthy KIR haplotype A donors were analyzed by flow cytometry (D–F) Percentages of CD3CD56dim NK cells expressing DAP12-coupled receptors NKG2C and/ or KIR2DS4 (D), inhibitory NKG2A (E), or educating KIRs without NKG2A (F). Bars indicate SD. (G) The distributions of CD3CD56dim NK cells expressing specific KIRs, NKG2A, and NKG2C in four HLA-typed individuals are shown. *p < 0.05 and ***p < 0.001 (Student’s t test). See also Figure S2.
Figure 3
Figure 3. Lack of Signaling Protein Expression in Adaptive NK Cells Is Associated with Promoter DNA Hypermethylation
(A and B) PMBCs from healthy donors were analyzed by flow cytometry. Plots depict CD57 versus signaling protein expression (A) or combinations of signaling proteins in CD3CD56dim NK cells (B) from representative HCMV (donor 1) and HCMV+ (donors 2–7) donors. (C) NK cell and T cell subsets were sorted from two HCMV+ donors. Genomic DNA from each cell subset was treated with sodium bisulfite, purified and amplified by PCR using primers specific for the promoter regions of FCER1G and SH2D1B. PCR fragments were cloned, sequenced, and analyzed for CpG methylation content. Each row represents one sequenced PCR clone. Open circles represent unmethylated and closed circles methylated cytosines. See also Figure S3.
Figure 4
Figure 4. Changes in DNA Methylation Patterns in Adaptive NK Cells Are Similar to Those in Cytotoxic T Cells
(A–C) NK and T cell subsets were sorted from four HCMV+ donors. Genomic DNA from each subset was treated with sodium bisulfite and subjected to genome-wide DNA methylation profiling. (A) Pseudo-color scatterplots illustrating multiple pairwise comparisons of methylation (β-value) over all probes from specific subsets in donor 10 after data filtering and probe normalization. A β-value close to zero corresponds with no methylation, and a β-value close to 1 corresponds with full methylation. (B) Correlation matrix of all pairwise subset comparisons. (C) MDS analysis of DNA methylation in NK cell and T cell subsets after data filtering and normalization. Samples are color coded based on the cell type and labeled according to the donor they were derived from (donors 8, 9, 10, and 11). Only probes with a high variability in β-values across the different cell subsets are shown (arbitrarily set as a ratio of standard deviation over a mean greater than 0.1, n = 271,769). Dimensions 1 and 2 represent the largest source of variation (totaling 66%). See also Figure S4.
Figure 5
Figure 5. Transcript Expression Analyses of Canonical and Adaptive NK Cells
(A) Microarray analyses of gene expression in sorted CD3CD56dimCD57brightNKG2ANKG2C versus CD3CD56dimCD57brightNKG2ANKG2C+ (corresponding to FcɛRγdim/−) NK cell subsets from four HCMV+ donors. Each circle represents the mean expression value of 20,364 individual genes. Genes regulated more than 2-fold (black circles) and more than 4-fold (filled circles) consistently among donors (p < 0.05, Student’s t test) are highlighted. (B) Relationship between the mean change in DNA methylation values of DMRs located in the vicinity of gene TSS (comparison of CD3CD56dimCD57 versus CD3CD56dimCD57brightEAT-2 NK cells) versus the corresponding mean change in gene expression (CD3CD56dimCD57brightNKG2C versus CD3CD56dimCD57brightNKG2C+ NK cells). (C and D) DNA methylation in the vicinity of TSSs of receptors that are downregulated (C) or upregulated (D) on the surface of adaptive NK cells. See also Figure S5.
Figure 6
Figure 6. Reduced PLZF Expression Specifically Marks Adaptive NK Cells
(A) Fold change in gene expression of BTB-ZF transcription factors in NK cell subsets. Bars indicate the mean fold change in expression for four donors. The bar filling reflects the average overall intensity of expression for indicated transcripts. *p < 0.05 and **p < 0.01 (paired Student’s t test). (B) BTB-ZF transcription factor DMRs. Heat maps show the DNA methylation in different cell subsets for a set of probes within each DMR. A β-value close to zero corresponds with no methylation, and a β-value close to 1 corresponds with full methylation. (C) ChIP analysis of PLZF and Pol II binding to the promoters of FCER1G, SH2D1B, SYK, CD247, SH2D1A, and ZAP70 using primary NK cell lysates from three donors in two separate experiments. Fold expression values are normalized against input and IgG controls. Bars indicate SD. (D–J) PMBCs from 196 healthy human blood donors were analyzed by flow cytometry. (D and E) Plots depict PLZF expression versus expression of CD57 (D) or FcɛRγ, SYK, or EAT-2 (E) in CD3CD56dim NK cells from representative HCMV (donor 1) and HCMV+ (donors 2–7) donors. (F–H) Plots depict the frequency of CD3CD56dim NK cells expressing PLZF versus FcɛRγ (F), SYK (G), or EAT-2 (H). Each circle represents one individual (n = 196). HCMV (open circles) and HCMV+ (filled circles) individuals are indicated. Solid lines represent the correlation for HCMV+ individuals only. (I–K) Barnes-Hut t-distributed stochastic neighbor embedding (t-SNE) analysis of 11-parametric data was performed on CD3CD56+ NK cells from four HCMV and six HCMV+ donors (donors 2–7). (I) Event density in the t-SNE field for all donors compiled together or HCMV and HCMV+ donors compiled separately. (J) Protein expression levels for single parameters in t-SNE field. Red represents high expression, whereas blue represents low expression. The composite FcɛRγ/SYK/EAT-2 parameter was constructed post-analysis. CD7 and CD161 stainings were also included in the model but are not shown. (K) Event density in the t-SNE field for CD3CD56+ NK cells from individual donors. Red arrows indicate the CD56bright NK cell population, and dashed red lines the border between canonical NK cell populations and adaptive NK cell populations found in HCMV+ individuals. See also Figure S6.
Figure 7
Figure 7. Adaptive NK Cells Display Altered Functional Responses
(A–C) PBMCs from HCMV+ individuals with a clear correlation between PLZF and FcɛRγ expression were left untreated or stimulated for 24 hr with combinations of IL-12, IL-15, and IL-18, then stained for intracellular IFN-γ and analyzed by flow cytometry. The frequencies of IFN-γ-expressing NK cells were quantified in CD3CD56bright or CD3CD56dim subsets subdivided according to expression of FcɛRγ and CD57. (A) Gating strategy and IFN-γ expression upon IL-12 plus IL-18 stimulation in NK cell subsets from one representative donor. (B) Frequencies of NK cells expressing IFN-γ within specific subsets upon stimulation with cytokines. (C) The frequencies of IFN-γ-expressing NK cells were quantified in CD3CD56bright or CD3CD56dim subsets subdivided according to expression of FcɛRγ and NKG2C. The frequencies of NK cells expressing IFN-γ within specific subsets upon stimulation with cytokines are presented. Values depict the mean of seven donors, and bars indicate SD. (D) Quantitative PCR analyses of gene expression in in sorted CD3CD56dimCD57brightNKG2ANKG2C versus CD3CD56dimCD57brightNKG2ANKG2C+ (corresponding to FcɛRγdim/−) NK cell subsets from four HCMV+ donors, as indicated. Bars indicate SD. (E) Immunoblot depicting STAT4 phoshorylation in response to IL-12 stimulation in NK cells from one representative donor. (F and G) PBMCs were stimulated with IL-18 or left untreated, and CD3CD56dim NK cell subsets were analyzed for phosphorylation of p38 MAPK and NF-kB p65 by phospho-specific flow cytometry. (F) Contour plots show CD3CD56dim NK cells from one representative donor. (G) Bar graphs display frequencies of phospho-p38 MAPK+ and phospho-NF-kB+ cells in CD3CD56dim NK cell subsets gated according to FcɛRγ expression. Values depict the mean of three donors, and bars indicate SD. (H–J) PBMCs were left untreated or stimulated for 6 hr with PMA and ionomycin and then analyzed by flow cytometry. Graphs show frequencies of NK cell subsets positive for (H) intracellular IFN-γ, (I) intracellular TNF, or (J) surface CD107a. Values depict the mean of eight donors, and bars indicate SD. (K and L) Purified CD4+ and CD8+ T cells were left untreated or activated with anti-CD3- and anti-CD28-coated beads for 60 hr, washed, and subsequently co-cultured with resting, autologous NK cells for 6 hr. Co-incubation with P815 target cells with or without anti-CD16 mAb served as the control. (K) Plots show CD107a surface expression versus FcɛRγ or EAT-2 expression on CD3CD56dim NK cells. (L) The graph depicts frequencies of CD107a-expressing NK cells according to stimulation and expression of FcɛRγ, SYK, and EAT-2. Bars indicate SD. (M–P) PBMCs were incubated for 6 hr with S2 cells pre-coated with increasing concentrations of rabbit serum, as indicated. The cells were stained and analyzed by flow cytometry. Graphs depict the frequencies of intracellular IFN-γ (M), intracellular TNF (N), or surface CD107a (O, P) expressing NK cell subsets. Stimulations were performed in regular medium (M–O) or medium containing 1 μM Src kinase inhibitor PP2 (P). Values depict the mean of eight donors, and bars indicate SD. (Q and R) Purified monocytes were mock or HCMV infected and cultured with autologous, labeled NK cells added IL-15. After 2 days, anti-HCMV IgG was added where indicated. After a total of 10 days co-culture, NK cells were stained and analyzed by flow cytometry. The frequency of NK cell subsets and their proliferation was determined. (Q) Frequency of FcɛRγ cells among total CD3CD56dim NK cells after co-culture with monocytes. (R) Proliferation of NK cell subsets after co-culture with monocytes, as indicated. Eight donors were used in the experiment, with mean and SD indicated. *p < 0.05, **p < 0.01, **p < 0.001 (Wilcoxon test). Bars indicate SD. See also Figure S7. Results are representative of at least three independent experiments.

Similar articles

Cited by

References

    1. Anfossi N, André P, Guia S, Falk CS, Roetynck S, Stewart CA, Breso V, Frassati C, Reviron D, Middleton D, et al. Human NK cell education by inhibitory receptors for MHC class I. Immunity. 2006;25:331–342. - PubMed
    1. Arsenio J, Kakaradov B, Metz PJ, Kim SH, Yeo GW, Chang JT. Early specification of CD8+ T lymphocyte fates during adaptive immunity revealed by single-cell gene-expression analyses. Nat Immunol. 2014;15:365–372. - PMC - PubMed
    1. Beaulieu AM, Zawislak CL, Nakayama T, Sun JC. The transcription factor Zbtb32 controls the proliferative burst of virus-specific natural killer cells responding to infection. Nat Immunol. 2014;15:546–553. - PMC - PubMed
    1. Béziat V, Liu LL, Malmberg JA, Ivarsson MA, Sohlberg E, Björklund AT, Retière C, Sverremark-Ekström E, Traherne J, Ljungman P, et al. NK cell responses to cytomegalovirus infection lead to stable imprints in the human KIR repertoire and involve activating KIRs. Blood. 2013;121:2678–2688. - PMC - PubMed
    1. Bezman NA, Kim CC, Sun JC, Min-Oo G, Hendricks DW, Kamimura Y, Best JA, Goldrath AW, Lanier LL, Gautier EL, et al. Molecular definition of the identity and activation of natural killer cells. Nat Immunol. 2012;13:1000–1009. - PMC - PubMed

Publication types

MeSH terms

Associated data