

Interferon-α inhibits CD4 T cell responses to interleukin-7 and interleukin-2 and selectively interferes with Akt signaling
- PMID: 25784743
- PMCID: PMC4438745
- DOI: 10.1189/jlb.4A0714-345RR
Interferon-α inhibits CD4 T cell responses to interleukin-7 and interleukin-2 and selectively interferes with Akt signaling
Abstract
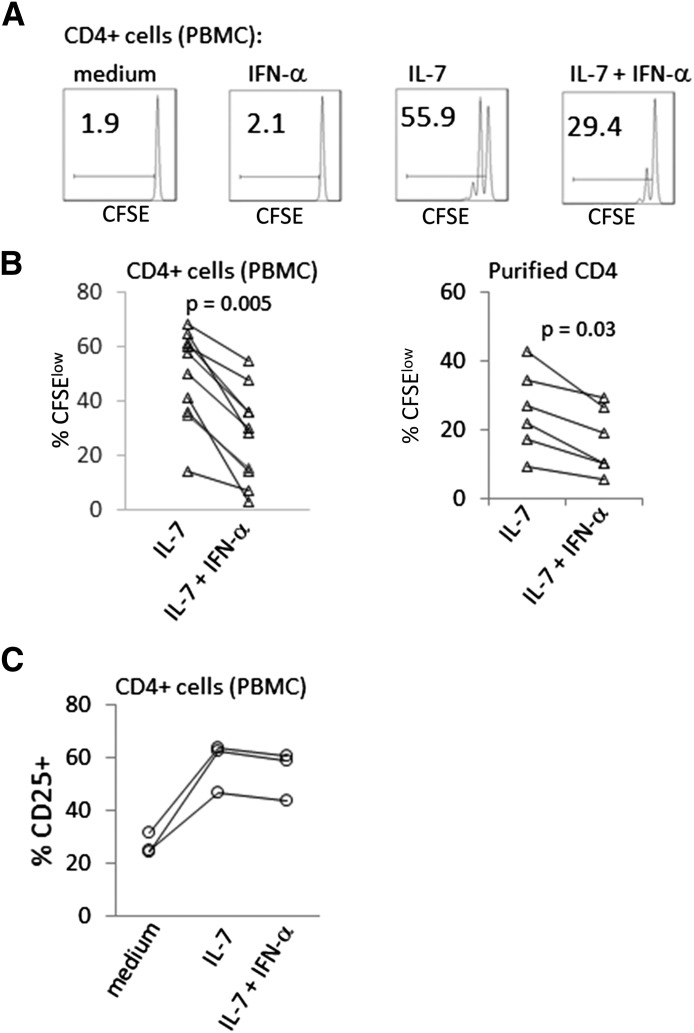
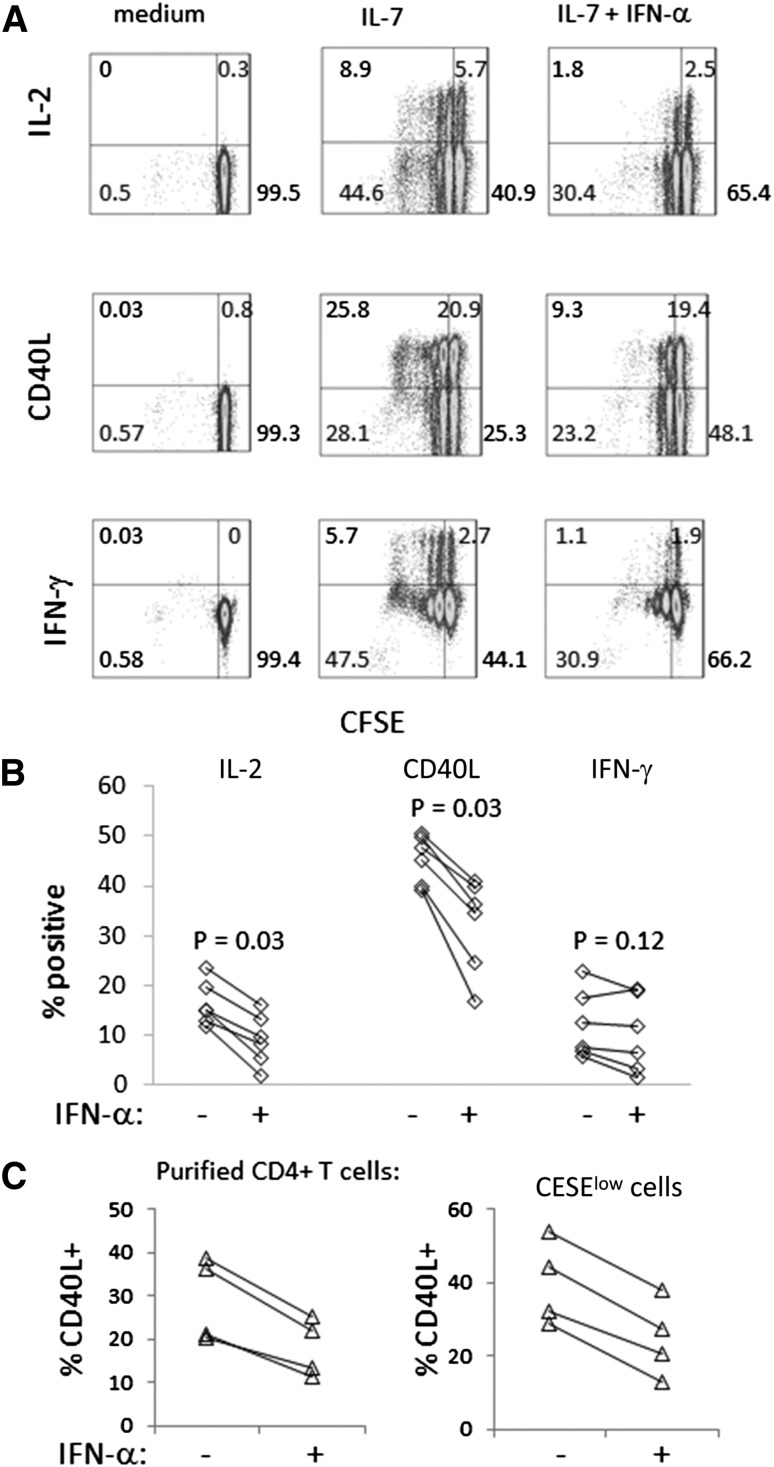
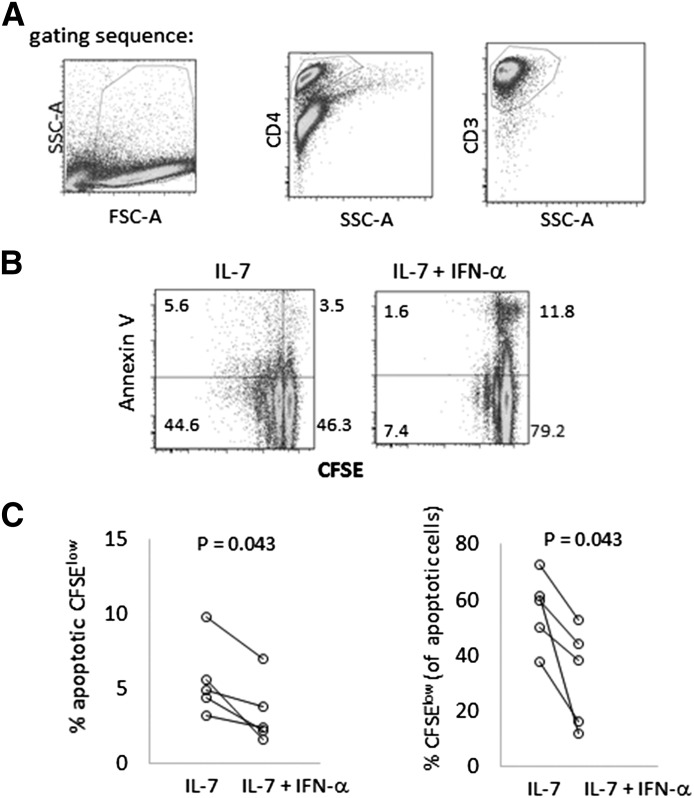
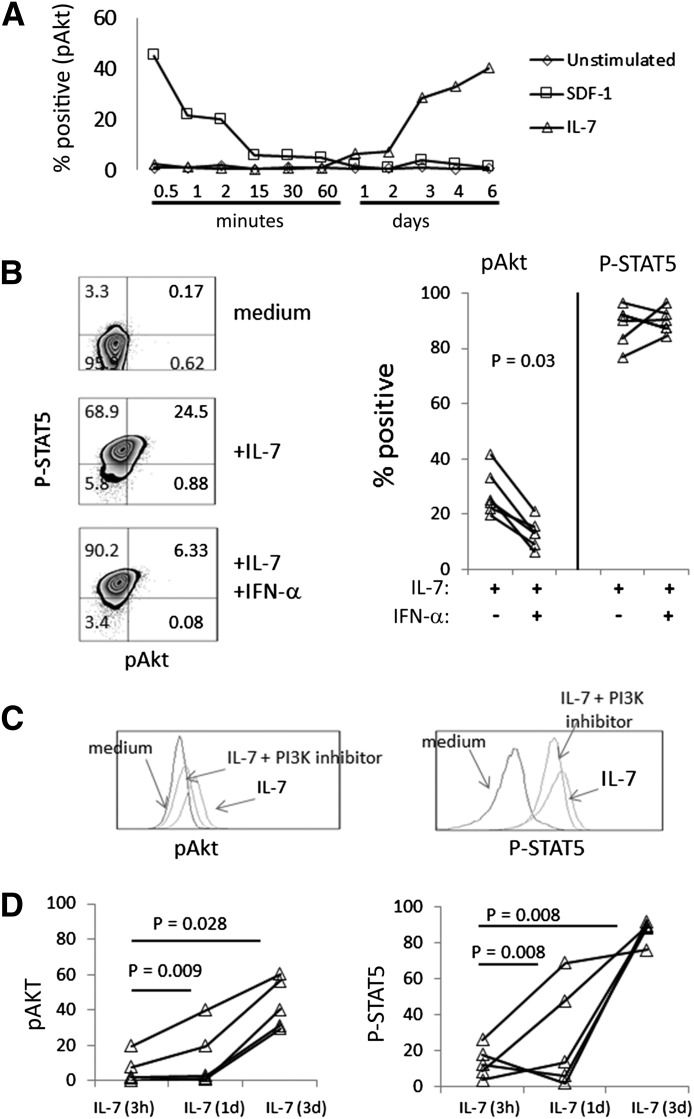
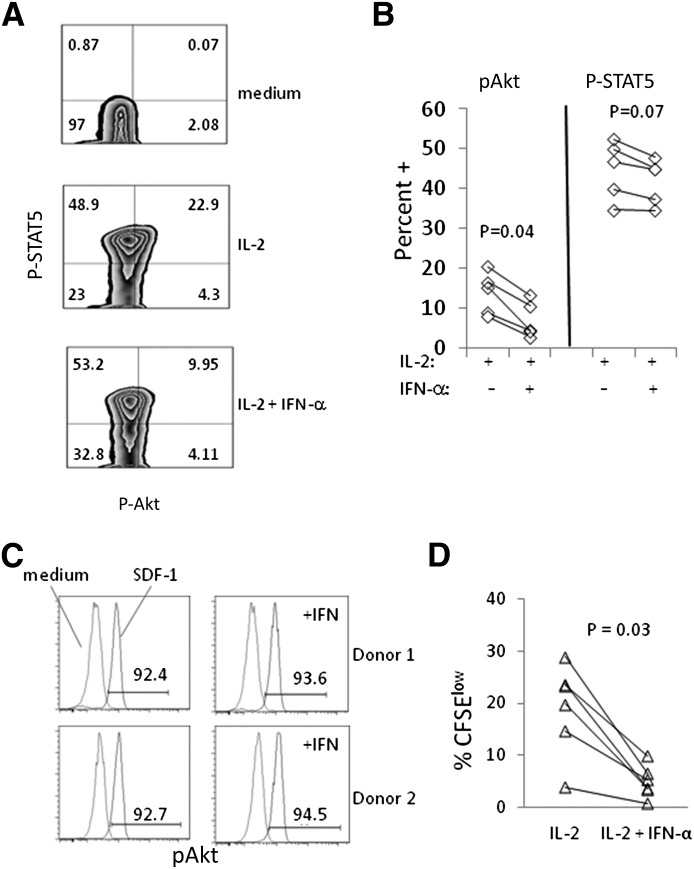
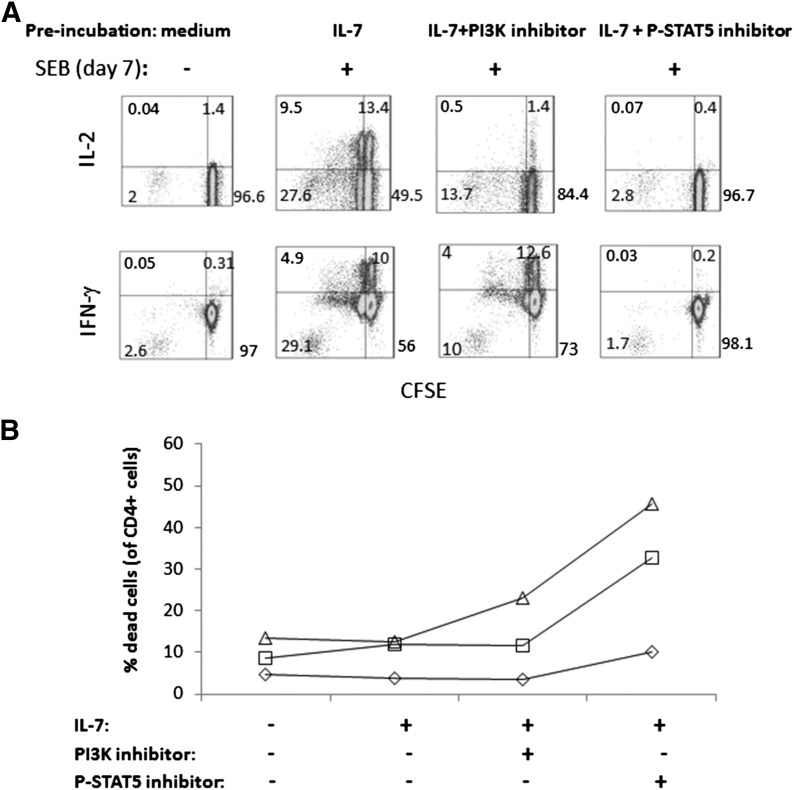
Persistent type I IFN production occurs during chronic viral infections, such as HIV disease. As type I IFNs have antiproliferative activity, it is possible that chronic exposure to these cytokines could adversely affect T cell homeostasis. We investigated the capacity of IFN-α to impair T cell proliferation induced by the homeostatic cytokine, IL-7, or another common γ-chain cytokine, IL-2, in cells from healthy human donors. We found that IL-7- or IL-2-induced proliferation of CD4(+) T cells was partially inhibited in the presence of IFN-α. The CD4(+) T cells that were exposed to IFN-α also displayed attenuated induction of IL-2 and CD40L following TCR stimulation. Analyses of signaling pathways indicated that IL-7 and IL-2 induced a delayed and sustained P-Akt signal that lasted for several days and was partially inhibited by IFN-α. In contrast, IL-7-induced P-STAT5 was not affected by IFN-α. Furthermore, IFN-α had no detectable effect on P-Akt that was induced by the chemokine SDF-1. Both inhibitors of P-Akt and P-STAT5 blocked IL-7-induced T cell proliferation, confirming that both signaling pathways are important for IL-7-induced T cell proliferation. These results demonstrate that IFN-α can selectively inhibit cytokine-induced P-Akt as a potential mechanism to disrupt homeostasis of T lymphocytes.
Keywords: cytokines; homeostatic proliferation.
© Society for Leukocyte Biology.
Figures
Similar articles
-
IFN-α exerts opposing effects on activation-induced and IL-7-induced proliferation of T cells that may impair homeostatic maintenance of CD4+ T cell numbers in treated HIV infection.J Immunol. 2014 Sep 1;193(5):2178-86. doi: 10.4049/jimmunol.1302536. Epub 2014 Jul 25. J Immunol. 2014. PMID: 25063872 Clinical Trial.
-
Antigen-independent induction of Tim-3 expression on human T cells by the common γ-chain cytokines IL-2, IL-7, IL-15, and IL-21 is associated with proliferation and is dependent on the phosphoinositide 3-kinase pathway.J Immunol. 2012 Apr 15;188(8):3745-56. doi: 10.4049/jimmunol.1102609. Epub 2012 Mar 14. J Immunol. 2012. PMID: 22422881
-
Interleukin-7 is required for CD4(+) T cell activation and autoimmune neuroinflammation.Clin Immunol. 2015 Dec;161(2):260-9. doi: 10.1016/j.clim.2015.08.007. Epub 2015 Aug 25. Clin Immunol. 2015. PMID: 26319414 Free PMC article.
-
Interleukin-7: master regulator of peripheral T-cell homeostasis?Trends Immunol. 2001 Oct;22(10):564-71. doi: 10.1016/s1471-4906(01)02028-2. Trends Immunol. 2001. PMID: 11574281 Review.
-
Opposing functions of IL-2 and IL-7 in the regulation of immune responses.Cytokine. 2011 Oct;56(1):116-21. doi: 10.1016/j.cyto.2011.07.005. Epub 2011 Jul 31. Cytokine. 2011. PMID: 21807532 Free PMC article. Review.
Cited by
-
IL-15 promotes activation and expansion of CD8+ T cells in HIV-1 infection.J Clin Invest. 2016 Jul 1;126(7):2745-56. doi: 10.1172/JCI85996. Epub 2016 Jun 20. J Clin Invest. 2016. PMID: 27322062 Free PMC article.
-
USP18 is a significant driver of memory CD4 T-cell reduced viability caused by type I IFN signaling during primary HIV-1 infection.PLoS Pathog. 2019 Oct 28;15(10):e1008060. doi: 10.1371/journal.ppat.1008060. eCollection 2019 Oct. PLoS Pathog. 2019. PMID: 31658294 Free PMC article.
-
Inflammation Perturbs the IL-7 Axis, Promoting Senescence and Exhaustion that Broadly Characterize Immune Failure in Treated HIV Infection.J Acquir Immune Defic Syndr. 2016 Apr 15;71(5):483-92. doi: 10.1097/QAI.0000000000000913. J Acquir Immune Defic Syndr. 2016. PMID: 26627102 Free PMC article.
-
CD8 T-Cell Expansion and Inflammation Linked to CMV Coinfection in ART-treated HIV Infection.Clin Infect Dis. 2016 Feb 1;62(3):392-6. doi: 10.1093/cid/civ840. Epub 2015 Sep 23. Clin Infect Dis. 2016. PMID: 26400999 Free PMC article.
-
Role of immune activation in progression to AIDS.Curr Opin HIV AIDS. 2016 Mar;11(2):131-7. doi: 10.1097/COH.0000000000000242. Curr Opin HIV AIDS. 2016. PMID: 26731430 Free PMC article. Review.
References
-
- Blomgren H., Strander H., Cantell K. (1974) Effect of human leukocyte interferon on the response of lymphocytes to mitogenic stimuli in vitro. Scand. J. Immunol. 3, 697–705. - PubMed
-
- Nederman T., Benediktsson G. (1982) Effects of interferon on growth rate and radiation sensitivity of cultured, human glioma cells. Acta Radiol. Oncol. 21, 231–234. - PubMed
-
- Einat M., Resnitzky D., Kimchi A. (1985) Close link between reduction of c-myc expression by interferon and, G0/G1 arrest. Nature 313, 597–600. - PubMed
-
- Erickson S., Matikainen S., Thyrell L., Sangfelt O., Julkunen I., Einhorn S., Grandér D. (2002) Interferon-alpha inhibits Stat5 DNA-binding in IL-2 stimulated primary T-lymphocytes. Eur. J. Biochem. 269, 29–37. - PubMed
Publication types
MeSH terms
Substances
Grants and funding
LinkOut - more resources
Full Text Sources
Research Materials
Miscellaneous
