Quantitative modeling of transcription factor binding specificities using DNA shape
- PMID: 25775564
- PMCID: PMC4403198
- DOI: 10.1073/pnas.1422023112
Quantitative modeling of transcription factor binding specificities using DNA shape
Abstract
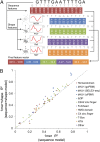
DNA binding specificities of transcription factors (TFs) are a key component of gene regulatory processes. Underlying mechanisms that explain the highly specific binding of TFs to their genomic target sites are poorly understood. A better understanding of TF-DNA binding requires the ability to quantitatively model TF binding to accessible DNA as its basic step, before additional in vivo components can be considered. Traditionally, these models were built based on nucleotide sequence. Here, we integrated 3D DNA shape information derived with a high-throughput approach into the modeling of TF binding specificities. Using support vector regression, we trained quantitative models of TF binding specificity based on protein binding microarray (PBM) data for 68 mammalian TFs. The evaluation of our models included cross-validation on specific PBM array designs, testing across different PBM array designs, and using PBM-trained models to predict relative binding affinities derived from in vitro selection combined with deep sequencing (SELEX-seq). Our results showed that shape-augmented models compared favorably to sequence-based models. Although both k-mer and DNA shape features can encode interdependencies between nucleotide positions of the binding site, using DNA shape features reduced the dimensionality of the feature space. In addition, analyzing the feature weights of DNA shape-augmented models uncovered TF family-specific structural readout mechanisms that were not revealed by the DNA sequence. As such, this work combines knowledge from structural biology and genomics, and suggests a new path toward understanding TF binding and genome function.
Keywords: DNA structure; protein binding microarray; protein−DNA recognition; statistical machine learning; support vector regression.
Conflict of interest statement
The authors declare no conflict of interest.
Figures


Comment in
-
Shapely DNA attracts the right partner.Proc Natl Acad Sci U S A. 2015 Apr 14;112(15):4516-7. doi: 10.1073/pnas.1503951112. Epub 2015 Apr 6. Proc Natl Acad Sci U S A. 2015. PMID: 25848058 Free PMC article. No abstract available.
Similar articles
-
High resolution models of transcription factor-DNA affinities improve in vitro and in vivo binding predictions.PLoS Comput Biol. 2010 Sep 9;6(9):e1000916. doi: 10.1371/journal.pcbi.1000916. PLoS Comput Biol. 2010. PMID: 20838582 Free PMC article.
-
Transcription factor family-specific DNA shape readout revealed by quantitative specificity models.Mol Syst Biol. 2017 Feb 6;13(2):910. doi: 10.15252/msb.20167238. Mol Syst Biol. 2017. PMID: 28167566 Free PMC article.
-
Stability selection for regression-based models of transcription factor-DNA binding specificity.Bioinformatics. 2013 Jul 1;29(13):i117-25. doi: 10.1093/bioinformatics/btt221. Bioinformatics. 2013. PMID: 23812975 Free PMC article.
-
In vitro DNA-binding profile of transcription factors: methods and new insights.J Endocrinol. 2011 Jul;210(1):15-27. doi: 10.1530/JOE-11-0010. Epub 2011 Mar 9. J Endocrinol. 2011. PMID: 21389103 Review.
-
Towards a better understanding of TF-DNA binding prediction from genomic features.Comput Biol Med. 2022 Oct;149:105993. doi: 10.1016/j.compbiomed.2022.105993. Epub 2022 Aug 17. Comput Biol Med. 2022. PMID: 36057196 Review.
Cited by
-
Noncanonical binding of transcription factors: time to revisit specificity?Mol Biol Cell. 2023 Aug 1;34(9):pe4. doi: 10.1091/mbc.E22-08-0325. Mol Biol Cell. 2023. PMID: 37486893 Free PMC article. Review.
-
The Effects of Sequence Variation on Genome-wide NRF2 Binding--New Target Genes and Regulatory SNPs.Nucleic Acids Res. 2016 Feb 29;44(4):1760-75. doi: 10.1093/nar/gkw052. Epub 2016 Jan 29. Nucleic Acids Res. 2016. PMID: 26826707 Free PMC article.
-
Deep neural networks identify sequence context features predictive of transcription factor binding.Nat Mach Intell. 2021 Feb;3(2):172-180. doi: 10.1038/s42256-020-00282-y. Epub 2021 Jan 18. Nat Mach Intell. 2021. PMID: 33796819 Free PMC article.
-
AptaTRACE Elucidates RNA Sequence-Structure Motifs from Selection Trends in HT-SELEX Experiments.Cell Syst. 2016 Jul;3(1):62-70. doi: 10.1016/j.cels.2016.07.003. Cell Syst. 2016. PMID: 27467247 Free PMC article.
-
Bayesian Markov models consistently outperform PWMs at predicting motifs in nucleotide sequences.Nucleic Acids Res. 2016 Jul 27;44(13):6055-69. doi: 10.1093/nar/gkw521. Epub 2016 Jun 9. Nucleic Acids Res. 2016. PMID: 27288444 Free PMC article.
References
-
- Shlyueva D, Stampfel G, Stark A. Transcriptional enhancers: From properties to genome-wide predictions. Nat Rev Genet. 2014;15(4):272–286. - PubMed
-
- Levo M, Segal E. In pursuit of design principles of regulatory sequences. Nat Rev Genet. 2014;15(7):453–468. - PubMed
-
- Stormo GD, Zhao Y. Determining the specificity of protein-DNA interactions. Nat Rev Genet. 2010;11(11):751–760. - PubMed
Publication types
MeSH terms
Substances
Associated data
- Actions
- Actions
Grants and funding
- R01 GM058575/GM/NIGMS NIH HHS/United States
- R01 HG003008/HG/NHGRI NIH HHS/United States
- R01GM106056/GM/NIGMS NIH HHS/United States
- U54CA121852/CA/NCI NIH HHS/United States
- U01 GM103804/GM/NIGMS NIH HHS/United States
- R35 GM118336/GM/NIGMS NIH HHS/United States
- U01GM103804/GM/NIGMS NIH HHS/United States
- R01 GM054510/GM/NIGMS NIH HHS/United States
- R01 GM106056/GM/NIGMS NIH HHS/United States
- F32 GM099160/GM/NIGMS NIH HHS/United States
- F32GM099160/GM/NIGMS NIH HHS/United States
- R01HG003008/HG/NHGRI NIH HHS/United States
- U54 CA121852/CA/NCI NIH HHS/United States
- R01GM058575/GM/NIGMS NIH HHS/United States
LinkOut - more resources
Full Text Sources
Other Literature Sources
Molecular Biology Databases
Research Materials
Miscellaneous

