. 2015 Jan 31:3:8.
doi: 10.1186/s40478-015-0186-2.

Tau depletion prevents progressive blood-brain barrier damage in a mouse model of tauopathy

Tau depletion prevents progressive blood-brain barrier damage in a mouse model of tauopathy

Laura J Blair et al. Acta Neuropathol Commun. .

Abstract

Introduction: The blood-brain barrier (BBB) is damaged in tauopathies, including progressive supranuclear palsy (PSP) and Alzheimer's disease (AD), which is thought to contribute to pathogenesis later in the disease course. In AD, BBB dysfunction has been associated with amyloid beta (Aß) pathology, but the role of tau in this process is not well characterized. Since increased BBB permeability is found in tauopathies without Aß pathology, like PSP, we suspected that tau accumulation alone could not only be sufficient, but even more important than Aß for BBB damage.

Results: Longitudinal evaluation of brain tissue from the tetracycline-regulatable rTg4510 tau transgenic mouse model showed progressive IgG, T cell and red blood cell infiltration. The Evans blue (EB) dye that is excluded from the brain when the BBB is intact also permeated the brains of rTg4510 mice following peripheral administration, indicative of a bonafide BBB defect, but this was only evident later in life. Thus, despite the marked brain atrophy and inflammation that occurs earlier in this model, BBB integrity is maintained. Interestingly, BBB dysfunction emerged at the same time that perivascular tau emerged around major hippocampal blood vessels. However, when tau expression was suppressed using doxycycline, BBB integrity was preserved, suggesting that the BBB can be stabilized in a tauopathic brain by reducing tau levels.

Conclusions: For the first time, these data demonstrate that tau alone can initiate breakdown of the BBB, but the BBB is remarkably resilient, maintaining its integrity in the face of marked brain atrophy, neuroinflammation and toxic tau accumulation. Moreover, the BBB can recover integrity when tau levels are reduced. Thus, late stage interventions targeting tau may slow the vascular contributions to cognitive impairment and dementia that occur in tauopathies.


Figures
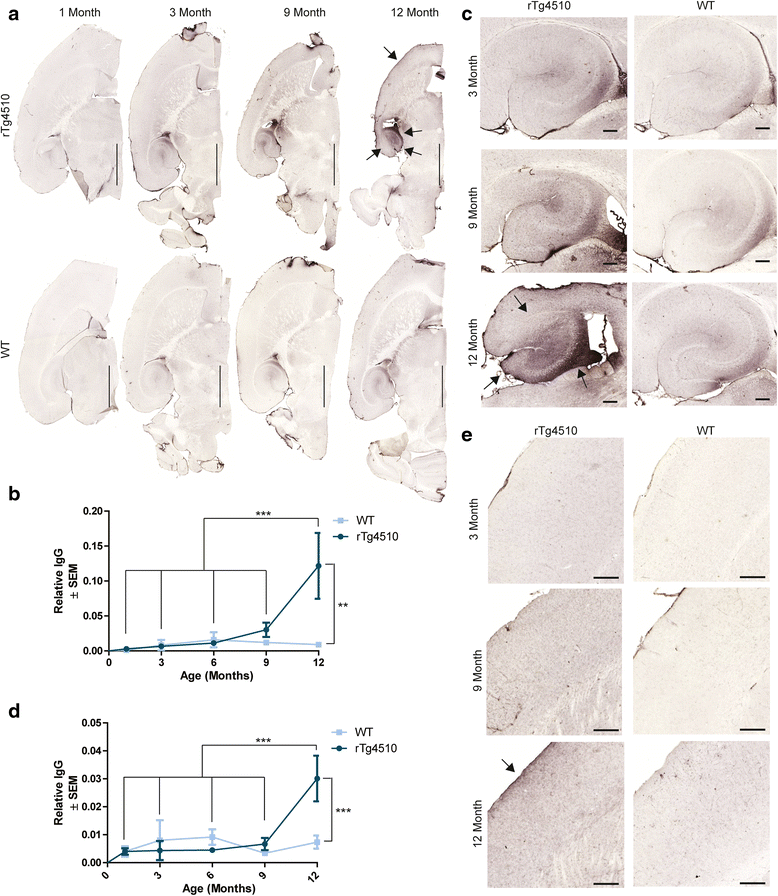
Figure 1
Figure 1
IgG accumulates with age in the rTg4510 mouse model. a Goat anti-mouse IgG staining on tissue from 1-, 3-, 9-, and 12-month old rTg4510 and wild-type (WT) mice. Arrows indicate areas of most intense IgG accumulation in the frontal cortex and hippocampus. Scale bar represents 2000 μm. Quantification of the relative area ratio of IgG accumulation in the b hippocampus (± SEM). ** p <0.01, ***p < 0.001. 5× magnification of the c hippocampus of 3-, 9-, and 12-month old rTg4510 and wild-type mice showing progressive accumulation of IgG in the hippocampus with age. Arrow indicates CA3 area has more IgG accumulation. Scale bar represents 200 μm. Quantification of the relative area ratio of IgG accumulation in the d frontal cortex (± SEM) of rTg4510 compared to wild-type mice with age. ***p < 0.001. 5x magnification of the e frontal cortex of 3-, 9-, and 12-month old rTg4510 and wild-type mice showing progressive accumulation of IgG in the cortex with age. Arrow highlights the most accumulation of IgG is on the surface of the cortex. Scale bar represents 200 μm.
Figure 2
Figure 2
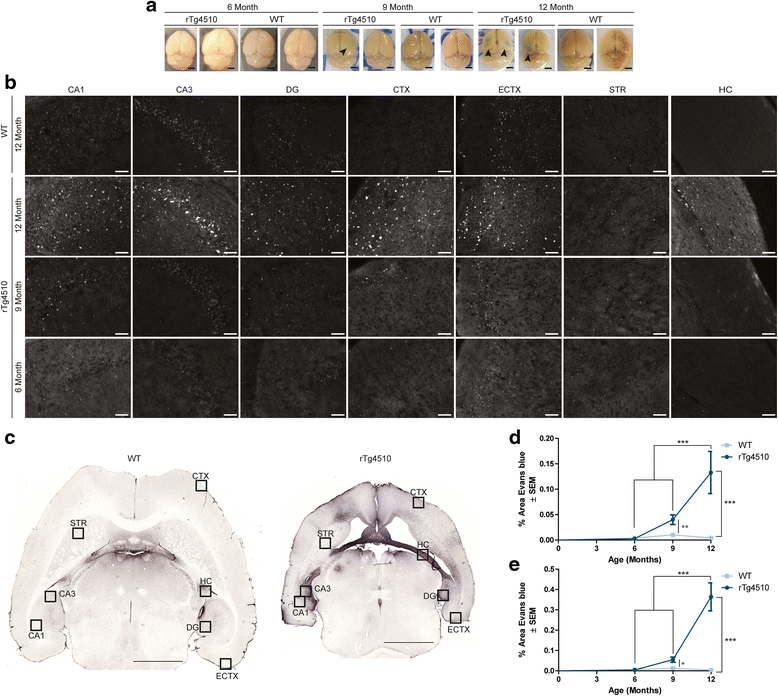
Evans blue (EB) extravasation reveals blood-brain barrier dysfunction in rTg4510 mice by 12 months of age. Representative images of whole brains immediately following perfusion displayed gross a EB extravasation (black arrowhead) in 9- and 12-month old rTg4510 mice. Scale bar represents 200 μm. Representative 20x images of b EB fluorescence in the CA1, CA3, dentate gyrus (DG), frontal cortex (CTX), entorhinal cortex (ECTX), striatum (STR), and hippocampal commissure (HC) of 12-month old wild-type and 6-, 9-, and 12-month old rTg4510 mice. Scale bar represents 50 μm. Representative whole brain image stained with c anti-mouse IgG from 12-month oldwild-type and rTg4510 mice showing map of locations used for EB fluorescent imaging in b. Scale bar represents 2000 um. Quantification of EB fluorescence in the d hippocampus (± SEM) of 6-, 9-, and 12-month old rTg4510 and wild-type mice. ***p <0.001, ** p <0.01. Quantification of EB fluorescence in the frontal cortex (± SEM) e of 6-, 9-, and 12-month old rTg4510 and wild-type mice. *** p <0.001, ** p <0.05.
Figure 3
Figure 3
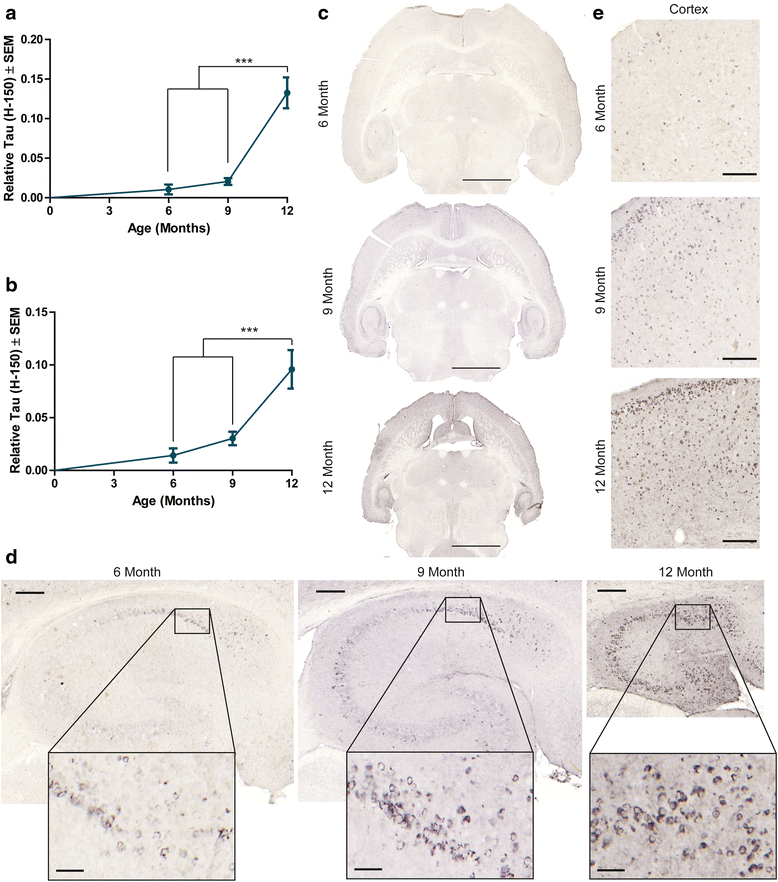
Tau (H-150) accumulation in aging rTg4510 mice. Tissue from aging rTg4510 mice were stained with total tau (H-150) and quantified for total tau (H-150) in the a hippocampus (± SEM) and b frontal cortex (± SEM) in rTg4510 mice. *** p <0.001. Representative images of a whole section stained with c total (H-150) tau from a 6-, 9-, and 12-month old rTg4510 mouse. Scale bar represents 2000 μm. Representative images from corresponding d hippocampus and e frontal cortex are shown. Scale bars represent 200 μm; hippocampus inset scale bar represents 50 μm.
Figure 4
Figure 4
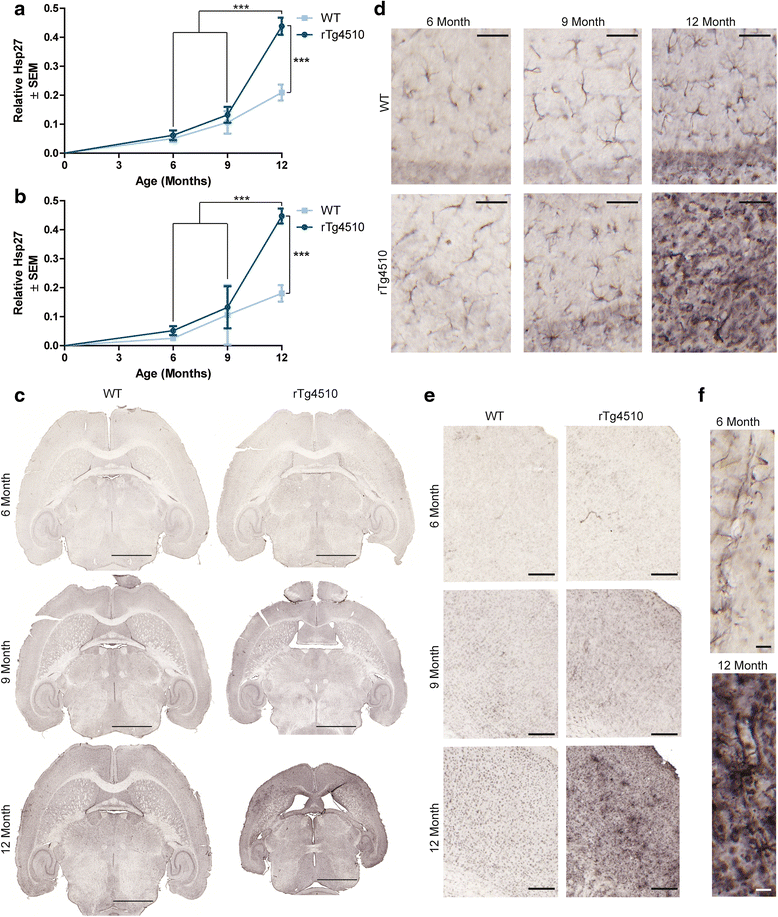
Hsp27 abundance increases with age in rTg4510 mouse brain. Hsp27 staining was quantified in the a hippocampus (± SEM) and b frontal cortex (± SEM) of 6-, 9-, and 12-month old rTg4510 and wild-type mice. ***p <0.001. Representative images of the c whole brain, d hippocampus (from CA1 region), and e frontal cortex are shown. Scale bars represent 2000 μm, 50 μm, and 200 μm respectively. High magnification images of f blood vessels in the hippocampus from 6- and 12-month old rTg4510 mice. Scale bar represents 20 μm.
Figure 5
Figure 5
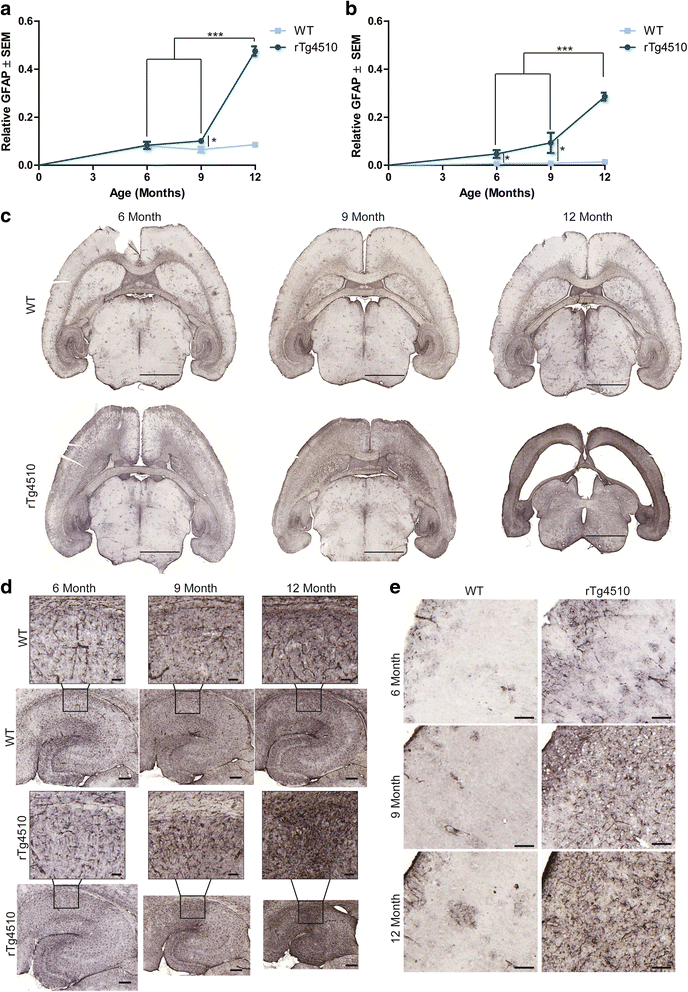
GFAP positive astrocytes accumulate with age in rTg4510 mice. Area ratio positive for GFAP immunoreactivity was quantified in the a hippocampus (± SEM) (*p = 0.01696; ***p <0.001) and b frontal cortex (± SEM) (6-month *p = 0.020102, 9 month *p = 0.04813, ***p <0.001) of wild-type and rTg4510 mice at 6, 9 and 12 months of age; c representative whole brain images are shown. Scale bar represents 2000 μm. Representative images of d hippocampus (± SEM) and e cortex (± SEM) of GFAP immunostained tissue from 6-, 9- and 12-month old wild-type and rTg4510 mice. Scale bar represents 100 μm; inset scale represents 20 μm.
Figure 6
Figure 6
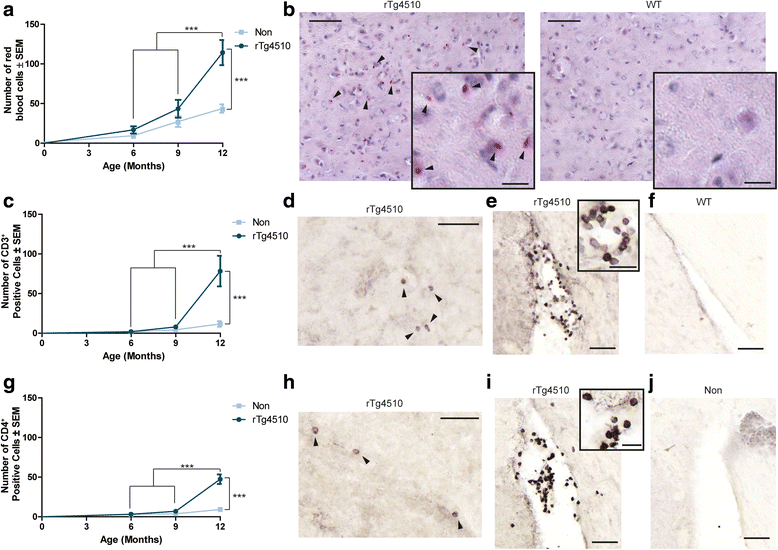
Erythrocytes and leukocytes infiltrate the brain of aged rTg4510 mice. Sections from 6-, 9-, and 12-month old rTg4510 and wild-type mice were stained with hematoxylin and eosin (H&E) and a red blood cells (RBCs) (± SEM) were manually counted throughout the brain. *** p <0.001. A 40x representative image of b H&E staining from 12-month old rTg4510 and wild-type mice is shown. Scale bar represents 50 μm; 20 μm inset. Arrowheads indicate positive RBCs. T cell lymphocytes were stained with c CD3+ antibody and counted (± SEM) in 6-, 9-, and 12-month old rTg4510 and age-matched wild-type mouse tissue. *** p <0.001. CD3+ T cells were found in 12-month old rTg4510 mice in the d hippocampus and in and around the e ventricles. Arrowheads indicate positive CD3+ T cells. However, there was very little positive staining was found in the f tissue or ventricles of age-matched wild-type littermates. Scale bar represents 50 μm in the hippocampus and ventricle images; inset scale bar represents 20 μm. T cell lymphocytes stained for g CD4+ were counted (± SEM) in 6-, 9-, and 12-month old rTg4510 and wild-type mouse tissue. *** p <0.001. CD4+ T cells were found in the h hippocampus and in and around the i ventricles of 12-month old rTg4510 backspace. Similar to CD3+ T cells, there was little j CD4+-positive staining in the tissue or ventricles of age-matched wild-type littermates. Arrowheads indicate CD4+ positive T cells. Scale bar represents 50 μm in the hippocampus and ventricle images; inset scale bar represents 20 μm.
Figure 7
Figure 7
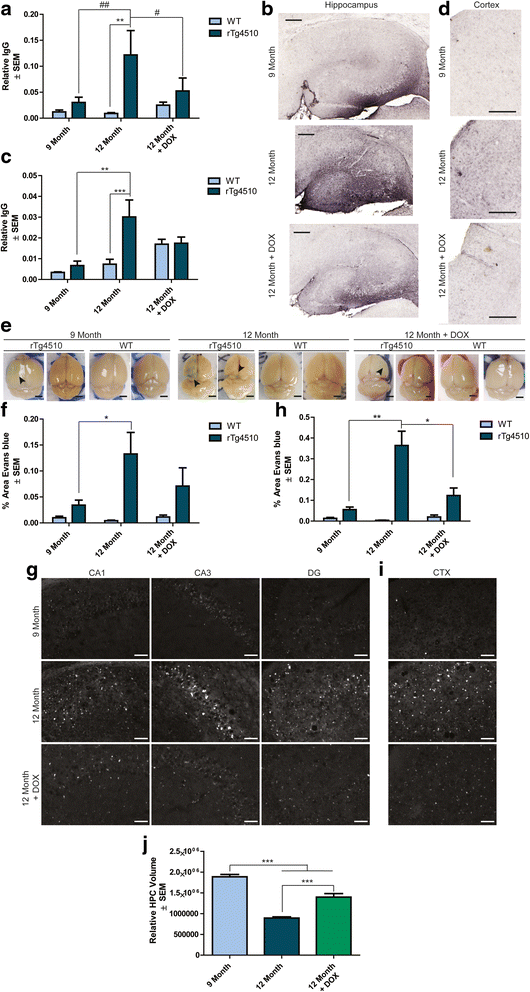
Tau suppression by DOX slows BBB defect in 12-month old rTg4510 mice. IgG levels in the (a and b) hippocampus (± SEM) and (c and d) frontal cortex (± SEM) of 12-month old DOX-treated mice compared to 9- and 12-month old wild-type and rTg4510 mice; Representative images are shown. *** p <0.001, ** p <0.01. Scale bar represents 200 μm. Images of e whole brains immediately following perfusion to observe Evans blue (EB) (black arrowhead) in 12 month DOX-treated mice compared to 9 and 12 month old rTg4510 relative to matching wild-type mice. Scale bar represents 200 μm. Positive EB expression was measured in the (f and g) hippocampus (± SEM) and (h and i) frontal cortex (± SEM) of 12 month old DOX-treated mice compared to 9- and 12-month old rTg4510 and age-matched wild-type mice; representative images of 9-month old, 12-month old, and DOX-treated 12-month old mice are shown. * p <0.05**, p <0.01. Scale bar represents 50 μm. Relative j hippocampal brain volume (± SEM) in 9- and 12-month old rTg4510 mice compared to 12-month old rTg4510 mice treated with DOX. *** p <0.001.
Figure 8
Figure 8
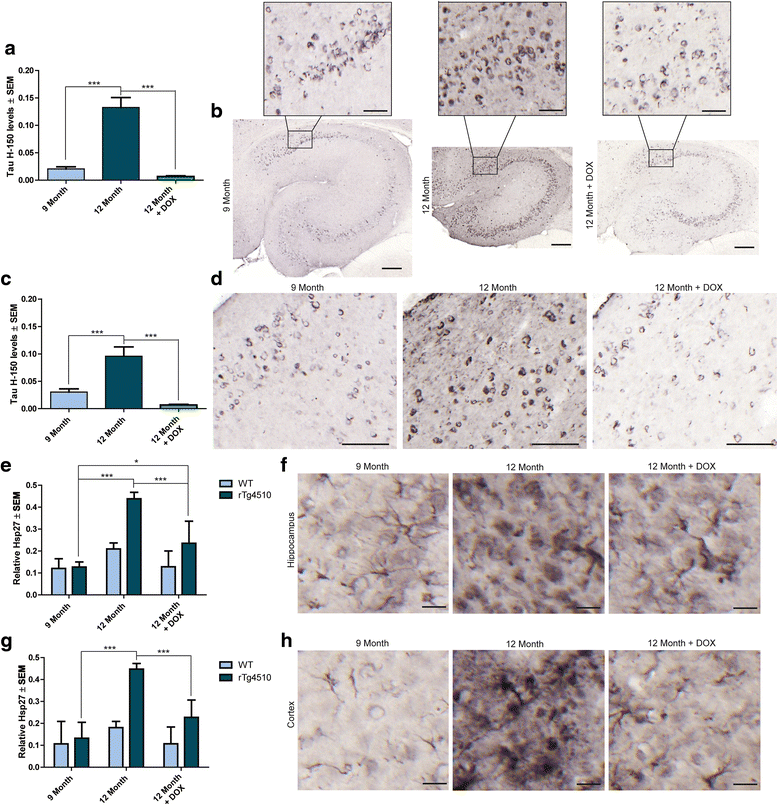
Effects of tau suppression on tau and Hsp27 levels. Quantification of relative tau (H-150) levels in the (a and b) hippocampus (± SEM) and (c and d) frontal cortex (± SEM) of DOX-treated 12-month old rTg4510 mice compared to 9- and 12-month old untreated rTg4510 mice; representative images are shown. Scale bar in cortical images represents 100 μm. *** p <0.001 Scale bar in hippocampal images represents 200 μm; inset scale bar represents 50 μm. Relative levels of Hsp27 in the (e and f) hippocampus (± SEM) and (g and h) frontal cortex (± SEM) from 12-month old DOX-treated mice compared to 9- and 12-month old mice, relative to wild-type controls; representative images are shown. Scale bar represents 20 μm. ** p <0.01, *** p <0.001.
Figure 9
Figure 9
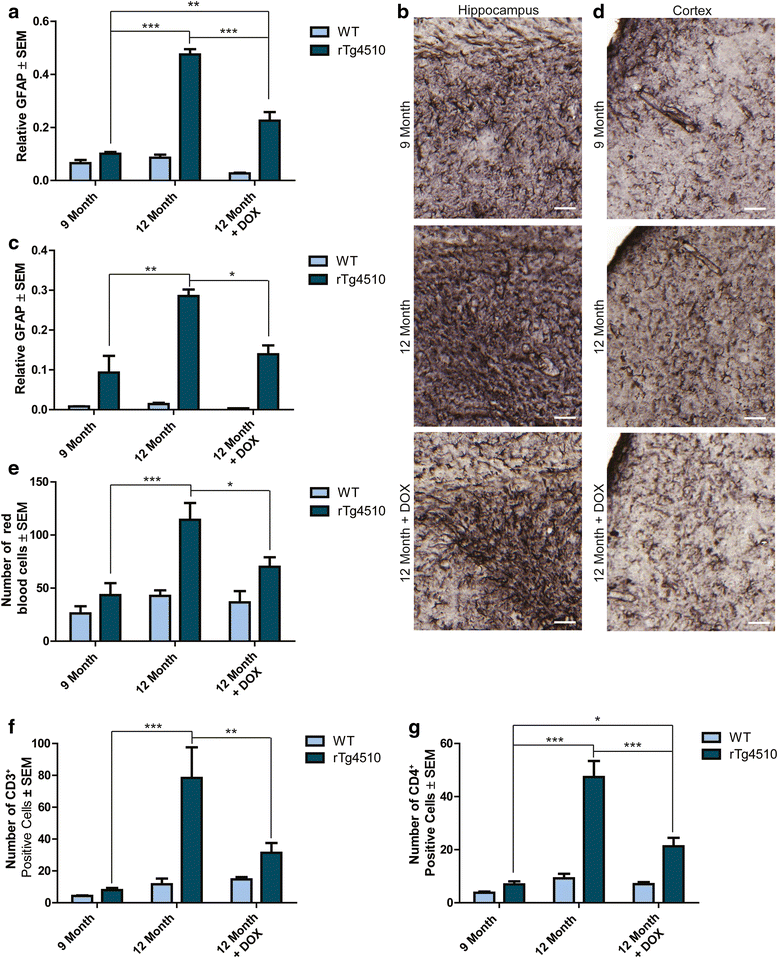
Effects of tau suppression on GFAP levels, RBCs and infiltration of T cell lymphocytes. Relative levels of GFAP positive astrocytes in the (a and b) hippocampus and (c and d) frontal cortex of 9-, 12-, and 12-month old + DOX treated rTg4510 and wild-type mice; representative images are shown. Scale bars represent 50 μm. * p <0.05, ** p <0.01, *** p <0.001. Number of e RBCs (± SEM) counted from H&E staining of 12-month old DOX-treated and 9-and 12-month old untreated rTg4510 mice relative to the levels of their wild-type littermates. * p <0.05, *** p <0.001. Number of f CD3+ (± SEM) and g CD4+ (± SEM) T cell lymphocytes in 9-, 12- and DOX-treated 12-month old rTg4510 mice compared wild-type controls * p <0.05, ** p <0.01, *** p <0.001.
Figure 10
Figure 10
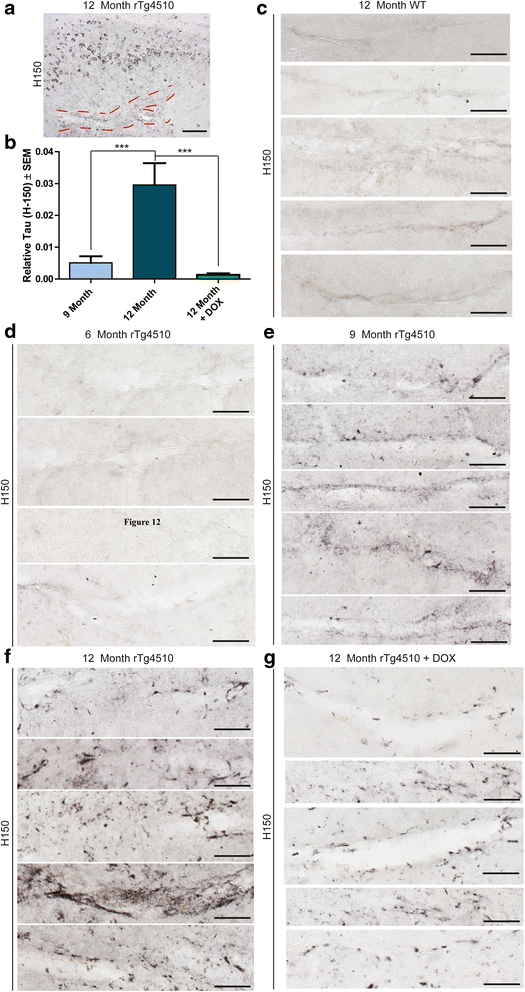
Tau accumulates along hippocampal blood vessels in 12-month old rT4510 mice. 20x magnification image of the a hippocampus of a 12-month old rTg4510 mouse stained with tau (H-150) to show the region of perivascular tau accumulation. Scale bar represents 100 μm. Relative levels of b tau (H-150) (± SEM) were measured in and around the longitudinal hippocampal blood vessels in 9- and 12-month old and 12-month old rTg4510 mice treated with DOX. ***p <0.001. Representative images of tau (H-150) stained tissue from a c 12-month wild-type mouse and rTg4510 mice at d 6, e 9, and f 12 months of age, and g 12-month old rTg4510 mice DOX-treated mice are shown. Scale bars represent 50 μm.
Figure 11
Figure 11
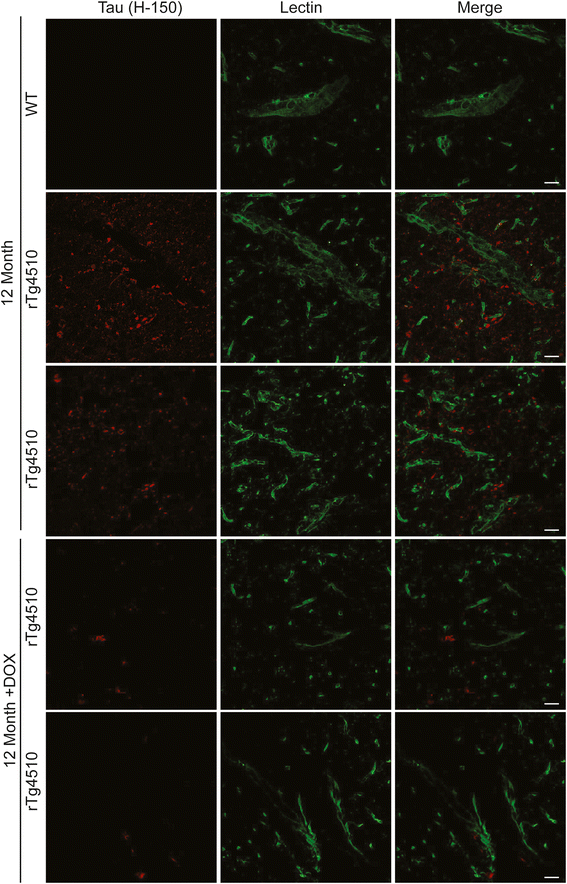
Perivascular tau is found along the blood vessels in 12-month old rTg4510 mice. 63x magnification images of tau (H-150; red) and Lectin 488 (green) along the hippocampal blood vessels from 12-month old WT, rTg4510 and DOX-treated mice. Scale bar represents 20 μm.
Figure 12
Figure 12
BBB breakdown correlates best with perivascular tau levels. Representative schematic depicting the timeline of progressive pathologies found in rTg4510 mice including tau accumulation, neuronal loss, tau tangle deposition, inflammation, appearance of perivascular tau, and initiation of increased BBB permeability. Tau accumulation begins at a very young age, before one month, followed by regional neuronal loss. A few months after tau tangles start to deposit just after signs of inflammation are noticeable. Neuron loss continues to get more severe with age and by 9 months vascular tau is detectable in the hippocampus, concomitant with the start of increased BBB permeability.

Similar articles

Cited by

References

    1. Broadwell RD, Salcman M. Expanding the definition of the blood-brain barrier to protein. Proc Natl Acad Sci U S A. 1981;78(12):7820–7824. doi: 10.1073/pnas.78.12.7820. - DOI - PMC - PubMed
    1. Wenkel H, Streilein JW, Young MJ. Systemic immune deviation in the brain that does not depend on the integrity of the blood-brain barrier. J Immunol. 2000;164(10):5125–5131. doi: 10.4049/jimmunol.164.10.5125. - DOI - PubMed
    1. Mooradian AD. Effect of aging on the blood-brain barrier. Neurobiol Aging. 1988;9(1):31–39. doi: 10.1016/S0197-4580(88)80013-7. - DOI - PubMed
    1. Marques F, Sousa JC, Sousa N, Palha JA. Blood-brain-barriers in aging and in Alzheimer's disease. Mol Neurodegener. 2013;8:38. doi: 10.1186/1750-1326-8-38. - DOI - PMC - PubMed
    1. Sengillo JD, Winkler EA, Walker CT, Sullivan JS, Johnson M, Zlokovic BV. Deficiency in mural vascular cells coincides with blood-brain barrier disruption in Alzheimer's disease. Brain Pathol. 2013;23(3):303–310. doi: 10.1111/bpa.12004. - DOI - PMC - PubMed

Publication types

MeSH terms

LinkOut - more resources