Comparative Study
. 2015 Apr;125(4):1509-22.
doi: 10.1172/JCI77716. Epub 2015 Mar 9.

MicroRNA-188 regulates age-related switch between osteoblast and adipocyte differentiation

Comparative Study

MicroRNA-188 regulates age-related switch between osteoblast and adipocyte differentiation

Chang-Jun Li et al. J Clin Invest. 2015 Apr.

Abstract

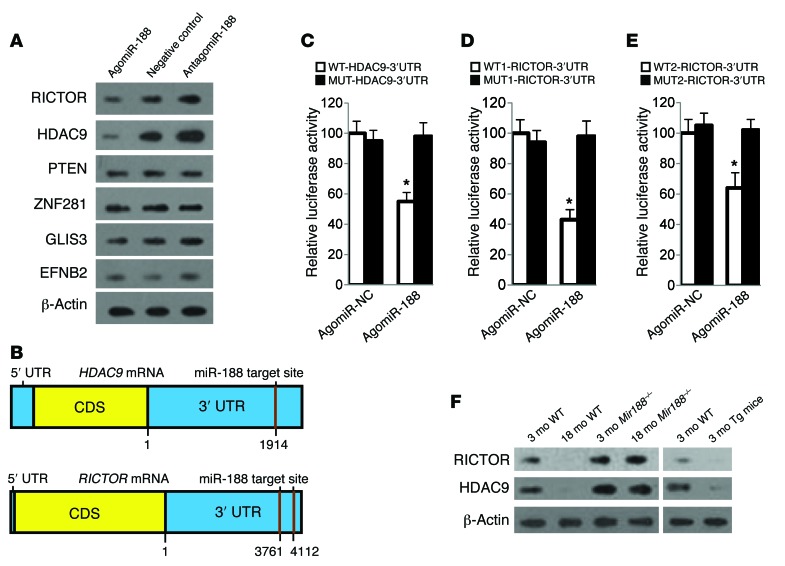
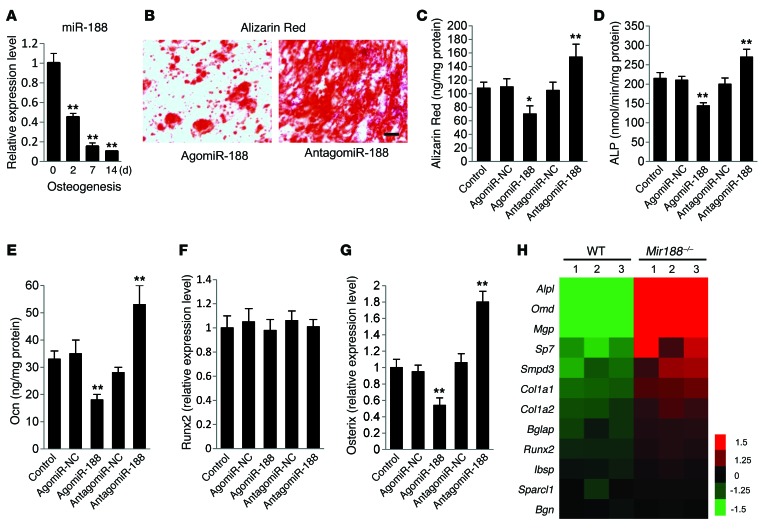
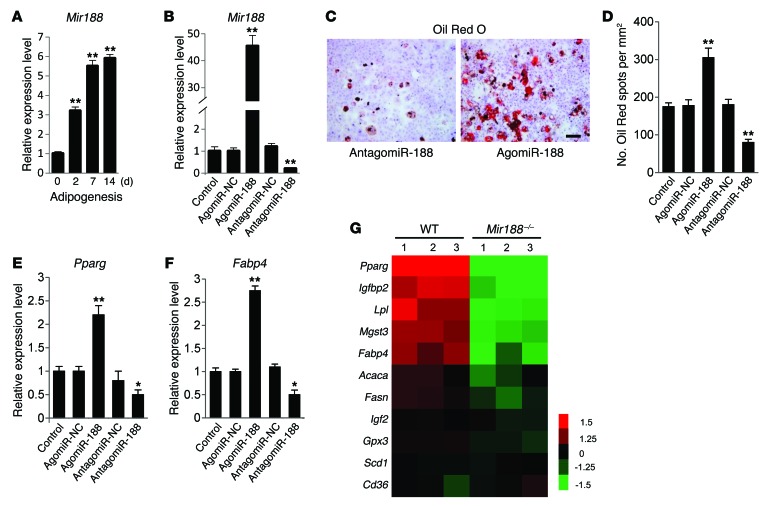
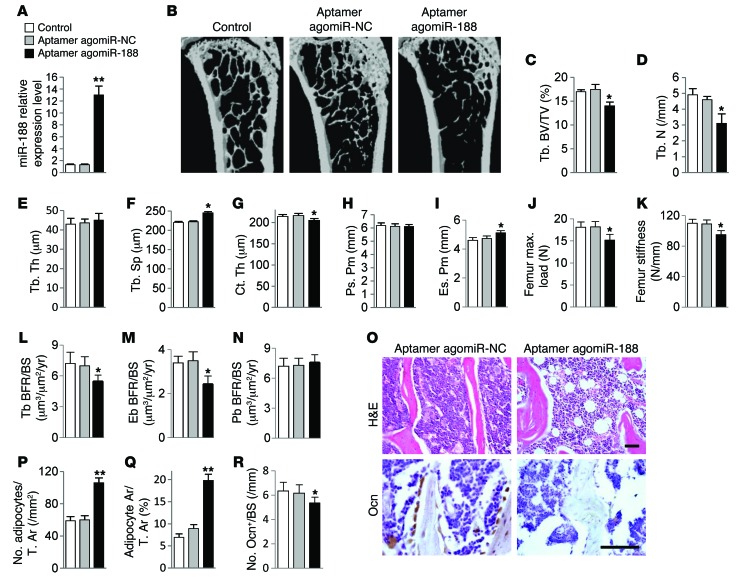
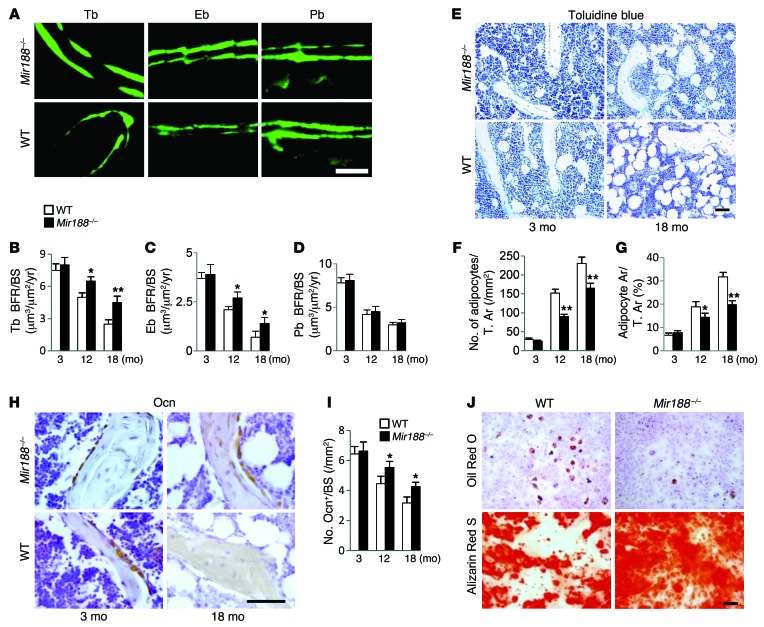
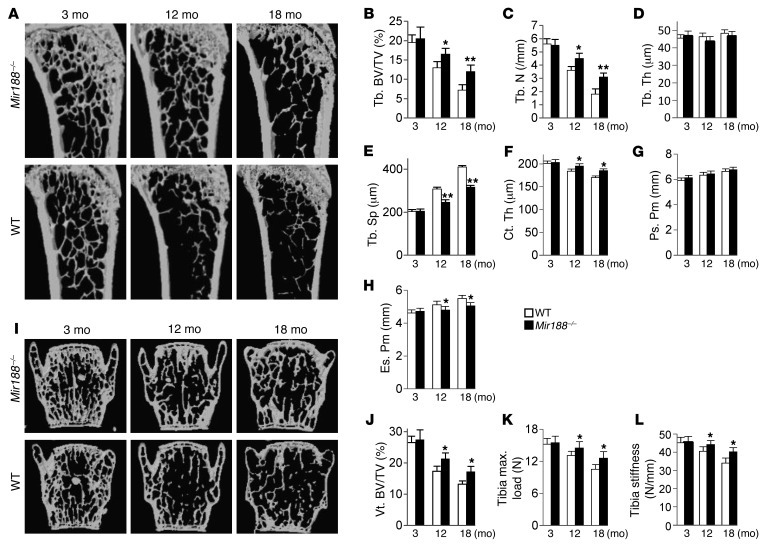
Bone marrow mesenchymal stem cells (BMSCs) exhibit an age-dependent reduction in osteogenesis that is accompanied by an increased propensity toward adipocyte differentiation. This switch increases adipocyte numbers and decreases the number of osteoblasts, contributing to age-related bone loss. Here, we found that the level of microRNA-188 (miR-188) is markedly higher in BMSCs from aged compared with young mice and humans. Compared with control mice, animals lacking miR-188 showed a substantial reduction of age-associated bone loss and fat accumulation in bone marrow. Conversely, mice with transgenic overexpression of miR-188 in osterix+ osteoprogenitors had greater age-associated bone loss and fat accumulation in bone marrow relative to WT mice. Moreover, using an aptamer delivery system, we found that BMSC-specific overexpression of miR-188 in mice reduced bone formation and increased bone marrow fat accumulation. We identified histone deacetylase 9 (HDAC9) and RPTOR-independent companion of MTOR complex 2 (RICTOR) as the direct targets of miR-188. Notably, BMSC-specific inhibition of miR-188 by intra-bone marrow injection of aptamer-antagomiR-188 increased bone formation and decreased bone marrow fat accumulation in aged mice. Together, our results indicate that miR-188 is a key regulator of the age-related switch between osteogenesis and adipogenesis of BMSCs and may represent a potential therapeutic target for age-related bone loss.


Figures

Figure 9
Figure 9. Injection of aptamer-antagomiR-188 into bone marrow stimulates bone formation and decreases marrow fat accumulation in aged mice.
(A) qRT-PCR analysis of the levels of miR-188 expression in BMSCs of mice with BMSC-specific antagomiR-188 delivery. Aptamer-antagomiR-188 was injected into femoral bone marrow cavity of 15-month-old mice twice per month for 3 months. NC, negative control. (BI) Representative μCT images (B) and quantitative μCT analysis of trabecular (CF) and cortical (GI) bone microarchitecture in femora from aptamer-treated mice. n = 10 per group. (J and K) Three-point bending measurement of femur maximum load (J) and stiffness (K). n = 5 per group. (LN) Calcein double labeling–based quantification of bone formation rate per bone surface (BFR/BS) in femora. n = 5 per group. (OR) Representative images of H&E staining (O, top) and osteocalcin immunohistochemical staining (O, bottom) and quantification of number and area of adipocytes (P and Q) and number of osteoblasts (R) in distal femora. Scale bars: 100 μm. n = 5 per group. Data shown as mean ± SD. *P < 0.05, **P < 0.01 (ANOVA).
Figure 8
Figure 8. MiR-188 directly targets HDAC9 and RICTOR.
(A) Western blot analysis of the relative levels of HDAC9, RICTOR, PTEN, ZNF281, GLIS3, and EFNB2 protein expression in BMSCs transfected with agomiR-188 and antagomiR-188. β-Actin was used as loading control. Data are representative of 3 independent experiments. (B) Schematic of miR-188 putative target sites in mouse Hdac9 and Rictor 3′-UTR. CDS, coding sequence. (CE) BMSCs were transfected with luciferase reporter carrying WT or MUT 3′-UTR of the HDAC9 gene (WT–HDAC9–3′-UTR and MUT–HDAC9-3′–UTR) (C) WT1–Rictor–3′-UTR and MUT1–Rictor–3′-UTR (D), WT2–Rictor–3′-UTR and MUT2–Rictor–3′-UTR (E), respectively, and cotransfected with agomiR-188 or agomiR-NC. Effects of miR-188 on the reporter constructs were determined at 48 hours after transfection. Firefly luciferase values, normalized for renilla luciferase, are presented. n = 3 per group. (F) Western blot analysis of HDAC9 and RICTOR protein expression in BMSCs from different mice as indicated. Data are representative of 3 independent experiments. Data shown as mean ± SD. *P < 0.01 vs. MUT-pGL3-HDAC9 or -RICTOR (Student’s t test).
Figure 7
Figure 7. MiR-188 inhibits osteogenic differentiation of BMSCs.
(A) qRT-PCR analysis of the relative levels of miR-188 expression in BMSCs cultured in osteogenesis induction medium (300 ng/ml BMP-2, 50 μg/ml ascorbic acid, and 5 mM β-glycerolphosphate) for the days as indicated. n = 5 per group. (B and C) Representative images of Alizarin Red S staining (B) and quantitative analysis (C) of matrix mineralization in BMSCs transfected with agomiR-188, antagomiR-188, or their controls and cultured in osteogenesis induction medium for 21 days. n = 5 per group. Scale bar: 100 μm. (D and E) Analysis of ALP activity (D) and osteocalcin secretion (E) in BMSCs cultured in osteogenesis induction medium for 48 hours. (F and G) qRT-PCR analysis of the relative levels of osterix (F) and Runx2 (G) mRNA expression in BMSCs cultured in osteogenesis induction medium for 48 hours. n = 5 per group. (H) Microarray profiling results of dysregulated osteogenic genes in WT and Mir188–/– mouse–derived BMSCs cultured in osteogenesis induction medium for 48 hours. Data shown as mean ± SD. *P < 0.05, **P < 0.01 (ANOVA).
Figure 6
Figure 6. MiR-188 promotes adipogenic differentiation of BMSCs.
(A) qRT-PCR analysis of the relative levels of miR-188 expression in BMSCs cultured in adipogenesis induction medium (0.5 mM 3-isobutyl-1-methyl­xanthine, 5 μg/ml insulin, and 1 μM dexamethasone) for the days as indicated. n = 5 per group. (B) qRT-PCR analysis of the relative levels of miR-188 expression in BMSCs transfected with 10 μM agomiR-188, antagomiR-188, or their negative controls. NC, negative control. n = 5 per group. (C and D) Representative images of Oil Red O staining of lipids (C) and quantification of the number of spots (D) in BMSCs cultured in adipogenesis induction medium for 14 days. Scale bar: 100 μm. (E and F) qRT-PCR analysis of the relative levels of Pparg (E) and Fabp4 (F) mRNA expression in BMSCs cultured in adipogenesis induction medium for 48 hours. (G) Microarray profiling results of dysregulated adipogenic genes in WT and Mir188–/– mouse–derived BMSCs cultured in adipogenesis induction medium for 48 hours. Data shown as mean ± SD. *P < 0.05, **P < 0.01 (ANOVA).
Figure 5
Figure 5. Mice with BMSC-specific overexpression of miR-188 using aptamer delivery system exhibit reduced bone formation and increased marrow fat accumulation.
(A) qRT-PCR analysis of levels of miR-188 expression in BMSCs of mice with aptamer delivery. NC, negative control. n = 6 per group. (BI) Representative μCT images (B) and quantitative μCT analysis of trabecular (CF) and cortical bone (GI) microarchitecture in femora from aptamer-treated mice. n = 10. (J and K) Three-point bending measurement of femur maximum load (J) and stiffness (K). n = 5 per group. (LN) Calcein double labeling–based quantification of bone formation rate per bone surface (BFR/BS) in femora. n = 5 per group. (OR) Representative images of H&E staining (O, top) and osteocalcin immunohistochemical staining (O, bottom) and quantification of number and area of adipocytes (P and Q) and number of osteoblasts (R) in distal femora. Scale bars: 100 μm. n = 5 per group. Data shown as mean ± SD. *P < 0.05, **P < 0.01 (ANOVA).
Figure 4
Figure 4. Mice with transgenic overexpression of miR-188 in osterix+ osteoprogenitors exhibit accelerated bone marrow fat accumulation and bone loss.
(A) Representative μCT images with quantitative μCT analysis of trabecular and cortical bone microarchitecture (BH) in femora from 6- and 12-month-old WT and miR-188 transgenic (Tg) mice. n = 6 per group. (I) Quantitative μCT analysis of the ratio of bone volume to tissue volume of L4 vertebrae (Vt. BV/TV). (J and K) Three-point bending measurement of tibia stiffness (J) and maximum load (K). n = 5 per group. (LN) Calcein double labeling–based quantification of bone formation rate per bone surface (BFR/BS) in femora. n = 5 per group. (OR) Representative images of toluidine blue staining (O, top) and osteocalcin immunohistochemical staining (O, bottom) and quantification of number and area of adipocytes (P and Q) and number of osteoblasts (R) in distal femora. n = 8 per group. Data shown as mean ± SD. *P < 0.05, **P < 0.01 (Student’s t test). Scale bar: 100 μm.
Figure 3
Figure 3. Mir188–/– mice show higher osteoblastic bone formation and lower marrow fat accumulation in aged mice.
(A) Representative images of calcein double labeling of trabecular (Tb), endosteal (Eb), and periosteal bone (Pb) with quantification (BD) of bone formation rate per bone surface (BFR/BS) in femora of 18-month-old WT and Mir188–/– mice. Scale bar: 50 μm. n = 6 per group. (E) Representative images of toluidine blue staining with quantification of number and area of adipocytes in distal femora (F and G). Scale bar: 100 μm. (H) Representative images of osteocalcin immunohistochemical staining with quantification of number of osteoblasts in distal femora (I). Scale bar: 100 μm. n = 6 per group. (J) Representative images of Oil Red O staining of lipids (top) and Alizarin Red S staining of matrix mineralization (bottom) in BMSCs from Mir188–/– mice and WT mice cultured in adipogenesis induction medium for 14 days and osteogenesis induction medium for 21 days, respectively. Scale bar: 100 μm. Data are representative of 3 independent experiments. Data shown as mean ± SD. *P < 0.05, **P < 0.01 (Student’s t test).
Figure 2
Figure 2. Mir188–/– mice exhibit reduced age-associated bone loss.
(AH) Representative microcomputed tomography (μCT) images (A) and quantitative μCT analysis of trabecular (BE) and cortical (FH) bone microarchitecture in femora from 3-, 12-, and 18-month-old WT and miR-188 knockout (Mir188–/–) mice. n = 6 per group. Tb. BV/TV, trabecular bone volume per tissue volume; Tb. Th, trabecular thickness; Tb. Sp, trabecular separation; Ct. Th, cortical thickness; Ps. Pm, periosteal perimeter; Es. Pm, endosteal perimeter. (I and J) Representative μCT images (I) and quantification of the ratio of bone volume to tissue volume (J) of L4 vertebrae (Vt. BV/TV). n = 6 per group. (K and L) Three-point bending measurement of tibia maximum load (K) and stiffness (L). n = 5 per group. Data shown as mean ± SD. *P < 0.05, **P < 0.01 (Student’s t test).
Figure 1
Figure 1. Aging induces miR-188 expression in BMSCs.
(AD) Representative images of toluidine blue (T.) staining (A, top) and osteocalcin (Ocn) immunohistochemical staining (A, bottom) and quantification of number and area (Ar) of adipocytes (B and C) and number of osteoblasts (D) in distal femora from 3-month-old and 18-month-old female C57BL/6 mice. Tb. N, trabecular number. Scale bars: 100 μm. n = 6 per group. (E) Microarray profiling results of deregulated miRNAs in BMSCs from young and aged mice. (F) qRT-PCR analysis of the levels of miR-188 expression in BMSCs derived from the mice at different ages. n = 6 per group. (G and H) Age-associated changes of miR-188 levels in BMSCs from 85 human females (G) and 85 males (H). Data shown as mean ± SD. *P < 0.05, **P < 0.01 (BD, Student’s t test; F, ANOVA).

Similar articles

Cited by

References

    1. Pittenger MF, et al. Multilineage potential of adult human mesenchymal stem cells. Science. 1999;284(5411):143–147. doi: 10.1126/science.284.5411.143. - DOI - PubMed
    1. Sekiya I, Larson BL, Vuoristo JT, Cui JG, Prockop DJ. Adipogenic differentiation of human adult stem cells from bone marrow stroma (MSCs). J Bone Miner Res. 2004;19(2):256–264. - PubMed
    1. Moerman EJ, Teng K, Lipschitz DA, Lecka-Czernik B. Aging activates adipogenic and suppresses osteogenic programs in mesenchymal marrow stroma/stem cells: the role of PPAR-γ2 transcription factor and TGF-β/BMP signaling pathways. Aging Cell. 2004;3(6):379–389. doi: 10.1111/j.1474-9728.2004.00127.x. - DOI - PMC - PubMed
    1. Shen W, et al. MRI-measured pelvic bone marrow adipose tissue is inversely related to DXA-measured bone mineral in younger and older adults. Eur J Clin Nutr. 2012;66(9):983–988. doi: 10.1038/ejcn.2012.35. - DOI - PMC - PubMed
    1. Yeung DK, Griffith JF, Antonio GE, Lee FK, Woo J, Leung PC. Osteoporosis is associated with increased marrow fat content and decreased marrow fat unsaturation: a proton MR spectroscopy study. J Magn Reson Imaging. 2005;22(2):279–285. doi: 10.1002/jmri.20367. - DOI - PubMed

Publication types

MeSH terms