. 2015 Mar 5;6(3):e1674.
doi: 10.1038/cddis.2015.7.

TRPC1-mediated Ca²⁺ entry is essential for the regulation of hypoxia and nutrient depletion-dependent autophagy

Affiliations

TRPC1-mediated Ca²⁺ entry is essential for the regulation of hypoxia and nutrient depletion-dependent autophagy

P Sukumaran et al. Cell Death Dis. .

Abstract

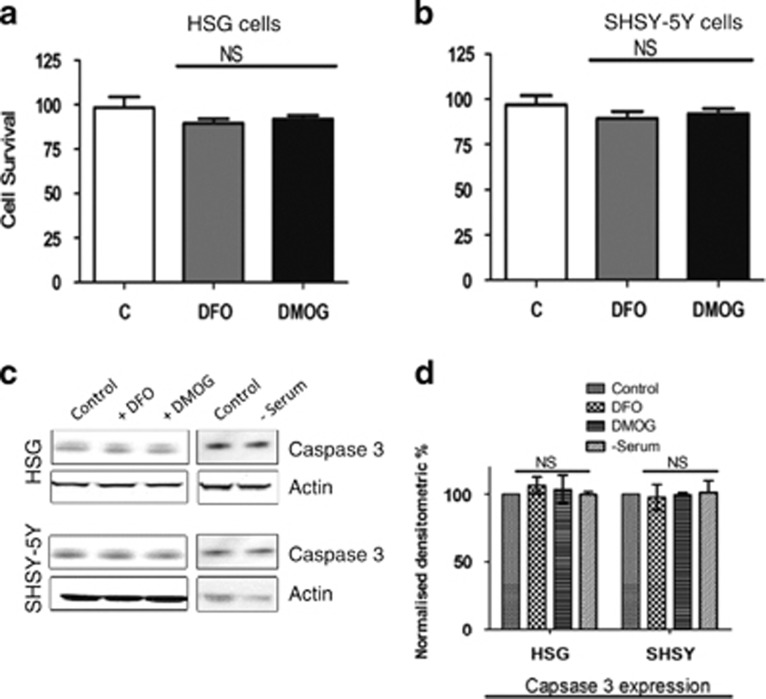
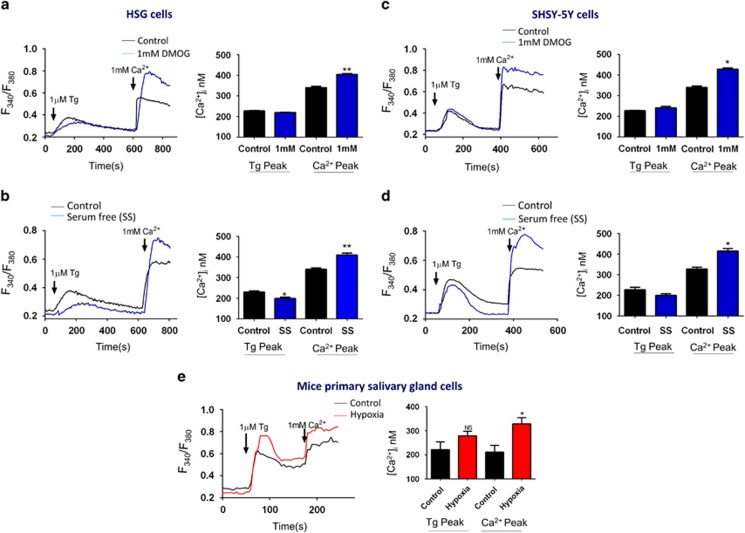
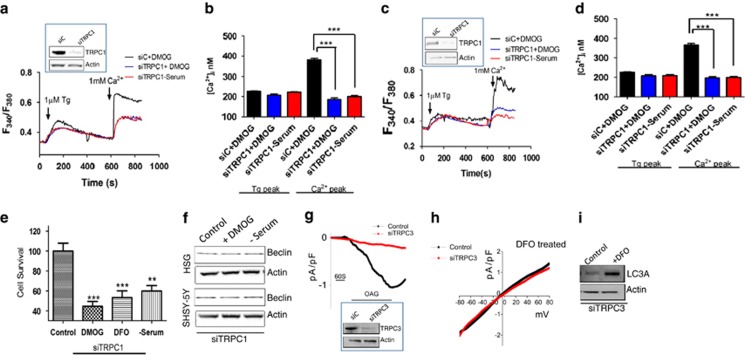
Autophagy is a cellular catabolic process needed for the degradation and recycling of protein aggregates and damaged organelles. Although Ca(2+) is suggested to have an important role in cell survival, the ion channel(s) involved in autophagy have not been identified. Here we demonstrate that increase in intracellular Ca(2+) via transient receptor potential canonical channel-1 (TRPC1) regulates autophagy, thereby preventing cell death in two morphologically distinct cells lines. The addition of DMOG or DFO, a cell permeable hypoxia-mimetic agents, or serum starvation, induces autophagy in both epithelial and neuronal cells. The induction of autophagy increases Ca(2+) entry via the TRPC1 channel, which was inhibited by the addition of 2APB and SKF96365. Importantly, TRPC1-mediated Ca(2+) entry resulted in increased expression of autophagic markers that prevented cell death. Furthermore, hypoxia-mediated autophagy also increased TRPC1, but not STIM1 or Orai1, expression. Silencing of TRPC1 or inhibition of autophagy by 3-methyladenine, but not TRPC3, attenuated hypoxia-induced increase in intracellular Ca(2+) influx, decreased autophagy, and increased cell death. Furthermore, the primary salivary gland cells isolated from mice exposed to hypoxic conditions also showed increased expression of TRPC1 as well as increase in Ca(2+) entry along with increased expression of autophagic markers. Altogether, we provide evidence for the involvement of Ca(2+) influx via TRPC1 in regulating autophagy to protect against cell death.


Figures

Figure 1
Figure 1
Induced Autophagy in SH-SY5Y and HSG cells. (a) HSG and SHSY-5Y cells were treated for 24 h with 1 mM DFO, 1 mM DMOG, and in a serum-free media. Protein was isolated and western blots represent the protein expression of different autophagy marker beclin-1, LC3A, p62, and loading control actin. (b) Corresponding densitometric reading of the autophagy marker protein is shown as a bar diagram. Each bar gives the mean±S.E.M. of four separate experiments. *P<0.05, **P<0.01, and ***P<0.001. Confocal image of HSG and SH-SY5Y cells, respectively, transfected with fluorescent-tagged LC3 and treated for 24 h with 200μM DFO or 200μM DMOG. (c and d) Western blot images showing the expression of autophagy marker LC3A in primary salivary gland cells isolated from normoxia- and hypoxia-induced mice models. (e) Bar diagram representing the densitometric reading of the LC3A in the above-mentioned western blots. Each bar gives the mean±S.E.M. of four separate experiments
Figure 2
Figure 2
DMOG and DFO treatment effects on the cell viability or apoptosis in the cells. (a) Bar diagram showing the cell viability assay (MTT assay) in the HSG cells and (b) SHSY-5Y cells pretreated with 1 mM of both DFO and DMOG. Each bar gives the mean±S.E.M. of four separate experiments. NS indicates no significance. (c) Western blot images showing the expression of caspase 3 in SHSY-5Y and HSG cells pretreated with 1 mM DMOG and 1 mM DFO or in serum-free media for 24 h. (d) Bar diagram representing the densitometric reading of the caspase 3 expression in the above-mentioned western blots. Each bar gives the mean±S.E.M. of four separate experiments. NS indicates no significance
Figure 3
Figure 3
Increase intracellular calcium in autophagy induces cells. Representative traces showing the transient increase in [Ca2+]i after addition of 1 mM calcium to HSG cells (a) and in SHSY-5Y cells (b) pretreated with 1 mM DMOG. Bar diagram shows the [Ca2+]i in nM concentration of the above-mentioned experiment. Each bar gives the mean±S.E.M. of 50 separate experiments. *P<0.05 and **P<0.01. Representative traces showing the transient increase in [Ca2+]i after the addition of 1 mM calcium to HSG cells (c) and in SHSY-5Y cells (d) pretreated with serum-free media. Bar diagram shows the [Ca2+]i in nM concentration of the above-mentioned experiment. Each bar gives the mean±S.E.M. of 45 separate experiments. *P<0.05 and **P<0.01. (e) Representative traces showing the transient increase in [Ca2+]i after addition of 1 mM calcium in primary salivary gland cells isolated from the hypoxia induce mice model when compared to the control (normoxia) samples. Bar diagram shows the [Ca2+]i in nM concentration of the above-mentioned experiment. Each bar gives the mean±S.E.M. of 20 separate cells. *P<0.05
Figure 4
Figure 4
TRPC channel inhibitors attenuate the increase intracellular calcium in autophagy induces cells. (a) Representative traces showing the transient increase in [Ca2+]i after the addition of 1 mM calcium in the presence of 50 μM 2APB to SHSY-5Y cells pretreated with 1 mM DMOG. Bar diagram shows the [Ca2+]i in nM concentration of the above-mentioned experiment. Each bar gives the mean±S.E.M. of 50 separate experiments. e **P<0.01 and ***P<0.001. (b) Representative traces showing the transient increase in [Ca2+]i after the addition of 1 mM calcium in the presence of 10 μM SKF to SHSY-5Y cells pretreated with 1 mM DMOG. Bar diagram shows the [Ca2+]i in nM concentration of the above-mentioned experiment. Each bar gives the mean±S.E.M. of 50 separate experiments. **P<0.01 and ***P<0.001. (c) Bar diagram showing the cell viability assay (MTT assay) in the SHSY-5Y cells, pretreated with 1 mM DMOG in the presence of 10 μM SKF. Each bar gives the mean±S.E.M. of four separate experiments. **P<0.01 and ***P<0.001. (d) Western blot images showing the expression of LC3A, caspase 3 in SHSY-5Y cells pretreated with 1 mM DMOG and 10 μM SKF. Confocal image of HSG (e) and SH-SY5Y (f) cells transfected with GFP-LC3 and treated with 200 μM DFO or 200 μM DMOG and 10 μM SKF
Figure 5
Figure 5
Increases in TRPC1 expression and currents in autophagy-induced HSG and SHSY-5Y cells. (a and b) Application of 1 μM Tg in bath solution induced inward currents at −80 mV in control, 1 mM DMOG-, and 1 mM DFO-treated cells. (c and d) Respectively IV curves under these conditions are shown in c and quantitation (8–10 recordings) of current intensity at −80 mV is shown in d, *P=<0.05. (e) IV curves of currents induced by the application of 1 μM Tg in standard external Ringer's solution and Na-based DVF external solutions. (f) Bath application of 1 μM Tg in bath solution induced in salivary gland cells and relative IV curves. (g) Average (8–10 recordings) current intensity at −80 mV under these conditions is shown, *P=<0.05. (h) Represents western blot images showing the expression of SOCE components, STIM1, Orai1, and TRPC1 in HSG and SHSY-5Y cells pretreated with 1 mM DMOG and 1 mM DFO for 24 h. Corresponding densitometric reading of the protein is shown as a bar diagram (i). Each bar gives the mean±S.E.M. of four separate experiments. *P<0.05, **P<0.01, and ***P<0.001. (j) Western blot images showing the expression of TRPC1 in primary salivary gland cells isolated from control and hypoxia-induced mice models. Bar diagram representing the densitometric reading of the TRPC1 in the above-mentioned western blots. Each bar gives the mean±S.E.M. of four separate experiments. (k) Western blot images showing the relative surface expression of TRPC1 obtained from cell surface biotinylation. Bar diagram shows the normalized expression of TRPC1 to the expression of cell surface transferrin receptor (TfR) protein. Each bar gives the mean±S.E.M. of three separate experiments
Figure 6
Figure 6
Knockdown of TRPC1 attenuated the autophagy-induced intracellular calcium increase and also affects the cell viability. Western blot images showing the knockdown of TRPC1 using siRNA, HSG cells (a) (70% knockdown, n=3, P<0.01), and SHSY-5Y cells (b) (72% knockdown, n=3, p<0.001). Representative traces showing the transient increase in [Ca2+]i after the addition of 1 mM calcium to siRNA TRPC1 knockdown HSG cells (a) and in SHSY-5Y cells (b) pretreated with 1 mM DMOG or in serum-free media. Bar diagram (c and d) shows the [Ca2+]i in nM concentration of the above-mentioned experiment. Each bar gives the mean±S.E.M. of 40 separate cells. *P<0.05 and ***P<0.001. (e) Bar diagram showing the cell viability assay (MTT assay) in the TRPC1 knockdown SHSY-5Y cells, pretreated with 1 mM DMOG or 1 mM DFO or in serum-free media. Each bar gives the mean±S.E.M. of four separate experiments. **P<0.01. (f) Western blot images showing the expression of autophagy marker beclin-1 in HSG and SHSY-5Y cells pretreated with 1 mM DMOG or in serum-free media for 24 h. (g) Western blot image showing the TRPC3 knockdown using siRNA in SHSY-5Y cells (60% knockdown, n=3, P<0.01). Application of 50 μM OAG in bath solution induced inward currents at −80 mV in control and TRPC3 knockout cells. (h) Under DFO treatment, respectively IV curves of currents induced by the application of 1 μM Tg in control and TRPC3 knockout cells treated with 1 mM DFO. The traces are representative of average (8–10 recordings) of current intensity at −80 mV. (i) Western blot images showing the expression of LC3A in siTRPC3 SHSY-5Y cells with and without 24 h pretreatment with 1 mM DFO (n=3, P<0.05)
Figure 7
Figure 7
Pretreatment with autophagy inhibitor 3-methyladenine (3-MA) attenuated the intracellular calcium influx and induces apoptosis. (a) Western blot images showing the expression of SOCE components STIM1, TRPC1, and Orai1, autophagy marker beclin-1 and loading control actin in HSG and SHSY-5Y cells pretreated with 1 mM DMOG or in serum-free media in the presence of 1 mM autophagy marker 3-MA for 24 h. (b) Representative traces showing the transient increase in [Ca2+]i after the addition of 1 mM calcium in the presence of 1 mM 3-MA to SHSY-5Y cells pretreated with 1 mM DMOG or in serum-free media. (c) Bar diagram shows the [Ca2+]i in nM concentration of the above-mentioned experiment. Each bar gives the mean±S.E.M. of 50 separate experiments. *P<0.05, **P<0.01. (d) Bar diagram showing the cell viability assay (MTT assay) in the SH-SY5Y cells, pretreated with 1 mM DMOG in the presence of 1 mM. Each bar gives the mean±S.E.M. of four separate experiments. ***P<0.001. (e) Application of 1 μM Tg in bath solution induced inward currents at −80 mV in control, cells treated in serum-free media and autophagy inhibitor 3-MA-treated cells. (f) Average (8–10) recordings current intensity at −80 mV are shown, *P<0.05

Similar articles

Cited by

References

    1. Kato M, Ospelt C, Gay RE, Gay S, Klein K. Dual role of autophagy in stress-induced cell death in rheumatoid arthritis synovial fibroblasts. Arthritis Rheumatol. 2014;66:40–48. - PubMed
    1. Murrow L, Debnath J. Autophagy as a stress-response and quality-control mechanism: implications for cell injury and human disease. Annu Rev Pathol. 2013;8:105–137. - PMC - PubMed
    1. Zhang Y, Calderwood SK. Autophagy, protein aggregation and hyperthermia: a mini-review. Int J Hyperthermia. 2011;27:409–414. - PMC - PubMed
    1. Smaili SS, Pereira GJS, Costa MM, Rocha KK, Rodrigues L, do Carmo LG, et al. The role of calcium stores in apoptosis and autophagy. Curr Mol Med. 2013;13:252–265. - PubMed
    1. Ouyang L, Shi Z, Zhao S, Wang FT, Zhou TT, Liu B, et al. Programmed cell death pathways in cancer: a review of apoptosis, autophagy and programmed necrosis. Cell Prolif. 2012;45:487–498. - PMC - PubMed

Publication types

Substances

LinkOut - more resources