. 2015 Mar 12;519(7542):181-6.
doi: 10.1038/nature14279. Epub 2015 Feb 25.

Quantitative evolutionary dynamics using high-resolution lineage tracking

Affiliations

Quantitative evolutionary dynamics using high-resolution lineage tracking

Sasha F Levy et al. Nature. .

Abstract

Evolution of large asexual cell populations underlies ∼30% of deaths worldwide, including those caused by bacteria, fungi, parasites, and cancer. However, the dynamics underlying these evolutionary processes remain poorly understood because they involve many competing beneficial lineages, most of which never rise above extremely low frequencies in the population. To observe these normally hidden evolutionary dynamics, we constructed a sequencing-based ultra high-resolution lineage tracking system in Saccharomyces cerevisiae that allowed us to monitor the relative frequencies of ∼500,000 lineages simultaneously. In contrast to some expectations, we found that the spectrum of fitness effects of beneficial mutations is neither exponential nor monotonic. Early adaptation is a predictable consequence of this spectrum and is strikingly reproducible, but the initial small-effect mutations are soon outcompeted by rarer large-effect mutations that result in variability between replicates. These results suggest that early evolutionary dynamics may be deterministic for a period of time before stochastic effects become important.


Figures

Extended Data Figure 1
Extended Data Figure 1. Total population size over time
A single ancestral cell is grown for ~32 generations to ~1010 cells before barcodes are inserted. Cells that incorporate a barcode are grown for another 16 generations. The population is then divided into two replicates (E1 and E2) at t=0. Beneficial mutations that occurred prior to barcoding can be sampled into both replicates.
Extended Data Figure 2
Extended Data Figure 2. Inferring the fitnesses and establishment times from lineage trajectories
(a) Selected lineage trajectories and the mean fitness trajectory from replicate E2. (b) The distribution of lineage sizes over time, for lineages that begin with ~100+/− 2 cells (vertical line). Adaptive lineages (red) begin to expand above the neutral expectation (black curve) and push neutral lineages to lower cell numbers (blue). (c) The posterior probability distribution over s and τ for an adaptive lineage in E2 (d) The measured trajectory of this lineage in E1 (unadaptive, blue circles) and E2 (adaptive, red circles) compared with the predicted trajectory with largest probability in E1 (blue line) and E2 (red line).
Extended Data Figure 3
Extended Data Figure 3. Fitness effects and establishment times for replicate E2
(a) Scatter plot of τ and s of all ~14,000 beneficial mutations (circles) identified in E2. Circle area represents the size of the lineage at generation 88. Purple circles indicate lineages with mutations that occurred in the period of common growth (t < 0) that were sampled into, and established in, E1 and E2. Green circles indicate lineages that were identified as adaptive in only one replicate and likely contain mutations that arose after t=0. Lines indicate the time limits before which mutations must occur in order to establish (large dash) or be observed (small dash). These limits trail the mean fitness (solid line) by ~1/s generations. (Inset) The spectrum of mutation rates, µ(s), as a function of fitness effect, s inferred from mutations that likely occurred after t=0 (SM 10.2). The y-axis is the mutation rate density, so the mutation rate to a range, Δs, is obtained by multiplying this by Δs. The total beneficial mutation rate to s>5% is inferred to be ~1 × 10⁻⁶ and is consistent across replicates. The observed spectrum is not exponential (gray line, with the error range shaded) (b) The distribution of the number of adaptive cells binned by their fitness over time. As the mean fitness (grey curtain) surpasses the fitness of a subpopulation, cells with that fitness begin to decline in frequency.
Figure 1
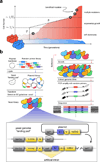
Figure 1
(a) Typical lineage trajectories. A small lineage that does not acquire a beneficial mutation (neutral, blue) will fluctuate in size due to drift before eventually being outcompeted. Rarely, a lineage will acquire a beneficial mutation (star) with a fitness effect of s (adaptive, red). In most cases, this beneficial mutation is lost to drift. If the beneficial mutants drift to a size >~1/s (lower dotted horizontal line), the lineage will begin to grow exponentially at a rate s. Extrapolating the exponential growth to the time at which the mutation is inferred to have reach a size ~1/s yields the establishment time (τ, dashed vertical line) which roughly corresponds to the time when the mutation occurred with an uncertainty of ~1/s. At sizes > ~1/Ub (upper dotted horizontal line), where Ub is the total beneficial mutation rate, the lineage will acquire additional beneficial mutations. (b) Lineage tracking with random barcodes. Left. Sequences containing random 20 nucleotide barcodes (colors) are inserted first into a plasmid and then into a specific location in the genome. Bottom. Recombination between two partially crippled loxP sites (loxP*) integrates the plasmid into the genome and completes a URA3 selectable marker, resulting in one functional and one crippled loxP site (loxP**). The URA3 marker is interrupted by an artificial intron containing the barcode. Right. To measure relative fitness, cells are passed through growth-bottleneck cycles of ~8 generations. Before each bottleneck, genomic DNA is extracted, lineage barcode tags are amplified using a two-step PCR protocol, and amplicons are sequenced. By inserting unique molecular identifiers (also short random barcodes, grey bars) in early cycles of the PCR, PCR duplicates of the same template molecule (purple) are detected,.
Figure 2
Figure 2. Inferring the fitnesses and establishment times from lineage trajectories
(a) Selected lineage trajectories from E1 colored according to the probability that they contain an established beneficial mutation. The decline of adaptive lineages at later times is caused by the increase of the population mean fitness (Inset). The population mean fitness is inferred from both the decline of neutral lineages (blue circles) and the growth of beneficial lineages (red line, SM 6.2). Shading indicates the error in mean fitness. The inferred fitnesses (b) and establishment times (c) from analysis of simulated trajectories correlate strongly with the known simulated values. (d) Scatter plot of the fitness of 33 clones picked from E2 at generation 88 inferred by sequencing and pairwise competition (coloring as in (a), with outliers lightened and excluded from correlation). Error bars are 1 standard deviation.
Figure 3
Figure 3. Fitness effects, establishment times, and population dynamics
(a) Scatter plot of τ and s of all ~25,000 beneficial mutations (circles) identified in E1. Circle area represents the size of the lineage at generation 88. Purple circles indicate lineages with mutations that occurred in the period of common growth (t < 0) that were sampled into, and established in, E1 and E2. Green circles indicate lineages that were identified as adaptive in only one replicate and likely contain mutations that arose after t=0. Lines indicate the time limits before which mutations must occur in order to establish (large dash) or be observed (small dash). These limits trail the mean fitness (solid line) by ~1/s generations. (Inset) The spectrum of mutation rates, µ(s), as a function of fitness effect, s inferred from mutations that likely occurred after t=0 (SM 10.2). The y-axis is the mutation rate density, so the mutation rate to a range, Δs, is obtained by multiplying this by Δs. The total beneficial mutation rate to s>5% is inferred to be ~1 × 10⁻⁶ and is consistent across replicates. The observed spectrum is not exponential (gray line, with the error range shaded) (b) The distribution of the number of adaptive cells binned by their fitness over time. As the mean fitness (grey curtain) surpasses the fitness of a subpopulation, cells with that fitness begin to decline in frequency.
Figure 4
Figure 4. The need for high frequency resolution
The fitness spectrum of adaptive lineages that could be identified at different frequency resolution thresholds.

Comment in

Similar articles

Cited by

References

    1. Kvitek DJ, Sherlock G. Whole genome, whole population sequencing reveals that loss of signaling networks is the major adaptive strategy in a constant environment. PLoS Genet. 2013;9:e1003972. - PMC - PubMed
    1. Herron MD, Doebeli M. Parallel evolutionary dynamics of adaptive diversification in Escherichia coli. PLoS Biol. 2013;11:e1001490. - PMC - PubMed
    1. Lang GI, et al. Pervasive genetic hitchhiking and clonal interference in forty evolving yeast populations. Nature. 2013;500:571–574. - PMC - PubMed
    1. Lang GI, Botstein D, Desai MM. Genetic variation and the fate of beneficial mutations in asexual populations. Genetics. 2011;188:647–661. - PMC - PubMed
    1. Ding L, et al. Genome remodelling in a basal-like breast cancer metastasis and xenograft. Nature. 2010;464:999–1005. - PMC - PubMed

Publication types