. 2015 Apr;18(4):521-530.
doi: 10.1038/nn.3966. Epub 2015 Mar 2.

GLUT1 reductions exacerbate Alzheimer's disease vasculo-neuronal dysfunction and degeneration

Affiliations

GLUT1 reductions exacerbate Alzheimer's disease vasculo-neuronal dysfunction and degeneration

Ethan A Winkler et al. Nat Neurosci. 2015 Apr.

Abstract

The glucose transporter GLUT1 at the blood-brain barrier (BBB) mediates glucose transport into the brain. Alzheimer's disease is characterized by early reductions in glucose transport associated with diminished GLUT1 expression at the BBB. Whether GLUT1 reduction influences disease pathogenesis remains, however, elusive. Here we show that GLUT1 deficiency in mice overexpressing amyloid β-peptide (Aβ) precursor protein leads to early cerebral microvascular degeneration, blood flow reductions and dysregulation and BBB breakdown, and to accelerated amyloid β-peptide (Aβ) pathology, reduced Aβ clearance, diminished neuronal activity, behavioral deficits, and progressive neuronal loss and neurodegeneration that develop after initial cerebrovascular degenerative changes. We also show that GLUT1 deficiency in endothelium, but not in astrocytes, initiates the vascular phenotype as shown by BBB breakdown. Thus, reduced BBB GLUT1 expression worsens Alzheimer's disease cerebrovascular degeneration, neuropathology and cognitive function, suggesting that GLUT1 may represent a therapeutic target for Alzheimer's disease vasculo-neuronal dysfunction and degeneration.


Figures
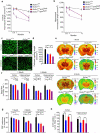
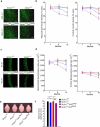
Figure 1
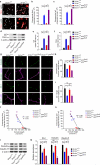
Figure 1. Microvascular and cerebral blood flow reductions and diminished glucose uptake in GLUT1-deficient APPSw/0 mice
(a-b) Quantification of lectin-positive microvascular profiles in cortex (b) and hippocampus (b) in 2-week, 1- and 6-month old Slc2a1+/+, Slc2a1+/−, Slc2a1+/+APPSw/0 and Slc2a1+/−APPSw/0 mice. Mean ± SEM, n=3-6 mice per group; *p<0.05. (c-d) Representative in vivo multiphoton fluorescent angiograms obtained following intravascular injection of fluorescein-conjugated dextran (MW: 70 kDa) (c) and quantification of perfused microvascular length (d) in 6-month-old Slc2a1+/+, Slc2a1+/−, Slc2a1+/+APPSw/0 and Slc2a1+/−APPSw/0 mice. Scale bar, 50 μm. Mean ± SEM, n=3-4 mice per group; *p<0.05 or **p<0.01 (e-f) Representative C14-iodoantipyrine (C14-IAP) autoradiography (e) and quantification of C14-IAP autoradiograms measuring regional blood flow in the somatosensory cortex and CA1 hippocampal subfield (f) in 1- and 6-month-old Slc2a1+/+, Slc2a1+/−, Slc2a1+/+APPSw/0 and Slc2a1+/−APPSw/0 mice. Scale bar, 1 mm. Mean ± SEM, n=3-5 mice per group; *p<0.05 or **p<0.01. (g) Cerebral blood flow (CBF) responses to brain activation in the somatosensory cortex of 1-month, 6-month and 16-month old Slc2a1+/+, Slc2a1+/−, Slc2a1+/+APPSw/0 and Slc2a1+/−APPSw/0 mice. (h) Quantification of C14-2-deoxyglucose (2-DG) autoradiograms measuring regional glucose uptake in the somatosensory cortex and CA1 hippocampal subfield in 2-3 week-old Slc2a1+/+, Slc2a1+/−, Slc2a1+/+APPSw/0 and Slc2a1+/−APPSw/0 mice. Mean ± SEM, n=5-7 mice per group in a, b, d, f and g; and n=3 mice per group in h; *p<0.05 or **p<0.01.
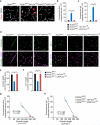
Figure 2
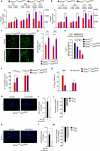
Figure 2. GLUT1 deficiency leads to early BBB breakdown in Slc2a1+/− and Slc2a1+/−APPSw/0 mice
(a) Representative confocal microscopy analysis of fibrin (red) and lectin-positive capillaries (white) in 2-week-old Slc2a1+/+,Slc2a1+/−, Slc2a1+/+APPSw/0 and Slc2a1+/−APPSw/0 mice. Scale bar, 25 μm. (b-c) Quantification of extravascular fibrin (b) and immunoglobulin G (IgG) (c) deposits in 2-week old Slc2a1+/+, Slc2a1+/−, Slc2a1+/+APPSw/0 and Slc2a1+/−APPSw/0 mice. Mean ± SEM, n=3-5 mice per group; *p<0.05 or **p<0.01. (d-f) Representative immunoblotting of fibrin and IgG levels in capillary-depleted brain tissue (d) and quantification of IgG (e) and fibrin (f) relative abundance in capillary-depleted brains in 2-week-old Slc2a1+/+, Slc2a1+/−, Slc2a1+/+APPSw/0 and Slc2a1+/−APPSw/0 mice. β-actin was used as a loading control. Mean ± SEM, n=3-5 mice per group; **p<0.01. (g-i) The tight junction proteins occludin or zonula occludens-1 (ZO-1) (green) and lectin-positive capillary profiles (red) (g) and quantification of endothelial occludin (h) and ZO-1 (i) length in the microvessels in 2-week-old Slc2a1+/+, Slc2a1+/−, Slc2a1+/+APPSw/0 and Slc2a1+/−APPSw/0 mouse hippocampus. Scale bar, 25 μm. Mean ± SEM, n=3-5 mice per group; *p<0.05 or **p<0.01. (j-k) Negative correlation between the extracellular fibrin (j) or IgG deposits (k) and decreased occludin length in the microvessels in 2-week-old Slc2a1+/+, Slc2a1+/−, Slc2a1+/+APPSw/0 and Slc2a1+/−APPSw/0 mouse hippocampus. (l) Representative immunoblotting analysis of microvascular ZO-1, occludin and claudin-5 (l) and their respective protein abundance in microvessels (m) in a 2-week-old Slc2a1+/+, Slc2a1+/−, Slc2a1+/+APPSw/0 and Slc2a1+/−APPSw/0 mouse. β-actin was used as loading control. Mean ± SEM, n=3-5 mice per group; *p<0.05 or **p<0.01. Full length blots are presented in Supplementary Figure 11.
Figure 3
Figure 3. Aβ pathology in GLUT1-deficient APPSw/0 mice and reversal by LRP1 and GLUT1 re-expression
(a-b) Cortical and hippocampal Aβ40 (a) and Aβ42 (b) levels in 1-, 6- and 16-month old Slc2a1+/+APPSw/0 and Slc2a1+/−APPSw/0 mice. Mean ± SEM, n=3-6 mice per group; *p<0.05 or **p<0.01. (c-d) Aβ-immunodetection (green) in the somatosensory cortex and CA1 hippocampal subfield (c) and Aβ load (d) in 16-month old Slc2a1+/+APPSw/0 and Slc2a1+/−APPSw/0 mice. Scale bar, 200 μm. Mean ± SEM, n=4-5 mice per group; *p<0.01. (e) Immunoblotting for the low-density lipoprotein receptor-related protein 1 (LRP1) in isolated microvessels (upper panel) and quantification (lower panel) in 16-month-old Slc2a1+/+, Slc2a1+/−, Slc2a1+/+APPSw/0 and Slc2a1+/−APPSw/0 mice. Mean ± SEM, n=4 mice per group; *p<0.05 or **p<0.01. (f) Clearance of [125I]-labeled human synthetic Aβ40 from CA1 hippocampal subfield in 16-month-old Slc2a1+/+APPSw/0 and Slc2a1+/−APPSw/0 mice. [14C]inulin was used to assess brain interstitial fluid (ISF) bulk flow. Time, 30 minutes post-injection. Mean ± SEM, n=3-5 mice per group; *p<0.05. (g) [125I]-Aβ40 clearance via BBB and ISF bulk flow (from the data shown in f). (h-i) Aβ-immunodetection (green) in CA1 hippocampal subfield (h) and quantification of Aβ-positive area (i) in 10-month-old Slc2a1+/−APPSw/0 mouse injected with empty adenovirus (Ad.Ctrl) and adenovirus carrying LRP1 minigene (Ad.mLRP1). Black, Ad.Ctrl hippocampus; White, Ad.mLRP1 hippocampus. Scale bar, 300 μm. Mean ± SEM, n=3 mice; **p<0.01. (j) CA1 hippocampal guanidine soluble Aβ40 (black) and Aβ42 (grey) levels in 10-month old Slc2a1+/−APPSw/0 mice injected with Ad.Ctrl and Ad.mLRP1. Graph - percent change of Ad.mLRP1 hippocampus to Ad.Ctrl hippocampus. Mean ± SEM, n=3 mice per group; *p<0.05. (k-m) Aβ-immunodetection (green) in CA1 hippocampal subfield (k) and quantification of Aβ-positive area (l) in 8-10-month-old Slc2a1+/−APPSw/0 mouse injected with empty adenovirus (Ad.Ctrl) and adenovirus carrying Slc2a1 gene (Ad.Slc2a1). Black, Ad.Ctrl hippocampus; White, Ad.Slc2a1 hippocampus. Scale bar, 300 μm. Mean ± SEM, n=3 mice; *p<0.05. (m) CA1 hippocampal guanidine soluble Aβ40 (black) and Aβ42 (grey) levels in 8-10-month-old Slc2a1+/−APPSw/0 mice injected with Ad.Ctrl and Ad.Slc2a1. Graph - percent change of Ad.Slc2a1 hippocampus to Ad.Ctrl hippocampus. Mean ± SEM, n=3 mice; *p<0.05. Full length blots are presented in Supplementary Figure 11.
Figure 4
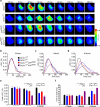
Figure 4. Neuronal dysfunction in GLUT1-deficient APPSw/0 mice
(a) Representative time-lapse-imaging analysis of voltage sensitive dye (VSD) signal response to hind-limb somatosensory cortex stimulation in 6-month-old Slc2a1+/+, Slc2a1+/−, Slc2a1+/+APPSw/0 and Slc2a1+/−APPSw/0 mice. Scale bar, 500 μm. (b-d) Quantitative time-lapse-imaging profile analysis of VSD response to hind-limb somatosensory cortex stimulation in 2-week-old (b), 1-month-old (c) and 6-month-old (d) Slc2a1+/+, Slc2a1+/−, Slc2a1+/+APPSw/0 and Slc2a1+/−APPSw/0 mice. ΔF/F0 indicates the percentage change in fluorescence from the baseline fluorescent signal following stimulation. (e-f) Quantification of peak fluorescent VSD signal amplitude (e) and time-to-peak latency (f) in 2-week-old, 1-month-old and 6-month-old Slc2a1+/+, Slc2a1+/−, Slc2a1+/+APPSw/0 and Slc2a1+/−APPSw/0 mice. Mean ± SEM, n=3-4 mice per group; *p<0.05 or **p<0.01.
Figure 5
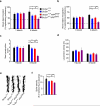
Figure 5. Accelerated cognitive impairment in GLUT1-deficient APPSw/0 mice
(a-c) Quantification of exploratory preference measuring hippocampal-dependent novel object location memory (a), novel object recognition memory (b), nest construction score (c) and mean locomotor activity (d) in 1- and 6-month-old Slc2a1+/+, Slc2a1+/−, Slc2a1+/+APPSw/0 and Slc2a1+/−APPSw/0 mice. Mean ± SEM, n=9-15 mice per group; *p<0.05 or **p<0.01. (e) Representative high-magnification bright-field microscopy microscopy analysis of Golgi-Cox staining showing dendritic spine density in the CA1 hippocampal region of 6-month-old Slc2a1+/+, Slc2a1+/−, Slc2a1+/+APPSw/0 and Slc2a1+/−APPSw/0 mice. (f) Quantification of dendritic spine density in 6-month-old Slc2a1+/+, Slc2a1+/−, Slc2a1+/+APPSw/0 and Slc2a1+/−APPSw/0 mice. Mean ± SEM, n=3-5 mice per group; *p<0.05 or **p<0.01.
Figure 6
Figure 6. Accelerated neurodegenerative changes in GLUT1-deficient APPSw/0 mice
(a) SMI-311 immunodetection showing neurites (green) in the CA1 hippocampal region of 16-month-old Slc2a1+/+, Slc2a1+/−, Slc2a1+/+APPSw/0 and Slc2a1+/−APPSw/0 mice. Scale bar, 50 μm. (b) Quantification of SMI-311-positive neuritic density in somatosensory cortex and CA1 hippocampal subfield in 1-, 6- and 16-month-old Slc2a1+/+, Slc2a1+/−, Slc2a1+/+APPSw/0 and Slc2a1+/−APPSw/0 mice. Scale bar, 50 μm. Mean ± SEM, n=3-4 mice per group; *p<0.05 or **p<0.01. (c) NeuN-positive neurons (green) in the CA1 hippocampal subfield of 16-month-old Slc2a1+/+, Slc2a1+/−, Slc2a1+/+APPSw/0 and Slc2a1+/−APPSw/0 mice. (d) Quantification of the number of NeuN-positive neurons in somatosensory cortex and CA1 hippocampal subfield in 1-, 6- and 16-month-old Slc2a1+/+, Slc2a1+/−, Slc2a1+/+APPSw/0 and Slc2a1+/−APPSw/0 mice. Mean ± SEM, n=3-6 mice per group; *p<0.05 or **p<0.01. (e-f) Representative low-magnification bright-field microscopy of mouse brains (e) and quantification of maximal brain diameter (f) in 6-month-old Slc2a1+/+, Slc2a1+/−, Slc2a1+/+APPSw/0 and Slc2a1+/−APPSw/0 mice. Scale bar, 5 mm. Mean ± SEM, n=5-6 mice per group; *p<0.05 or **p<0.01.
Figure 7
Figure 7. GLUT1 deficiency in endothelial cells (Slc2a1lox/+Tie2-Cre+/0 mice), but not astrocytes (Slc2a1lox/+GFAP-Cre+/0 mice) leads to early BBB breakdown
(a) Representative confocal microscopy analysis of plasma-derived fibrin (red) and CD31-positive capillaries (white) in 2-week-old Slc2a1lox/+, Slc2a1lox/+Tie2-Cre+/0, Slc2a1lox/+GFAP-Cre+/0 mice. Scale bar, 25 μm. (b-c) Quantification of extravascular fibrin (b) and IgG (c) positive deposits in 2-week old Slc2a1lox/+, Slc2a1lox/+Tie2-Cre+/0, Slc2a1lox/+GFAP-Cre+/0 mice. Mean ± SEM, n=3-5 mice per group; *p<0.05 or **p<0.01. (d) Representative confocal microscopy analysis of the tight junction proteins occludin or zonula occludens-1 (ZO-1) (green) and CD31-positive capillary profiles. (e-f) Quantification of endothelial occludin (e) and ZO-1 (f) tight junctional length in the microvessels in 2-week-old Slc2a1lox/+, Slc2a1lox/+Tie2-Cre+/0, Slc2a1lox/+GFAP-Cre+/0 mice. Scale bar, 25 μm. Mean ± SEM, n=3-5 mice per group; *p<0.05 or **p<0.01. (g-h) Negative correlation between extracellular fibrin (g) or IgG deposits (h) and decreased occludin length in the microvessels in 2-week-old Slc2a1lox/+, Slc2a1lox/+Tie2-Cre+/0, Slc2a1lox/+GFAP-Cre+/0 mice.

Comment in

Similar articles

Cited by

References

    1. Zlokovic BV. The blood-brain barrier in health and chronic neurodegenerative disorders. Neuron. 2008;57:178–201. - PubMed
    1. Zlokovic BV. Neurovascular pathways to neurodegeneration in Alzheimer's disease and other disorders. Nat. Rev. Neurosci. 2011;12:723–738. - PMC - PubMed
    1. Simpson IA, Carruthers A, Vannucci SJ. Supply and demand in cerebral energy metabolism: the role of nutrient transporters. J. Cereb. Blood Flow Metab. Off. J. Int. Soc. Cereb. Blood Flow Metab. 2007;27:1766–1791. - PMC - PubMed
    1. Deng D, et al. Crystal structure of the human glucose transporter GLUT1. Nature. 2014;510:121–125. - PubMed
    1. Allen A, Messier C. Plastic changes in the astrocyte GLUT1 glucose transporter and beta-tubulin microtubule protein following voluntary exercise in mice. Behav. Brain Res. 2013;240:95–102. - PubMed

Publication types

MeSH terms

Substances