. 2015 Feb 26;160(5):842-855.
doi: 10.1016/j.cell.2015.02.004.

Neuronal CRTC-1 governs systemic mitochondrial metabolism and lifespan via a catecholamine signal

Affiliations

Neuronal CRTC-1 governs systemic mitochondrial metabolism and lifespan via a catecholamine signal

Kristopher Burkewitz et al. Cell. .

Abstract

Low energy states delay aging in multiple species, yet mechanisms coordinating energetics and longevity across tissues remain poorly defined. The conserved energy sensor AMP-activated protein kinase (AMPK) and its corresponding phosphatase calcineurin modulate longevity via the CREB regulated transcriptional coactivator (CRTC)-1 in C. elegans. We show that CRTC-1 specifically uncouples AMPK/calcineurin-mediated effects on lifespan from pleiotropic side effects by reprogramming mitochondrial and metabolic function. This pro-longevity metabolic state is regulated cell nonautonomously by CRTC-1 in the nervous system. Neuronal CRTC-1/CREB regulates peripheral metabolism antagonistically with the functional PPARα ortholog, NHR-49, drives mitochondrial fragmentation in distal tissues, and suppresses the effects of AMPK on systemic mitochondrial metabolism and longevity via a cell-nonautonomous catecholamine signal. These results demonstrate that while both local and distal mechanisms combine to modulate aging, distal regulation overrides local contribution. Targeting central perception of energetic state is therefore a potential strategy to promote healthy aging.


Figures

Figure 1
Figure 1. CRTC-1 uncouples AMPK-mediated longevity from other pleiotropic phenotypes
(A) AMPK activation (CA-AAK-2) extends lifespan in a wild type C. elegans background. See Table S1 for lifespan statistics. (B) CA-AAK-2 suppresses growth. Image of 5 wild type (left) and 5 CA-AAK-2 (right) adult worms. (C) Eggs laid per worm over successive 12 h periods. Data are mean ± SD for n=25-30 animals; * denotes p<10−4 via t-test. (D) CA-AAK-2 fails to promote longevity in a CRTC-1S76A,S179A mutant background. (E) CRTC-1S76A,S179A does not suppress AMPK-mediated effects on growth. (F) Eggs laid per worm over successive 12 h periods (data are mean ± SD for n=19–30 animals; * denotes p<10−4 via t-test. (G and H) Survival curves of AMPK and CRTC-1S76A,S179A transgenic animals exposed to heat stress at 33°C. N=60-100 worms. p<10−5 via Log-rank (Mantel-Cox) analysis. (I) CRTC-1 is a longevity-specific AMPK target that uncouples growth, reproduction, and stress resistance from lifespan extension.
Figure 2
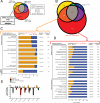
Figure 2. Leveraging CRTC-1 to identify longevity-specific processes downstream of AMPK reveals a critical role for mitochondrial metabolism
(A) Schematic Venn diagram illustrating how CRTC-1-specific gene expression filters AMPK-induced changes associated with longevity from those involved in other pleiotropic phenotypes. (B) Venn diagram representing the number of differentially expressed (DE) genes identified through RNA-Seq analysis from each indicated genetic background relative to wild type controls. See Table S2 for complete list of DE genes. (C and D) Clusters of enriched GO biological processes and cell compartments among the DE genes involved in CRTC-1 independent phenotypes (C, orange) or unique to the CRTC-1S76A,S179A; CA-AAK-2 worms (D, red). Bars represent the percentage of genes within that category that are up- (orange) or downregulated (blue). The number of genes annotated within a cluster is tabulated, along with the smallest multiple-testing corrected p-value for the observed enrichment attributed to a term within the cluster. See also Figure S2 and Table S3. (E) Metabolomic analyses of transgenic strains to measure levels of organic acids (E), acylcarnitines, and amino acids (Figure S2). Two-way ANOVAs were performed with a Sidak multiple comparisons test after metabolite levels were normalized to total protein. Data are mean ± SEM of n=2-5 replicates per metabolite in each group. ap≤0.05 vs. CA-AAK2, bp≤0.05 vs. CRTC-1S76A,S179A, cp≤0.05 vs. CRTC-1S76A,S179A; CA-AAK-2. See also Table S4.
Figure 3
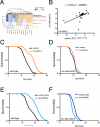
Figure 3. NHR-49 is required for AMPK- and calcineurin-mediated longevity
(A) Heat map of genes differentially expressed in CRTC-1S76A,S179A; CA-AAK-2 and nhr-49(nr2041) worms, demonstrating significant overlap in gene expression patterns. See also Table S5. (B) Mean mRNA expression levels (average log2 of fold change relative to wild type worms) of 29 metabolic genes. In a CA-AAK-2 background, native CRTC-1S76A,S179A (crtc-1 promoter) correlates with whole-organism loss of NHR-49 (Pearson correlation coefficient, r), validating the comparison made in (A). Note r=0.66; p≤0.0001 after 10% winsorization of strong outliers. See Table S6. (C and D) CA-AAK-2 extends lifespan in a wild type background (C), but not in the absence of NHR-49 function (D). See Table S1 for lifespan statistics. (E and F) tax-6 RNAi extends lifespan in a wild type background (E), but not in the absence of NHR-49 function (F). The genetic background in B – F is noted next to the origin.
Figure 4
Figure 4. Neuronal CRTC-1/CRH-1 activation suppresses longevity downstream of AMPK and calcineurin signaling and cell-nonautonomously regulates metabolic transcription
(A) tax-6 RNAi increases longevity. See Table S1 for lifespan statistics. The genetic background in A – I is noted next to the origin. (B) Intestine-specific CRTC-1S76A,S179A (ges-1 promoter) fails to suppress tax-6 RNAi longevity. Inset: image of intestine-specific tdTOMATO-tagged CRTC-1S76A,S179A; scale bar = 100 μm. (C) Neuronal-specific (rab-3 promoter) CRTC-1S76A,S179A fully suppresses tax-6 RNAi-mediated longevity. Inset: image of neuron-specific tdTOMATO-tagged CRTC-1S76A,S179A; scale bar = 100 μm. (D and E) CA-AAK-2 extends lifespan in a wild type background (D), but neuronal CRTC-1S76A,S179A suppresses AMPK-mediated longevity (E). (F and G) CA-AAK-2 extends lifespan and this effect is blocked by expressing CRTC-1S76A,S179A from its native promoter (F). In crh-1 null mutants, CRTC-1 activation fails to suppress AMPK-mediated longevity (G). (H and I) Neuron-specific activation of CRTC-1 S76A,S179A suppresses longevity mediated by tax-6 RNAi (H), but neuronal CRTC-1S76A,S179A requires intact crh-1 function to mediate its effects on aging (I). (J and K) Expression levels of 29 metabolic genes in CA-AAK-2 animals reveal that the effects of neuron-specific CRTC-1S76A,S179A correlate strongly with expression of CRTC-1S76A,S179A from its native promoter (J); and neuron-specific CRTC-1S76A,S179A activation correlates with the transcriptional effects of loss of NHR-49 function (K). r and p values were derived by Pearson correlation. See also Table S6. (L) Dendrogram summarizing similarities in metabolic gene expression between AMPK, CRTC-1 and NHR-49 mutants. Strains were clustered by their pair-wise Pearson correlations using Ward's minimum variance method. Vertical heights of branches indicate the degree of correlation (r; y-axis). Multiscale bootstrap resampling p values on each branch were calculated via pvclust R package [http://www.sigmath.es.osaka-u.ac.jp/shimo-lab/prog/pvclust/].
Figure 5
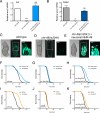
Figure 5. NHR-49 regulates mitochondrial metabolism and longevity cell-nonautonomously from neurons
(A and B) Analysis of acs-2 transcript levels by RT-PCR in L4/young adult worms fed (A) and fasted 16 h (B). Data are mean ± SEM of 3-4 independent experiments. By 1-sample (A) or 2-sample (B) t-test relative to fed wild type animals, *** denotes p<0.001; ** = p<0.01; ns = p> 0.05). (CE) Brightfield (left) and fluorescence (middle and right panels) imaging of L4-stage 16 h fasted worms expressing GFP driven by the acs-2 promoter. (C) Fasting activates the acs-2 promoter ubiquitously in C. elegans (middle panel), and higher magnification reveals strongest expression in the intestine and pharynx (right panel). (D) nhr-49 mutants fail to activate acs-2. (E) Neuron-limited rescue of NHR-49 restores acs-2 levels in neurons (arrowhead) and peripheral tissues (arrows). Boxes outline areas magnified in the right panels. Scale bars represent 50 μm. (FI) Survival analysis demonstrating that tax-6 RNAi (F) and CA-AAK-2 (I) extend lifespan in wild type worms, but not worms lacking nhr-49 (G, J). Restoring NHR-49 function selectively to neurons via the rab-3 promoter rescues tax-6 RNAi- (H) and CA-AAK-2-mediated longevity (K). Common genetic backgrounds are indicated next to the origin. See also Figure S5 and Table S1 for lifespan statistics.
Figure 6
Figure 6. Neuronal CRTC-1 and NHR-49 regulation of mitochondrial dynamics mirrors their respective roles in longevity
(AC) Fluorescence imaging (left) and binary representations (right) of mitochondrial networks in body wall muscle cells of day 1 adult worms. Neuronal CRTC-1S76A,S179A (B) and nhr-49 loss-of-function (C) induce fragmentation of the mitochondrial network in muscle cells relative to wild type (A). Scale bars represent 20 μm. (DE) Quantification of neuronal CRTC-1S76A,S179A (D) and nhr-49 loss-of-function (E) dependent mitochondrial fragmentation in a population of worms demonstrates loss of tubular morphology (n = 3 groups of 10-17 worms; p = 0.001 by t-test). (F) Quantification of the ratio between mitochondrial area and perimeter (Mean ± SD from muscle cells of 32 worms; p<0.0001 by t-test). (G) Neuronal CRTC-1S76A,S179A activation decreases the area of muscle cells occupied by mitochondria (Mean ± SD from muscle cells of 32 worms; p<0.0001 by t-test).
Figure 7
Figure 7. Neuronal CRTC-1 regulates longevity and mitochondrial function cell-nonautonomously through catecholamine signaling
(A) Normalized read counts for enzymes involved in synthesis of biogenic amines from the RNA-Seq analysis (see also Table S2). (B) qRT-PCR validating AMPK/CRTC-1 regulation of tbh-1 transcript levels (Mean ± SEM of mRNA levels extracted from 2-4 samples of 50-100 animals; * denotes p<0.05 by t-test). (C) The biosynthetic pathway of octopamine. (D) Fluorescence imaging of a worm co-expressing CRTC-1::tdTOMATO from the native crtc-1 promoter (top left) and GFP driven by the tbh-1 promoter reveals CRTC-1 expression in octopaminergic RIC neurons. (EF) Fluorescence imaging (top) and binary representations (bottom) of the mitochondrial network in muscle cells of animals vehicle-treated (water) or grown on media with 5 mM octopamine (F). (G) Classifying worms by their mitochondrial morphology reveals a 45% decline in the fraction of worms with tubular mitochondria treated with octopamine versus control (p<0.001 by t-test; n = 3 samples of 11-19 worms). (HM) Survival curves demonstrating that neuron-specific activation of CRTC-1S76A,S179A suppresses both AMPK- (H) and calcineurin-mediated (K) lifespan extension. However, neuronal CRTC-1S76A,S179A has no effect on AMPK or calcineurin-mediated longevity in animals lacking functional tdc-1 (I, L) or tbh-1 (J, M). Genetic backgrounds are noted next to the origin. See Table S1 for lifespan statistics.

Comment in

Similar articles

Cited by

References

    1. Alkema MJ, Hunter-Ensor M, Ringstad N, Horvitz HR. Tyramine Functions independently of octopamine in the Caenorhabditis elegans nervous system. Neuron. 2005;46:247–260. 260. - PubMed
    1. Altarejos JY, Goebel N, Conkright MD, Inoue H, Xie J, Arias CM, Sawchenko PE, Montminy M. The Creb1 coactivator Crtc1 is required for energy balance and fertility. Nature medicine. 2008;14:1112–1117. - PMC - PubMed
    1. Altarejos JY, Montminy M. CREB and the CRTC co-activators: sensors for hormonal and metabolic signals. Nature reviews Molecular cell biology. 2011;12:141–151. - PMC - PubMed
    1. Apfeld J, O'Connor G, McDonagh T, DiStefano PS, Curtis R. The AMP-activated protein kinase AAK-2 links energy levels and insulin-like signals to lifespan in C. elegans. Genes & development. 2004;18:3004–3009. - PMC - PubMed
    1. Ashrafi K. Obesity and the regulation of fat metabolism. WormBook : the online review of C elegans biology. 2007:1–20. - PMC - PubMed

Publication types

MeSH terms

Substances

Associated data