. 2015 Mar;17(3):288-99.
doi: 10.1038/ncb3114.

Lysosomal calcium signalling regulates autophagy through calcineurin and ​TFEB

Lysosomal calcium signalling regulates autophagy through calcineurin and ​TFEB

Diego L Medina et al. Nat Cell Biol. 2015 Mar.

Abstract

The view of the lysosome as the terminal end of cellular catabolic pathways has been challenged by recent studies showing a central role of this organelle in the control of cell function. Here we show that a lysosomal Ca2+ signalling mechanism controls the activities of the phosphatase calcineurin and of its substrate ​TFEB, a master transcriptional regulator of lysosomal biogenesis and autophagy. Lysosomal Ca2+ release through ​mucolipin 1 (​MCOLN1) activates calcineurin, which binds and dephosphorylates ​TFEB, thus promoting its nuclear translocation. Genetic and pharmacological inhibition of calcineurin suppressed ​TFEB activity during starvation and physical exercise, while calcineurin overexpression and constitutive activation had the opposite effect. Induction of autophagy and lysosomal biogenesis through ​TFEB required ​MCOLN1-mediated calcineurin activation. These data link lysosomal calcium signalling to both calcineurin regulation and autophagy induction and identify the lysosome as a hub for the signalling pathways that regulate cellular homeostasis.


Figures
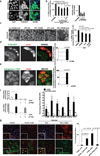
Figure 1
Figure 1
Calcineurin regulates TFEB nuclear translocation. (a,b) siRNA-mediated inhibition of PPP3CB (siPPP3CB) suppresses starvation-induced nuclear translocation in HeLaTFEB-GFP cells. Scale bar 10µm. (b) The left plot represents the percentage of nuclear TFEB in starved cells (3h) silenced with each single PPP3CB oligonucleotide or the pool of the 3 oligonucleotides compared to starved control cells transfected with scramble (SCRMBL) siRNA oligonucleotides. qPCR analysis of PPP3CB mRNA levels confirms the efficacy of siRNA-mediated silencing (right plot). Bar graphs show mean ±s.d. for n=3 independent experiments. Scale bar 10µm. (c) Pharmacological inhibition of calcineurin reduces starvation-mediated TFEB nuclear localization. Images from a HC assay using normally fed or 1h starved HeLaTFEB-GFP cells treated with FK506 (5µM) and/or CsA (10µM). Plot represents the percentage of nuclear TFEB translocation compared with DMSO-treated fed and starved cells. n=3 independent experiments. Scale bar 10µm. (d) HeLaTFEB-GFP cells were transfected with a constitutive active form of calcineurin (HA-tagged-ΔCaN). The plot represents the percentage of TFEB nuclear translocation. Data shows the mean±s.d. of n=3 independent experiments. Scale bar 10µm. (e) HeLa cells were transfected with an empty vector or HA-tagged-ΔCaN. Subcellular localization of endogenous TFEB was analyzed for each condition using specific anti-TFEB antibodies. The plot represents the percentage of TFEB nuclear translocation. Bar graphs show mean ±s.d. of n=3 independent experiments. Scale bar 10µm. (f) Calcineurin overexpression upregulates TFEB target genes. Left panel: qPCR showing the efficiency of TFEB silencing (upper) and ΔCaN overexpression (lower). Right panel: overexpression of ΔCaN in HeLaTFEBGFP cells (ΔCaN) and in HeLaTFEBGFP cells transfected with an siRNA against TFEB (siTFEB+ΔCaN) showing that calcineurin enhances the expression of TFEB target genes in a TFEB-dependent manner. n=3 independent experiments, mean ±s.d, *p<0.05. (g) Exercise induces TFEB nuclear translocation via calcineurin. Muscles were transfected by electroporation with TFEB-GFP (green), ΔCaN, its regulatory subunit (CnB) and the calcineurin inhibitor myc-CAIN. An antibody against dystrophin (Dys, red) was used to visualize the muscle fibers. The yellow arrowheads indicate TFEB nuclear translocation in fibers stimulated by ΔCaN+CnB and exercise, respectively. The plot shows the percentages of TFEB-positive nuclei in muscles under the following conditions: sedentary (control), sedentary with calcineurin (ΔCaN+CnB), exercised (run), exercised with CAIN (run + CAIN). The graph represents mean ±s.d. of n=3 mice. Scale bar 50µm. Source data are provided in Supplementary table 4.
Figure 2
Figure 2
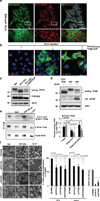
Calcineurin binds and de-phosphorylates TFEB. (a) Proximity Ligation Assay (PLA). HeLa cells were pre-treated 10 minutes before fixation with 1µM ER-tracker (green) to visualize the cytoplasm and with Hoechst 33258 (blue) to stain nuclei. After fixation, cells were processed to detect TFEB proximity interactions. Positive interactions between TFEB and PPP3CB (red dots) are clearly visible (white squares contain higher magnification images). n=3 independent experiments were performed. Scale bar, 10 µm. (b) PLA performed on Hela cells transfected with PPP3CB-myc, TFEB-GFP or both. PPP3CB and TFEB interactions are shown by the red dots. n=3 independent experiments were performed. Scale bar, 10µm. (c) Calcineurin knock-down reduces the starvation-induced downshift of endogenous TFEB electrophoretic mobility. HeLa cells expressing siRNA against PPP3CB were treated as indicated. Specific antibodies against TFEB were used to detect the endogenous protein. n=3 independent experiments were performed. (d) Calcineurin overexpression reduces TFEB electrophoretic mobility. TFEB-FLAG vector alone or in combination with a constitutively active form of calcineurin (HA- ΔCaN) was co-transfected in fed HeLa cells. Calcineurin overexpression was confirmed by using anti-HA antibodies. n=3 independent experiments were performed. (e) Calcineurin de-phosphorylates S142 and S211 of immunoprecipitated TFEB. Lambda phosphatase (λ-PPT) was used as positive control. Specific antibodies against S142-TFEB and 14.3.3 motif, which binds phosphorylated TFEB serine residue S211, were used to detect TFEB phosphorylation. Bar graphs show mean ±s.d. of n=3 independent experiments. (f) Calcineurin regulates TFEB downstream of mTOR. Nuclear translocation of TFEB is reduced in stable HeLaTFEB-GFP cells after silencing of PPP3CB, its essential regulatory subunit PPP3R1 or both genes (PPP3CB/R1). Representative images from HC assay of HeLaTFEB-GFP cells reverse transfected with SCRMBL, PPP3CB, PPP3R1 or PPP3CB/R1 siRNAs, and then subjected to the indicated conditions. The left plot shows the mean ±s.d. of the percentage of nuclear TFEB translocation in knock-down cells compared with their corresponding control-treated cells transfected with scramble siRNA oligonucleotides. n=3 independent experiments were performed. Scale bar 10µm. siRNA-mediated silencing was confirmed by qPCR analysis of PPP3CB and PPP3R1 mRNA levels (right plot). Uncropped scans of western blots are provided in Supplementary Figure 8. Source data are provided in Supplementary table 4.
Figure 3
Figure 3
Ca2+ elevation induces TFEB nuclear translocation via calcineurin. (a) Chelation of intracellular Ca2+ suppresses TFEB nuclear translocation in both starvation (1h) and Torin1 treatment (1µM). The graph represents the percentage of TFEB nuclear translocation in starved and torin-treated HeLaTFEBGFP cells in presence or absence of BAPTA-AM (10µM) (mean ±s.d. for n=3 independent experiments). (b) Immunoblot of nuclear and cytosol fractions from HeLa cells transfected with TFEB-FLAG plasmid, starved for 1 hour or treated with thapsigargin or ionomycin in fed conditions, were incubated with anti-FLAG antibodies to detect TFEB localization. n=3 independent experiments. (c) Intracellular Ca2+ elevation inhibits nutrient-dependent relocation of TFEB from the nucleus to the cytosol. HeLaTFEBGFP cells were starved for 1h to induce TFEB nuclear translocation. Subsequently, the culture medium was changed to complete normal medium, which normally induces TFEB relocation to the cytosol, or complete medium plus calcium ionophores (1µM ionomycin or 300 nM thapsigargin) for 20 minutes. The plot shows the percentage of nuclear TFEB in treated cells compared with corresponding control cells (mean ±s.d. for n=3 independent experiments). (d) Thapsigargin induces endogenous TFEB translocation. Endogenous TFEB subcellular localization under feeding, starvation, and thapsigargin-treatment conditions was analyzed using a HC assay. The plot shows percentage of TFEB nuclear translocation compared with fed control cells (mean ±s.d., n=4 independent experiments). (e,f) Thapsigargin reduces TFEB phosphorylation at key serine residues S142 and S211. (e) Immunoblot analysis of TFEB phosphorylation using an anti-phospho S142-TFEB antibody. Protein lysates from HeLa cells transfected with TFEB-GFP vector and subjected to the indicated treatments were blotted against anti-phospho-S142-TFEB antibody, anti-GFP antibody was used to detect total TFEB. The plot shows the mean ± s.d. for n=4 independent experiments. (f) Indirect assessment of phosphorylation of TFEB residue S211 by immunoprecipitation of TFEB-GFP an immunoblot using an antibody against a specific 14-3-3 motif that recognizes phosphorylated proteins. The plot shows the mean ± s.d. for n=2 independent experiments. (g) Silencing of PPP3CB and its regulatory subunit PPP3R1 suppresses thapsigargin-induced nuclear translocation of TFEB. The graph represents the percentage of TFEB nuclear translocation in silenced cells vs cells transfected with a scramble oligonucleotide at the treatments indicated (mean ±s.d. for n=3 independent experiments). Scale bars 10µm. Uncropped western blots are provided in Supplementary Figure 8, and Source data in Supplementary table 4.
Figure 4
Figure 4
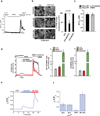
Starvation induces lysosomal Ca2+ release via MCOLN1. (a) Starvation does not induce bulk cytosolic Ca2+ elevation in HeLa cells transfected with the Ca2+-sensitive probe aequorin. Bulk cytosolic [Ca2+] was monitored during perfusion with complete L-15 medium, HBSS and HBSS supplemented with 100µM histamine as indicated. n=8 coverslips from two independent transfections (b) Stable HeLaTFEB-GFP cells were left untreated or pretreated for 30 minutes with the Ca2+ chelators BAPTA-AM or EGTA-AM (5µM each). After washing, cells were left untreated or starved for 1 hr. After treatment, cells were fixed and a HC imaging analysis was performed. The plot shows the percentage of TFEB nuclear translocation in BAPTA-treated cells compared with untreated and EGTA treated (mean ± s.d., n=3 independent experiments). Scale bar 10µm. (c) Average [Ca2+]cyt evoked by maximal histamine stimulation in WT HeLa cells. Agonist stimulation was carried out in complete L-15 medium or after a three minutes starvation with HBSS (2.45 ± 0.19 µM, HeLa WT in L-15 medium; 2.406 ± 0.23 µM, HeLa WT in HBSS; n=8 coverslips from two independent transfections). (d) Representative traces of the cytosolic GCaMP6s and the perilysosomal ML1-GCaMP3 calcium probes. HeLa cells were transfected with the indicated probe and ratiometric imaging (474 and 410 nm excitation) was performed. Cells were continuously perfused with the indicated solutions. The plot in the middle represents the average perilysosomal calcium peak values induced by perfusion of the indicated buffer, as recorded by the GCaMP3-ML1 probe (R: 1.149 ± 0.051, L-15; 1.508 ± 0.060, HBSS; 7.500 ± 0.456, histamine; n= 18 cells from two independent transfections). The plot on the right represents the average cytosolic calcium peak values induced by perfusion of the indicated buffer, as recorded by the GCaMP6s probe (R: 0.404 ± 0.026, L-15; 0.389 ± 0.022, HBSS; 7.473 ± 0.428, histamine; n = 12 cells from two independent transfections). (e) Ca2+ release (measured with deltaF/F0 fluorescence intensity) was detected right after the L15 medium (containing 2 mM [Ca2+], aminoacids and 10% FBS) was switched to Tyrode’s solution (2mM [Ca2+]) in HEK293 cells stably expressing GCaMP3-ML1. The agonist of MCOLN1 ML-SA1 (10µM) was applied to induce MCOLN1-mediated Ca2+ release. n=3 independent experiments. (f) Similarly the lysosomotropic drug GPN blunted starvation-mediated calcium release detected by GCaMP3-ML1. n=3 independent experiments, *, p<0.05. Source data are provided in Supplementary table 4.
Figure 5
Figure 5
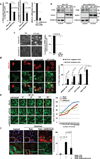
MCOLN1-mediated calcium release induces TFEB nuclear translocation. (a-b) Silencing of MCOLN1 reduces starvation-mediated TFEB nuclear translocation. (a), HeLa cells or a HeLa cell line stably-transfected with a MCOLN1 shRNA were left untreated or transiently transfected with a TFEB-GFP plasmid. The left plot shows the percentage of TFEB-GFP nuclear translocation in starved (3hr) HeLa-shMCOLN1 cells compared with starved HeLa cells (n=3 independent experiments). Similarly, the middle plot shows the results on endogenous TFEB nuclear translocation (n=4 independent experiments). The right plot shows the efficiency of MCOLN1 gene silencing (n=3 independent experiments). The graphs show the mean ±s.d. (b) Silencing of MCOLN1 reduces starvation-mediated TFEB nuclear translocation. HeLa and HeLa-shMCOLN1cells were transfected with TFEB-3XFLAG construct. Following starvation, 50µg of nuclear and 100µg of cytosolic extracts were prepared and probed using anti-Flag antibody (n=3 independent experiments). (c) Endogenous TFEB nuclear translocation analysis of human- WT and mucolipidosis IV fibroblasts in fed conditions and after a 3 hr starvation of serum and aminoacids. The graph shows the percentage of TFEB nuclear translocation using (mean ±s.d of n=4 independent experiments). Scale bar 10µm. (d) Overexpression of MCOLN1 induces TFEB nuclear translocation. Stable HeLaTFEB-GFP were transfected with plasmids carrying wild type or constitutively active mutant forms of FLAG-tagged MCOLN1. TFEB subcellular localization was assessed in FLAG-positive (red-stained cells) and -negative cell populations. The graph shows the percentage of nuclear TFEB in the different transfected cell groups, compared to fed and starved (3hrs) conditions (mean ±s.d. for n=5 independent experiments). Scale bar 10µm. (e) Frames of time-lapse experiments in HeLaTFEB-GFP cells treated with the MCOLN1 agonist SF-51 (200µM) after the transfection of PPP3CB+PPP3R1 (siCaN), MCOLN1 or scramble siRNAs (Supplementary videos 1-3). Yellow arrowheads indicate TFEB nuclear localization. The plot shows the kinetics of TFEB nuclear localization during the time of recording (n=3 independent experiments). (f) Exercise induces TFEB nuclear translocation via MCOLN1. Muscles were electroporated with TFEB-GFP (green) and shRNAs against MCOLN1 (red). Antibodies against dystrophin (Dys, red) were used to reveal the muscle fibers. The arrowheads indicate TFEB nuclear localization in muscle fibers. The plot shows the percentages of TFEB-positive nuclei in muscles under the following conditions: sedentary (control), exercised (run), exercised with shMCOLN1 (run + shMCOLN1) (mean ±s.d of n=3 mice. Scale bar 50µm. Uncropped western blots and Source data are provided in Supplementary Figure 8 and Supplementary table 4.
Figure 6
Figure 6
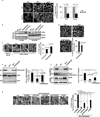
Calcineurin regulates the lysosomal/autophagic pathway. (a) The transcriptional response of lysosomal/autophagic genes is reduced in PPP3R1−/− KO MEFS (bottom) compared to wild type (top) cells (ranked by fold-change). A value of 1 was assigned to expression levels in fed conditions (n=3 independent experiments). (b-c) Immunoblots against LAMP1 (b), and LC3 (c) from wild type and PPP3R1−/− MEFs in fed and starved (3 hours) conditions. The plot shows the quantification of Lamp1 and LC3-II proteins levels normalized by actin loading control (mean ±s.d for n=2 and n=5 independent experiments, respectively. (d) HC analysis of LC3-positive vesicles in wild type and PPP3R1−/− MEFs in fed and starved conditions. The bar-graph shows the mean ±s.d of LC3-positive vesicles in the different treatment conditions for n= 6 independent experiments. Scale bar 10µm. (e) Analysis of the overexpression of the autophagy-related PI(3)P reporter GFP-2xFYVE during starvation in (Mock) HeLa cells, and cells silenced for PPP3CB/PPP3R1. GFP-2xFYVE-positive vesicles were counted using ImageJ software. Approximately 50 cells per condition were analyzed by confocal imaging. Data shows the mean ±s.d for n=2 independent experiments. Scale bar 10µm. (f) Depletion of calcineurin reduces the autophagic flux. HeLa cells were transfected with SCRMBL siRNA or siRNA against both PPP3CB and PPP3R1 (siCaN). After 48 hours, cells were transfected with a plasmid carrying the autophagy substrate p62 fused to GFP for 24h, and treated as indicated. The graph shows the levels of p62-GFP normalized by actin at the different time-points. (g) Analysis of mTOR activity during starvation in normal cells and in cells silenced against calcineurin (siCaN). Two mTOR subtrates, phospho-ULK and phospho-p70S6K, as well as the total protein, were detected by immunoblotting using specific antibodies (n=2 independent experiments). (h,i) Overexpression of ΔCaN increased LC3II protein levels in a TFEB-dependent manner. (h) RPE-1 cells and (i) HeLa were transfected with TFEB or scramble siRNAs and after 48h they were transfected with ΔCaN for 24h. Cells were left in fed conditions and treated or not with bafilomycin. 50µg of protein extracts were then immunoblotted and tested for the amount of LC3-II using specific antibodies (n=4 independent experiments). Uncropped western blots and Source data are provided in Supplementary Figure 8 and Supplementary table 4.
Figure 7
Figure 7
Calcineurin regulates the lysosomal/autophagic pathway. (a) Representative images and analysis of the overexpression of the autophagy-related PI(3)P reporter GFP-2xFYVE during starvation in WT (Mock) HeLa cells, in cells silenced for MCOLN1. GFP-2xFYVE-positive vesicles were counted using ImageJ software. Approximately 50 cells were pooled per condition and were analyzed by confocal imaging. Data shows the mean ±s.d of n=2 independent experiments. Scale bar 10µm. (b) MCOLN1 overexpression leads to a significant increase in LC3 levels. HeLa cells were transfected with myc-tagged MCOLN1 or gain of function mutants R427P and V432P respectively. Immunofluorescence was performed using anti-LC3 antibodies. The number of LC3 spots per cell was quantified using HC imaging analysis. Mean values ± s.d are plotted for n=4 independent experiments. Scale bar 10µm. (c) 50 µg of protein extracts from HeLa cells treated with bafilomycin (BAFA) and overexpressing an empty vector of a myc-MCOLN1 plasmid for 24 h were immunoblotted against LC3 (n=3 independent experiments). (d,e) Overexpression of TFEB increases the effects of MCOLN1. Lysosomal patch-clamp was performed in both control (d) and TFEB overexpressing cells (e). Note that the effect of different concentrations of the MCOLN1 agonist ML-SA1 is strongly enhanced likely due to an increase in the number of MCOLN1 channels. n=3 independent experiments. Uncropped scans of western blots are provided in Supplementary Figure 8. Source data are provided in Supplementary table 4.
Figure 8
Figure 8
Model of Ca2+ mediated regulation of TFEB. Under normal feeding conditions TFEB is phosphorylated on the lysosomal surface and is sequestered in the cytoplasm by the 14-3-3 proteins. During starvation and physical exercise Ca2+ is released from the lysosome via MCOLN1, thus establishing a Ca2+ microdomain. This leads to calcineurin activation and TFEB de-phosphorylation. De-phosphorylated TFEB is no longer able to bind 14-3-3 proteins and can freely translocate to the nucleus where it transcriptionally activates the lysosomal/autophagic pathway.

Comment in

Similar articles

Cited by

References

    1. Luzio JP, Pryor PR, Bright NA. Lysosomes: fusion and function. Nat Rev Mol Cell Biol. 2007;8:622–632. - PubMed
    1. Saftig P, Klumperman J. Lysosome biogenesis and lysosomal membrane proteins: trafficking meets function. Nature Rev. Mol. Cell Biol. 2009;10:623–635. - PubMed
    1. de Duve C. The lysosome turns fifty. Nature Cell Biol. 2005;7:847–849. - PubMed
    1. Luzio JP, Parkinson MD, Gray SR, Bright NA. The delivery of endocytosed cargo to lysosomes. Biochem. Soc. Trans. 2009;37:1019–1021. - PubMed
    1. He C, Klionsky DJ. Regulation mechanisms and signaling pathways of autophagy. Annu. Rev. Genet. 2009;43:67–93. - PMC - PubMed

Publication types

MeSH terms

Substances