. 2015 Mar 10;112(10):E1116-25.
doi: 10.1073/pnas.1501199112. Epub 2015 Feb 23.

Mutations in early follicular lymphoma progenitors are associated with suppressed antigen presentation

Affiliations

Mutations in early follicular lymphoma progenitors are associated with suppressed antigen presentation

Michael R Green et al. Proc Natl Acad Sci U S A. .

Abstract

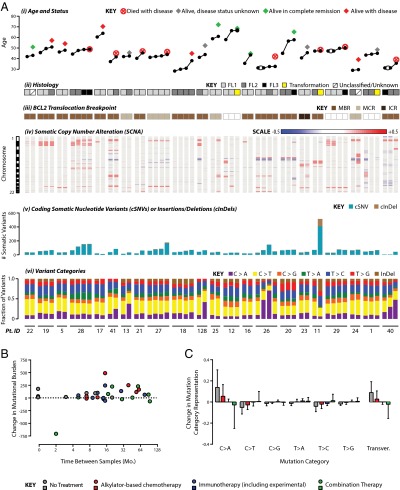
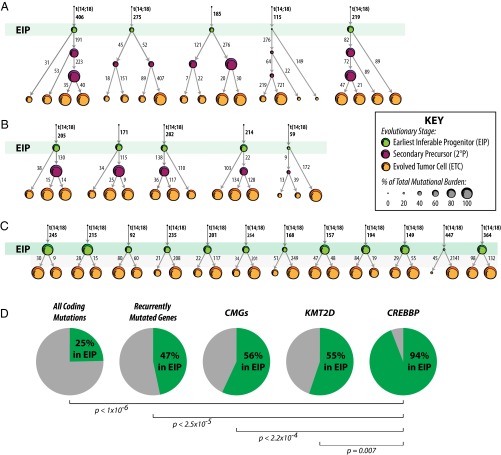
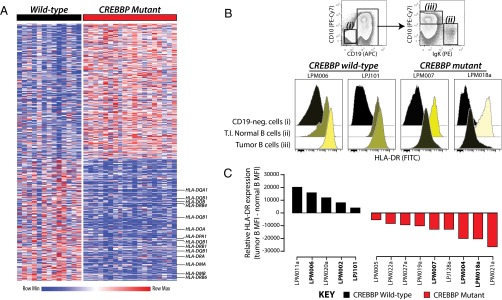
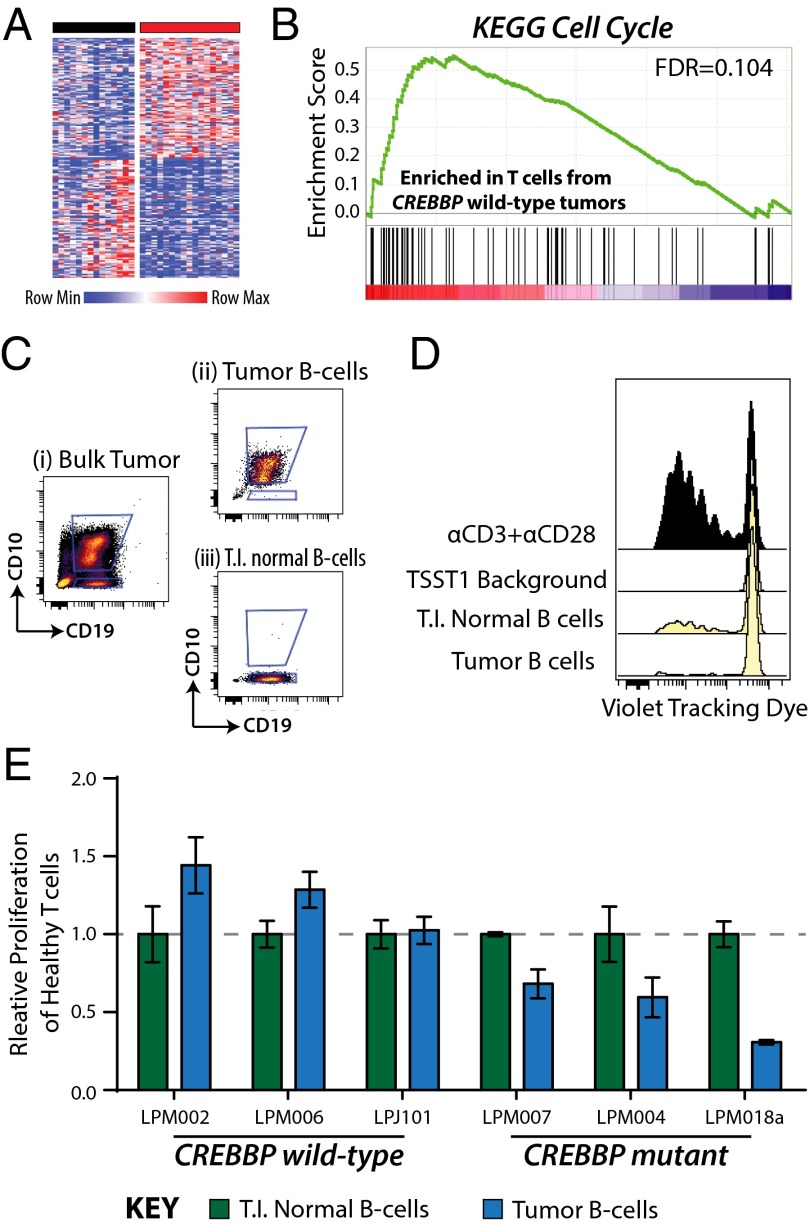
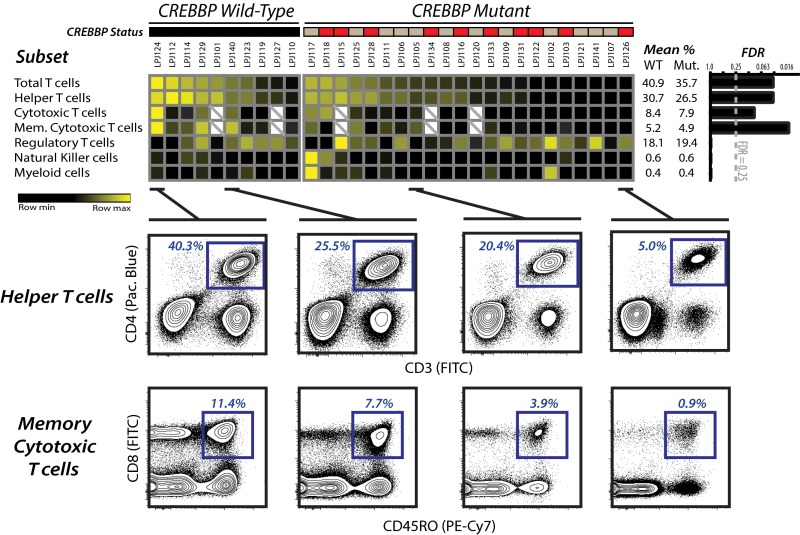
Follicular lymphoma (FL) is incurable with conventional therapies and has a clinical course typified by multiple relapses after therapy. These tumors are genetically characterized by B-cell leukemia/lymphoma 2 (BCL2) translocation and mutation of genes involved in chromatin modification. By analyzing purified tumor cells, we identified additional novel recurrently mutated genes and confirmed mutations of one or more chromatin modifier genes within 96% of FL tumors and two or more in 76% of tumors. We defined the hierarchy of somatic mutations arising during tumor evolution by analyzing the phylogenetic relationship of somatic mutations across the coding genomes of 59 sequentially acquired biopsies from 22 patients. Among all somatically mutated genes, CREBBP mutations were most significantly enriched within the earliest inferable progenitor. These mutations were associated with a signature of decreased antigen presentation characterized by reduced transcript and protein abundance of MHC class II on tumor B cells, in line with the role of CREBBP in promoting class II transactivator (CIITA)-dependent transcriptional activation of these genes. CREBBP mutant B cells stimulated less proliferation of T cells in vitro compared with wild-type B cells from the same tumor. Transcriptional signatures of tumor-infiltrating T cells were indicative of reduced proliferation, and this corresponded to decreased frequencies of tumor-infiltrating CD4 helper T cells and CD8 memory cytotoxic T cells. These observations therefore implicate CREBBP mutation as an early event in FL evolution that contributes to immune evasion via decreased antigen presentation.

Keywords: CREBBP; antigen presentation; exome; hierarchy; lymphoma.


Conflict of interest statement

The authors declare no conflict of interest.

Figures

Fig. 1.
Fig. 1.
The landscape of somatic mutations at diagnosis of FL includes novel genes as well as pervasive and cosegregating mutations of chromatin modifying genes. The distribution of mutations in 28 recurrently mutated genes in 138 FL tumors from diagnosis is shown and colored by variant type. These included 28 tumors interrogated by exome sequencing with matched germ-line DNA to confirm the somatic origin of mutations and a total of 75 tumors sequenced from purified B cells (∼90% tumor). Four novel recurrently mutated genes are highlighted in bold. Analysis of gene ontology across recurrently mutated genes showed a strong enrichment for CMGs (FDR = 0.008). The number of CMG mutations within each tumor is displayed at the top of the figure and shows the high number of tumors with multiple CMG mutations.
Fig. 2.
Fig. 2.
Evolution of FL genomes. (A) Overview of FL genome evolution by exome and single nucleotide polymorphism microarray analysis of 59 tumors from 22 patients. (i) Patient age for each biopsy is shown with tumors from the same patient grouped together, ordered chronologically from left to right. Biopsies obtained simultaneously from two different sites are linked by two lines. Patient disease status marked at the age of last follow-up. (ii) Grade of each tumor is shown. This cohort focuses on the indolent phase of the disease, with only three transformed samples. (iii) BCL2 translocation breakpoint determined by PCR. When BCL2 translocations are detected in a patient, they are identified with the same breakpoint in all tumors from that patient. (iv) Somatic copy number alteration (SCNA) patterns are shown, with autosomes ordered top to bottom from 1 to 22. DNA copy losses are shown in blue, and gains in red. Complete loss of karyotypic complexity can be observed in later biopsies of cases 128, 12, and 1. (v) Total numbers of cSNVs and cInDels are shown for each tumor, with a general trend of increasing mutational burden during disease progression. (vi) The proportion of mutations in each variant category shows a trend for increasing C > A transversions during disease progression. (B) Mutational burden generally increases during the course of disease but does not significantly correlate (Pearson correlation P = 0.586) with the elapsed time between biopsies or the type of intervening treatment. (C) Intervening treatment type was associated with different patterns of relative gain or loss in variant types between paired biopsies, particularly C > A transversions (P = 0.037).
Fig. 3.
Fig. 3.
The hierarchy of somatic mutations by phylogenetic analysis of serial tumor biopsies. (A) Hierarchies generated from all somatic mutations across four tumors per case allow the identification of the earliest inferable progenitor (EIP, green) containing the smallest set of mutations shared by all tumors, as well as two secondary progenitors containing sets of mutations shared by two to three tumors, but not all four tumors [secondary precursor (2°P); purple]. The evolved tumor cell (ETC, yellow) contains all mutations detected within the sequenced tumor. BCL2 translocations were always uniformly represented across all tumors from a given patient when detected and are indicated by t(14;18) at the top of the hierarchy. Numbers alongside the arrows indicate the number of somatic mutations at each step of the hierarchy, and the sizes of the nodes are relative to the fraction of the maximum mutational burden at any time in each case. (B) Hierarchies generated from three tumors per case allow the identification of an EIP and a single 2°P. (C) Hierarchies generated from two tumors per case allow the identification of only a single common EIP. (D) The fraction of mutations within the EIP (green) or at stages after the EIP (gray) are shown. Mutations in recurrently mutated genes have a relatively higher representation as early events that are present in EIPs compared with all coding mutations, as do mutations in CMGs and the most frequently mutated gene, KMT2D. However, CREBBP mutations were the most significantly enriched event with the EIP, with 94% (16/17) of the mutations being inferred to be acquired within this common ancestor to all tumors, indicating that they are an early event in the genomic evolution of FL.
Fig. 4.
Fig. 4.
Decreased MHC class II expression associated with CREBBP mutations. (A) A heat map shows differentially expressed genes between 14 CREBBP wild-type and 19 CREBBP mutant tumors. These include decreased expression of multiple MHC class II genes. For a full list of differentially expressed genes, refer to SI Appendix, Table S6. (B) Illustrative examples are shown of flow cytometric analysis of HLA-DR. The gating strategy is shown above for CD19-negative tumor-infiltrating non-B cells (i), tumor-infiltrating CD19+ Ig light-chain-gated normal B cells (ii), and CD19+ Ig light-chain restricted tumor B cells (iii). Two representative CREBBP wild-type cases and two representative CREBBP mutant cases are shown. In CREBBP wild-type cases, tumor B cells can be seen to have marginally higher HLA-DR expression compared with normal B cells from the same tumor microenvironment. In contrast, tumor B cells from CREBBP mutant cases have an approximate 1-log reduction in HLA-DR expression compared with normal B cells from the same tumor microenvironment. (C) Relative mean fluorescence intensities for tumor B cells compared with nontumor B cells from the same microenvironment are shown for five CREBBP wild-type and nine CREBBP mutant cases, including the illustrative examples in B. It can be seen that all CREBBP wild-type cases have higher HLA-DR expression on tumor B cells compared with normal B cells, as indicated by positive values, whereas all CREBBP mutant tumors have lower HLA-DR expression on tumor cells compared with normal B cells, as indicated by negative values. Cases shown in Figs. 4B or 5D are highlighted in bold.
Fig. 5.
Fig. 5.
Decreased proliferation of T cells associated with CREBBP mutant B cells. (A) A heat map of genes that are differentially expressed between T cells isolated from tumors bearing CREBBP wild-type tumor B cells (black bar, n = 14) compared with T cells isolated from tumors bearing CREBBP mutant tumor B cells (red bar, n = 17). The signature consisted of 90 genes with significantly higher transcript abundance and 88 genes with significantly lower transcript abundance (FDR < 0.25; fold-change, >1.2) in T cells from CREBBP mutant tumors compared with T cells from CREBBP wild-type tumors. (B) GSEA of gene expression data from purified T.I. T cells showed signatures associated with decreased proliferation in CREBBP mutant tumors compared with CREBBP wild-type tumors. (C) Tumor B cells and T.I. normal B cells were sorted from a tumor with biallelic mutation of CREBBP associated with lower HLA-DR expression on tumor cells. (D) Sorted tumor B cells and T.I. normal B cells were cocultured with purified CD4 T cells from a healthy donor in the presence of toxic shock syndrome toxin-1 to cross-link MHC class II and the T-cell receptor. Dye dilution in the CD4 T cells is used to measure proliferation and can be seen to be higher when cocultured with T.I. normal B cells with greater MHC class II expression than with tumor B cells. Proliferation of T cells cocultured with αCD3+αCD28 antibodies or with toxic shock syndrome toxin-1 alone is shown as positive and negative (TSST1 background) controls, respectively. (E) A summary of MLR results for six primary tumors is shown, including three CREBBP wild-type (Left) and three CREBBP mutant (Right). Values are background subtracted percentages of T-cell proliferation measured by dye dilution, normalized to the T.I. normal B cells for each case. Each bar represents the mean of triplicate wells for the same condition ± SEM. It can be seen that tumor B cells from CREBBP wild-type cases stimulate CD4 T-cell proliferation to equal or higher levels than T.I. normal B cells with identical HLA mismatches. In contrast, tumor B cells from CREBBP wild-type cases stimulate lower levels of CD4 T-cell proliferation compared with T.I. normal B cells with identical HLA mismatches.
Fig. 6.
Fig. 6.
Decreased frequency of tumor-infiltrating T-cell subsets in CREBBP mutant tumors. Flow cytometric quantification of tumor-infiltrating immune cell subsets from 32 tumors with known CREBBP mutation status (wild-type, black; heterozygous mutant, brown; homozygous mutant, red), shown as a row-normalized heat map, with greater relative frequency indicated as brighter shades of yellow. CREBBP mutant tumors had significantly lower fractions of total CD3+ T cells, CD3+CD4+ helper T cells, CD3+CD8+ cytotoxic T cells, and CD3+CD8+CD45RO+ memory cytotoxic T cells. Cells were gated on lymphocytes and nondoublets by forward and side-scatter properties, and four illustrative examples show the gating schema for CD3+CD4+ helper T cells and CD3+CD8+CD45RO+ memory cytotoxic T cells.

Similar articles

  • The CREBBP Acetyltransferase Is a Haploinsufficient Tumor Suppressor in B-cell Lymphoma.
    Zhang J, Vlasevska S, Wells VA, Nataraj S, Holmes AB, Duval R, Meyer SN, Mo T, Basso K, Brindle PK, Hussein S, Dalla-Favera R, Pasqualucci L. Zhang J, et al. Cancer Discov. 2017 Mar;7(3):322-337. doi: 10.1158/2159-8290.CD-16-1417. Epub 2017 Jan 9. Cancer Discov. 2017. PMID: 28069569 Free PMC article.
  • Pan-HDAC Inhibitors Restore PRDM1 Response to IL21 in CREBBP-Mutated Follicular Lymphoma.
    Desmots F, Roussel M, Pangault C, Llamas-Gutierrez F, Pastoret C, Guiheneuf E, Le Priol J, Camara-Clayette V, Caron G, Henry C, Belaud-Rotureau MA, Godmer P, Lamy T, Jardin F, Tarte K, Ribrag V, Fest T. Desmots F, et al. Clin Cancer Res. 2019 Jan 15;25(2):735-746. doi: 10.1158/1078-0432.CCR-18-1153. Epub 2018 Oct 22. Clin Cancer Res. 2019. PMID: 30348636
  • Crebbp loss cooperates with Bcl2 overexpression to promote lymphoma in mice.
    García-Ramírez I, Tadros S, González-Herrero I, Martín-Lorenzo A, Rodríguez-Hernández G, Moore D, Ruiz-Roca L, Blanco O, Alonso-López D, Rivas JL, Hartert K, Duval R, Klinkebiel D, Bast M, Vose J, Lunning M, Fu K, Greiner T, Rodrigues-Lima F, Jiménez R, Criado FJG, Cenador MBG, Brindle P, Vicente-Dueñas C, Alizadeh A, Sánchez-García I, Green MR. García-Ramírez I, et al. Blood. 2017 May 11;129(19):2645-2656. doi: 10.1182/blood-2016-08-733469. Epub 2017 Mar 13. Blood. 2017. PMID: 28288979 Free PMC article.
  • Pathogenesis of follicular lymphoma.
    Lackraj T, Goswami R, Kridel R. Lackraj T, et al. Best Pract Res Clin Haematol. 2018 Mar;31(1):2-14. doi: 10.1016/j.beha.2017.10.006. Epub 2017 Nov 1. Best Pract Res Clin Haematol. 2018. PMID: 29452662 Review.
  • Chromatin modifying gene mutations in follicular lymphoma.
    Green MR. Green MR. Blood. 2018 Feb 8;131(6):595-604. doi: 10.1182/blood-2017-08-737361. Epub 2017 Nov 20. Blood. 2018. PMID: 29158360 Free PMC article. Review.

Cited by

References

    1. Dave SS, et al. Prediction of survival in follicular lymphoma based on molecular features of tumor-infiltrating immune cells. N Engl J Med. 2004;351(21):2159–2169. - PubMed
    1. Glas AM, et al. Gene-expression and immunohistochemical study of specific T-cell subsets and accessory cell types in the transformation and prognosis of follicular lymphoma. J Clin Oncol. 2007;25(4):390–398. - PubMed
    1. Kiaii S, et al. Follicular lymphoma cells induce changes in T-cell gene expression and function: Potential impact on survival and risk of transformation. J Clin Oncol. 2013;31(21):2654–2661. - PMC - PubMed
    1. Kridel R, Sehn LH, Gascoyne RD. Pathogenesis of follicular lymphoma. J Clin Invest. 2012;122(10):3424–3431. - PMC - PubMed
    1. Green MR, Alizadeh AA. Common progenitor cells in mature B-cell malignancies: Implications for therapy. Curr Opin Hematol. 2014;21(4):333–340. - PubMed

Publication types

MeSH terms

Associated data