. 2015 Feb 24;11(2):e1004652.
doi: 10.1371/journal.ppat.1004652. eCollection 2015 Feb.

HITS-CLIP analysis uncovers a link between the Kaposi's sarcoma-associated herpesvirus ORF57 protein and host pre-mRNA metabolism

Affiliations

HITS-CLIP analysis uncovers a link between the Kaposi's sarcoma-associated herpesvirus ORF57 protein and host pre-mRNA metabolism

Emi Sei et al. PLoS Pathog. .

Abstract

The Kaposi's sarcoma associated herpesvirus (KSHV) is an oncogenic virus that causes Kaposi's sarcoma, primary effusion lymphoma (PEL), and some forms of multicentric Castleman's disease. The KSHV ORF57 protein is a conserved posttranscriptional regulator of gene expression that is essential for virus replication. ORF57 is multifunctional, but most of its activities are directly linked to its ability to bind RNA. We globally identified virus and host RNAs bound by ORF57 during lytic reactivation in PEL cells using high-throughput sequencing of RNA isolated by cross-linking immunoprecipitation (HITS-CLIP). As expected, ORF57-bound RNA fragments mapped throughout the KSHV genome, including the known ORF57 ligand PAN RNA. In agreement with previously published ChIP results, we observed that ORF57 bound RNAs near the oriLyt regions of the genome. Examination of the host RNA fragments revealed that a subset of the ORF57-bound RNAs was derived from transcript 5' ends. The position of these 5'-bound fragments correlated closely with the 5'-most exon-intron junction of the pre-mRNA. We selected four candidates (BTG1, EGR1, ZFP36, and TNFSF9) and analyzed their pre-mRNA and mRNA levels during lytic phase. Analysis of both steady-state and newly made RNAs revealed that these candidate ORF57-bound pre-mRNAs persisted for longer periods of time throughout infection than control RNAs, consistent with a role for ORF57 in pre-mRNA metabolism. In addition, exogenous expression of ORF57 was sufficient to increase the pre-mRNA levels and, in one case, the mRNA levels of the putative ORF57 targets. These results demonstrate that ORF57 interacts with specific host pre-mRNAs during lytic reactivation and alters their processing, likely by stabilizing pre-mRNAs. These data suggest that ORF57 is involved in modulating host gene expression in addition to KSHV gene expression during lytic reactivation.


Conflict of interest statement

The authors have declared that no competing interests exist.

Figures
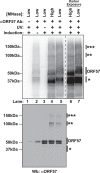
Fig 1
Fig 1. Isolation of cross-linked ORF57-RNA complexes for HITS-CLIP analysis.
Top Nitrocellulose membrane from an ORF57 immunoprecipitation performed under HITS-CLIP conditions. Cross-linked RNA fragments were end-labeled with 32P to be visualized by Phosphoimager. Cells were induced to undergo lytic reactivation, exposed to UV and/or treated with high or low concentrations of MNase as indicated. The samples lacking an ORF57 antibody (lane 1) were precipitated with pre-bleed antibodies from the same rabbit. Lanes 6 and 7 are a dark exposure of lanes 4 and 5. The dashed white box indicates the position of the ORF57 complex cut from the membrane for library preparation. Bottom Western blot of the same HITS-CLIP samples shown in the top panel. Affinity purified rabbit anti-ORF57 was used to detect ORF57. Positions of molecular weight markers are shown on the left. On the right, a single asterisk marks the position of a contaminating ~37 kDa protein; double and triple asterisks mark positions of putative ORF57 homodimers and homotrimers bound to the same RNA. The doublet is likely due to an ORF57 cleavage product [104].
Fig 2
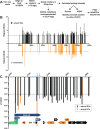
Fig 2. Identification of enriched clusters mapping to the KSHV genome.
(A) Outline of the bioinformatic pipeline used to identify enriched clusters. (B) Genomic location of KSHV enriched clusters. The x-axis represents position on the KSHV genome (U75698) and the midpoint of each cluster was used as the x-coordinate. KSHV enriched clusters ranged from 19–3679 nt; the mean enriched cluster length was 176 nt and the median was 79 nt. A statistical cutoff of 0.001 was used to define enriched clusters (dashed lines). For display, the RNA fragments mapping to the KSHV plus strand were assigned -log10(p-values) (black) while the minus strand clusters are displayed as log10(p-values) (orange). (C) Detailed examination of the enriched clusters from KSHV genome position 23kb-40kb. The plus and minus strands are in black and orange as in (B) but both are displayed as p-value. For the genome annotations shown at the bottom of the graph, plus strand ORFs are black arrows, minus strand ORFs are orange arrows, oriLyt-L elements are in green, and RNAs with potential noncoding functions are purple. Orange arrows point to enriched clusters on PAN RNA minus strand.
Fig 3
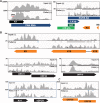
Fig 3. Sequence reads across various viral genomic loci.
Mapped sequence reads of input (top) and pellet (bottom) from one biological replicate for the region surrounding (A) PAN RNA (left) and oriLyt-L (right). (B) Additional loci in which enriched clusters were observed in the high stringency dataset. (C) ORF58-ORF59 region, which was only identified in the low stringency dataset. In all panels, reads from only one strand are shown which is indicated by the plus or minus signs. The black bars above the peaks in the pellet panels mark the positions of the enriched clusters from the high stringency dataset whereas the blue bars were observed only in the low stringency dataset. The color schemes for genes are the same as Fig. 2. The numbers at the top left of each frame are proportional to the number of reads stacked in a given window. The asterisks approximate the positions of T→C or deletion mutations observed in the pellets.
Fig 4
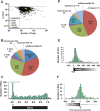
Fig 4. Identification and characterization of enriched clusters mapping to the human genome.
(A) Graph of the 2,229 host enriched clusters with their p-values plotted on the y-axis and the total tag count for one of the three biological replicates plotted on the x-axis. Enriched clusters from four selected candidate genes are shown in color. (B) Pie chart of the gene feature annotations of human enriched clusters. If a cluster spanned multiple different annotations, the cluster annotation was split proportionally among the annotations. Upstream and downstream 2 kb refer to clusters mapping within 2 kb immediately flanking the nearest annotated gene. (C) The bar graph compares the number human enriched clusters (ECs) relative to their position on the closest annotated transcript. 0.0 and 1.0 correspond to the transcription start site (TSS) and the poly(A) site, respectively. Importantly, the length in this graph is relative to the annotated gene and is not a measure of the distance in base pairs. The brackets denote the 5´-enriched clusters examined in D-E. (D) Pie graph classifies the 5´-enriched clusters based on their gene feature annotations (n = 288). (E) Bar graph comparing the number (y-axis) and position (x-axis) of 5´ enriched clusters relative to the transcription start site (TSS). The distance is measured in base pairs from the TSS (TSS = 0). (F) Bar graph comparing the number (y-axis) and position (x-axis) of 5´ enriched clusters relative to the 5´-most exon-intron junction. The distance is measured in base pairs from the first exon-intron boundary, which was set at zero.
Fig 5
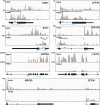
Fig 5. Sequence traces of ORF57-bound human RNAs.
Each panel is a screen shot (IGV browser [105]) of the input and pellet samples from one biological replicate. The numbers at the top left of each frame are proportional to the number of reads stacked in a given window. The x-axes in each panel were scaled for each specific transcript. The black bars in the pellet panels denote positions of the enriched clusters and the asterisks denote approximate positions of characteristic mutations. Below each panel is a gene diagram with the TSS and gene orientation indicated by the black arrow. Green and blue arrows above and below the gene diagram indicate the positions of primers used to assay pre-mRNA and mRNAs, respectively. The exons (thick black rectangles) and introns (black lines) are to scale, but the primer and amplicon lengths are not. When possible, primers or amplicons for mRNAs were designed to span exon-exon boundaries (blue dashed lines).
Fig 6
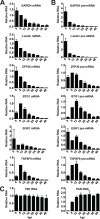
Fig 6. Candidate ORF57-bound pre-RNAs display distinct steady-state level kinetics during lytic reactivation.
RNA was harvested at the indicated time points subsequent to lytic reactivation of TREx BCBL1-Rta cells. (A) mRNA, (B) pre-mRNA, or (C) control RNA levels were monitored by RT-qPCR; positions of primers are shown in Fig. 5. Values were first normalized to 7SK RNA and the corresponding value for the 8 hpi time point was set to 1.0. 7SK RNA panel was only normalized to values from 8 hpi, but each experiment used equal amounts of total RNA. Mean values and standard deviation are shown (n = 3).
Fig 7
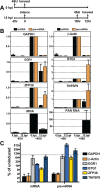
Fig 7. Newly made candidate ORF57-bound pre-RNAs have distinct kinetics during lytic reactivation.
(A) Schematic of the time course used for 4SU metabolic labeling experiments. Cells were incubated with 4SU for two hours beginning at -2 and 10 hpi. Cells were collected and RNAs were extracted at 0 and 12 hpi, respectively. (B) Newly made RNA levels were monitored by RT-qPCR with the primers described in Fig. 5. The RT-qPCR values are listed relative to the 0 hpi samples which were set to 1.0. Note that the y-axis scales differ between the panels. The-4SU samples were collected at the same time and processed alongside the other samples, but the cells were not treated with 4SU. Mean values are shown and error bars are standard deviation (n = 3). (C) The data from (B) were plotted for direct comparison between controls (GAPDH and β-actin) and ORF57-bound candidates (EGR1, BTG1, ZFP36, and TNFSF9). The y-axis is on a log scale and the values are presented as the percent relative to the uninduced samples. The dotted line represents 100%.
Fig 8
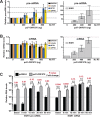
Fig 8. ORF57 is sufficient to up-regulate candidate pre-RNAs in HEK293 cells.
(A) An ORF57 expression construct (pc-Fl-ORF57II) or vector control (pcDNA) was transfected into HEK293 cells in the indicated amounts. After 48 hrs, RNA was harvested and RT-qPCR was performed to examine the pre-mRNA levels of GAPDH, β-actin, BTG1, ZFP36 or EGR1. Because of the difference in scale, EGR1 was plotted separately (right panel). Values are shown relative to the vector alone control. (B) Same as (A) except mRNA levels were examined. (C) EGR1 pre-mRNA (left) and mRNA (right) levels were examined after serum starvation and induction as described in the text. The values are the mean of three experiments with standard deviation. The fold differences between pcFl-ORF57II and pcDNA transfected cells are listed above the brackets; p-values for these differences are shown in red (unpaired two-tailed Student’s t-test). Both pre-mRNA and mRNA values are relative to the uninduced (t = 0), vector alone EGR1 mRNA sample, which was set to 100 (dotted line). Therefore, the relative amounts of EGR1 pre-mRNA can be compared to those of EGR1 mRNA in this graph.
Fig 9
Fig 9. Model for ORF57-mediated regulation of host pre-mRNAs.
(A) Models of pre-mRNA and mRNA balance for host ORF57 targets in (A) absence or (B) presence of ORF57. While ORF57 is the only protein depicted, it is likely to be in complex with other host proteins, (e.g. TREX, SR proteins, the cap-binding complex). The pacman represents an unidentified host RNA decay pathway. Briefly, the host pre-mRNAs are subject to competing RNA decay and splicing pathways (A). When bound by ORF57 (B), the pre-mRNAs are stable which results either in the accumulation of pre-mRNAs (“Dead-end”) or their stabilization allows these pre-mRNAs to be further spliced to produce functional mRNAs (“Precursor”). See Discussion for the details of the models.

Similar articles

Cited by

References

    1. Staudt MR, Dittmer DP (2003) Viral latent proteins as targets for Kaposi“s sarcoma and Kaposi”s sarcoma-associated herpesvirus (KSHV/HHV-8) induced lymphoma. Curr Drug Targets Infect Disord 3: 129–135. - PubMed
    1. Ruocco E, Ruocco V, Tornesello ML, Gambardella A, Wolf R, et al. (2013) Kaposi's sarcoma: etiology and pathogenesis, inducing factors, causal associations, and treatments: facts and controversies. Clin Dermatol 31: 413–422. 10.1016/j.clindermatol.2013.01.008 - DOI - PMC - PubMed
    1. Dittmer DP, Damania B (2013) Kaposi sarcoma associated herpesvirus pathogenesis (KSHV)—an update. Current Opinion in Virology 3: 238–244. 10.1016/j.coviro.2013.05.012 - DOI - PMC - PubMed
    1. Mesri EA, Cesarman E, Boshoff C (2010) Kaposi's sarcoma and its associated herpesvirus. Nat Rev Cancer 10: 707–719. 10.1038/nrc2888 - DOI - PMC - PubMed
    1. Toth Z, Brulois K, Jung JU (2013) The chromatin landscape of Kaposi's sarcoma-associated herpesvirus. Viruses 5: 1346–1373. 10.3390/v5051346 - DOI - PMC - PubMed

Publication types

MeSH terms

Substances

Associated data