. 2015 Apr;25(4):459-76.
doi: 10.1038/cr.2015.24. Epub 2015 Feb 24.

ADAR1 is required for differentiation and neural induction by regulating microRNA processing in a catalytically independent manner

Affiliations

ADAR1 is required for differentiation and neural induction by regulating microRNA processing in a catalytically independent manner

Tian Chen et al. Cell Res. 2015 Apr.

Abstract

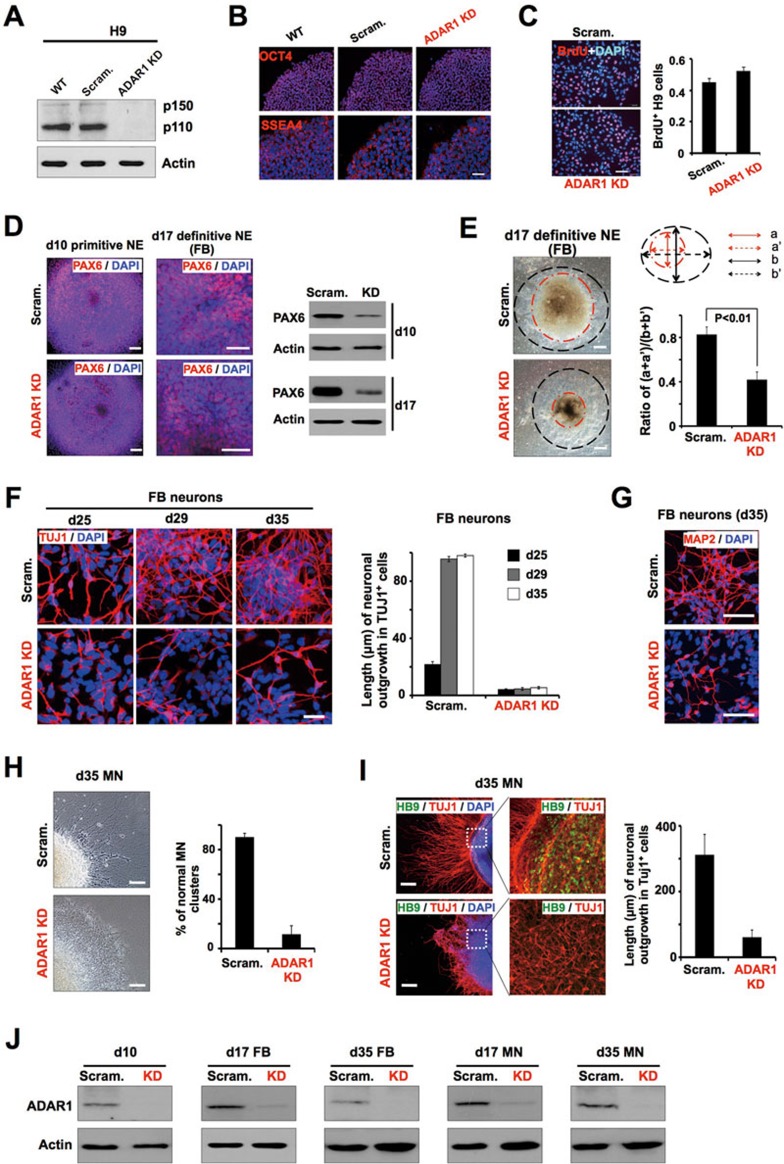
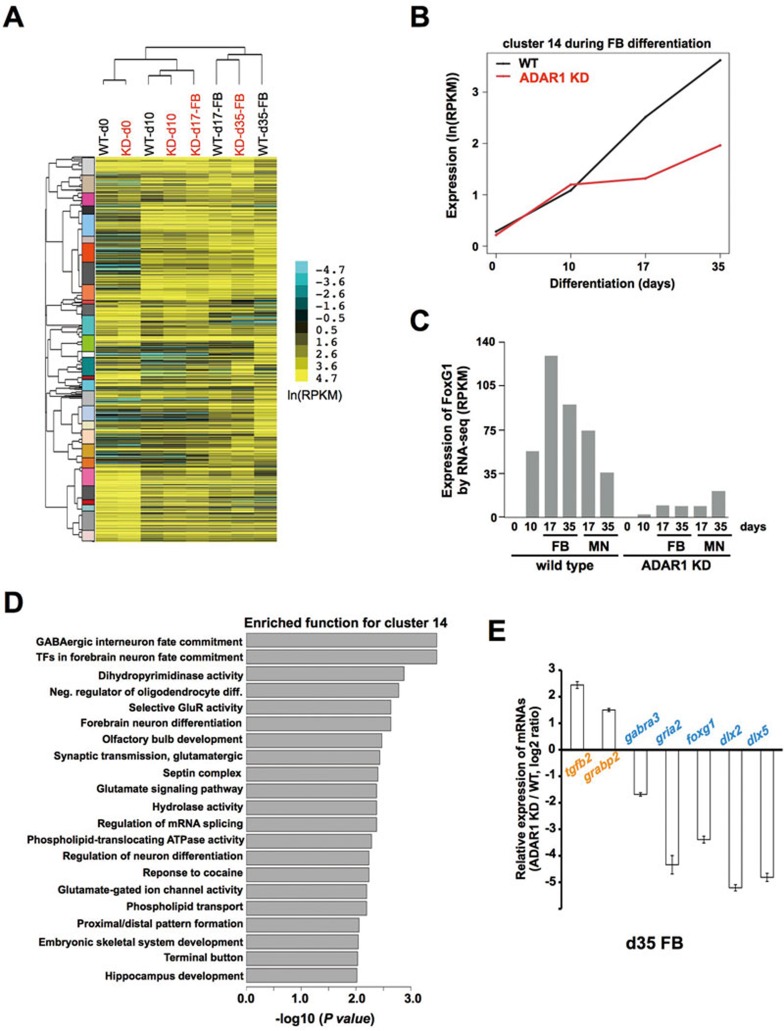
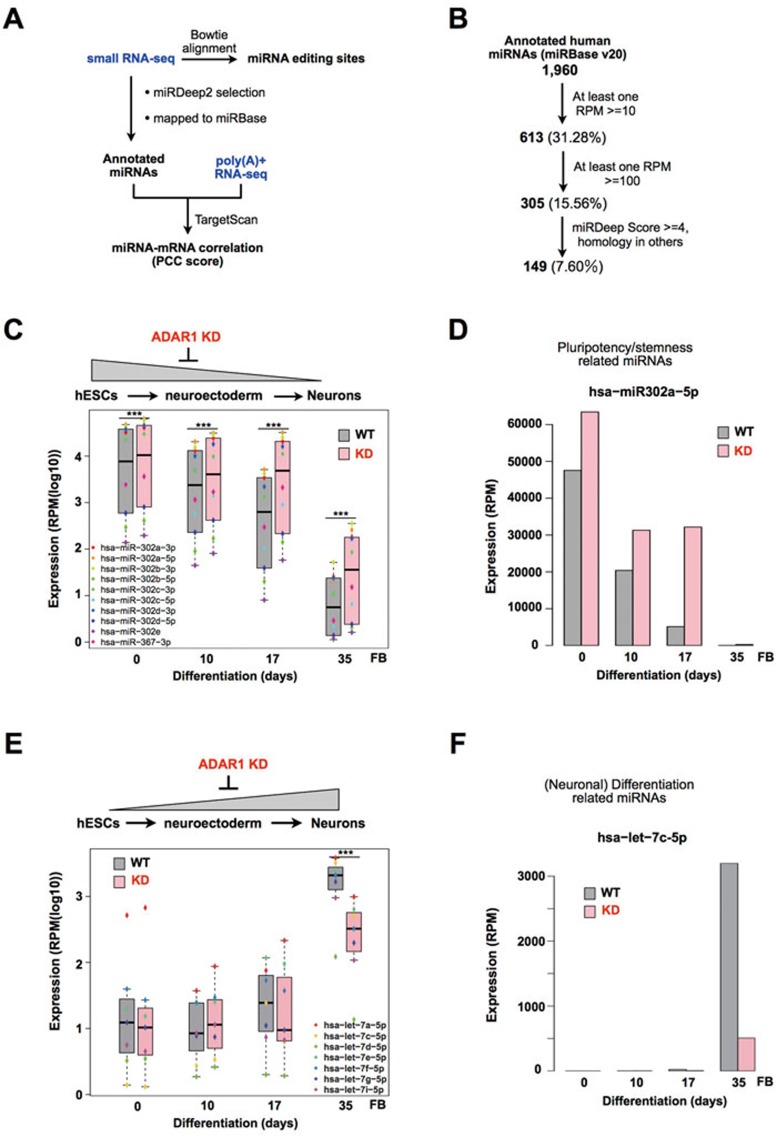
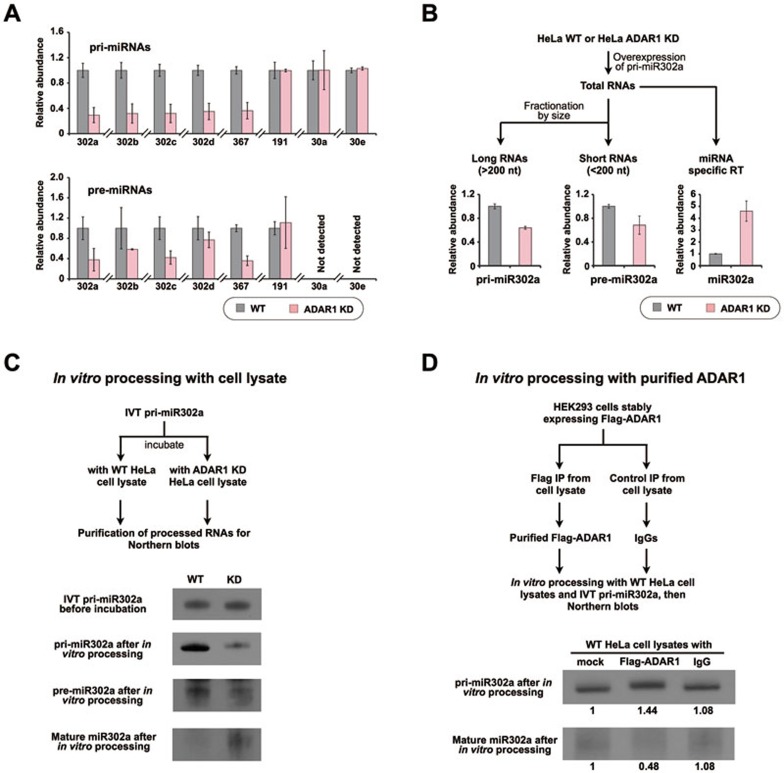
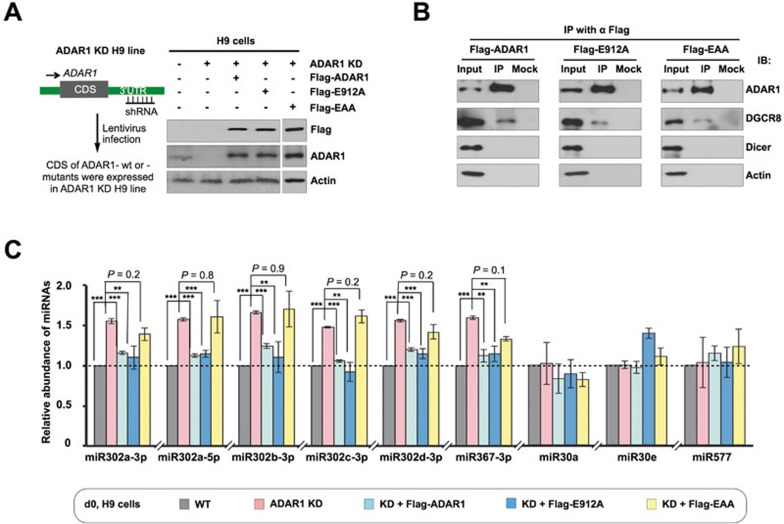
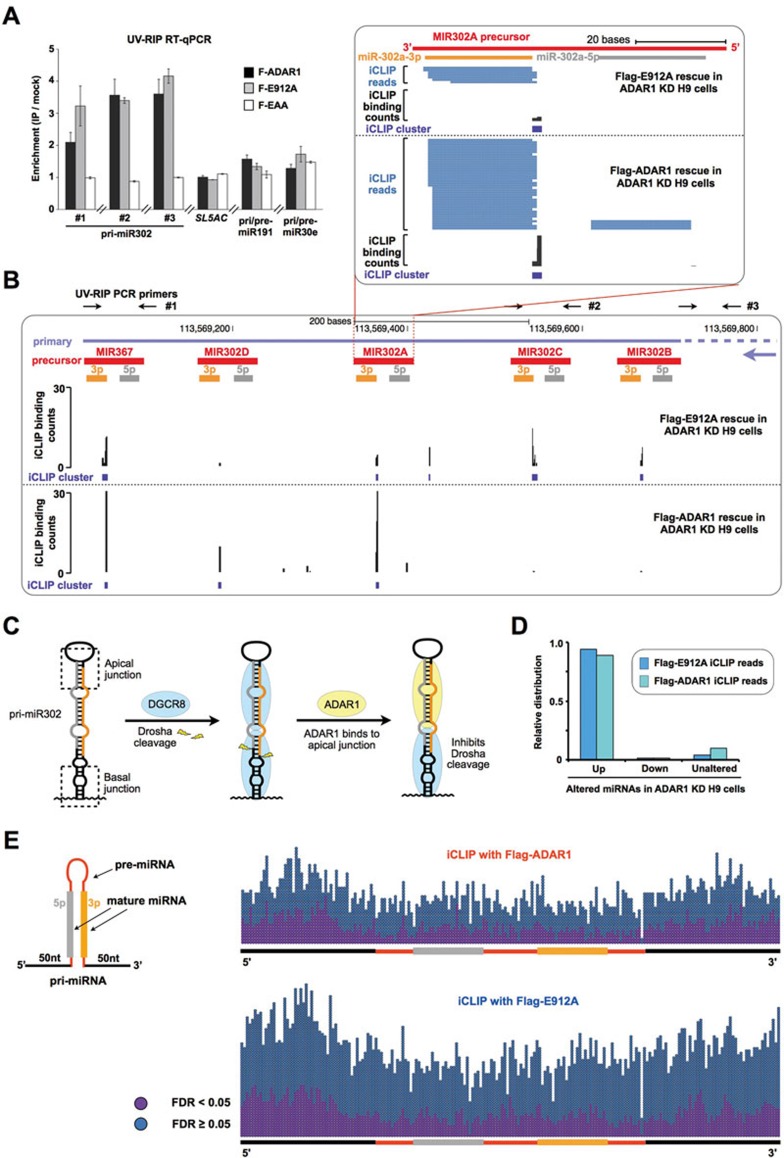
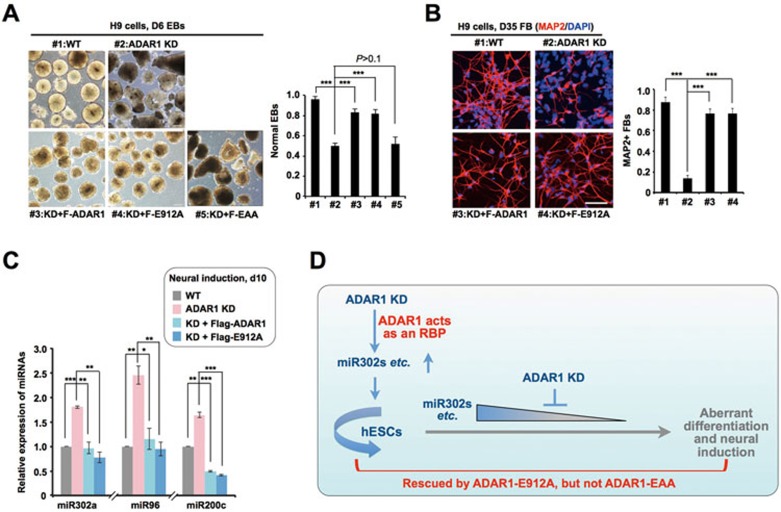
Adenosine deaminases acting on RNA (ADARs) are involved in adenosine-to-inosine RNA editing and are implicated in development and diseases. Here we observed that ADAR1 deficiency in human embryonic stem cells (hESCs) significantly affected hESC differentiation and neural induction with widespread changes in mRNA and miRNA expression, including upregulation of self-renewal-related miRNAs, such as miR302s. Global editing analyses revealed that ADAR1 editing activity contributes little to the altered miRNA/mRNA expression in ADAR1-deficient hESCs upon neural induction. Genome-wide iCLIP studies identified that ADAR1 binds directly to pri-miRNAs to interfere with miRNA processing by acting as an RNA-binding protein. Importantly, aberrant expression of miRNAs and phenotypes observed in ADAR1-depleted hESCs upon neural differentiation could be reversed by an enzymatically inactive ADAR1 mutant, but not by the RNA-binding-null ADAR1 mutant. These findings reveal that ADAR1, but not its editing activity, is critical for hESC differentiation and neural induction by regulating miRNA biogenesis via direct RNA interaction.


Figures

Figure 1
Figure 1
ADAR1 knockdown significantly represses neural induction and neuronal differentiation. (A) Generation of ADAR1 KD H9 stable cell lines. Western blotting (WB) confirms the stable knockdown of ADAR1 by shRNA targeting ADAR1 in H9 cells, but not in scramble shRNA-treated H9 cells (Scram). Actin was used as a loading control. (B) Loss of ADAR1 has little effect on pluripotency of hESCs. WT, scramble shRNA-treated (Scram) and ADAR1 KD H9 cells were stained with anti-Oct4 and anti-SSEA4. Nuclei were counterstained with DAPI. Scale bar, 50 μm. (C) Loss of ADAR1 has no significant effect on proliferation of hESCs. Left, representative images of proliferating cells with BrdU incorporation in scramble control and ADAR1 KD H9 cells. Right, statistical analyses for BrdU+ cells. Scale bar, 50 μm. (D) Columnar NE cells derived from ADAR1 KD H9 cells express a low level of PAX6. Immunostaining (left) and WB (right) show the expression of PAX6 in scramble control and ADAR1 KD H9 lines at neural induction d10 and d17. Scale bar, 50 μm. (E) The generation of definitive NE cells from ADAR1 KD H9 cells is less efficient than that from control cells. Left, representative images at d17 neural induction of scramble control and ADAR1 KD H9 cells. After EB attachment, columnar NE cells appear in the colony center at d10 and proliferate quickly and form multiple layers (red dotted line), whereas cells in the periphery gradually become flattened (between black and red dotted line). Right, a and a′ represent the diameter of the NE cluster, and b and b′ represent the diameter of the differentiating colony. Ratio of (a+a′)/(b+b′) indicated the approximate percentage of NE cells in the colony. P value from one-tail t-test is shown. (F, G) ADAR1 knockdown represses the formation of human FB neurons. Left, representative images of d25-d35 neural induction of scramble control and ADAR1 KD H9 cells. Cells were stained with anti-Tuj1. Right, the length of neurites in Tuj1+ cells was measured after the indicated differentiation days of control and ADAR1 KD H9 cells towards FB neuron differentiation (F). Neural induction of control and ADAR1 KD hESCs at d35 was shown by MAP2 staining (G). Scale bar, 50 μm. (H-I) ADAR1 knockdown retards the formation of human MNs. Left, representative images showing the repression of the formation of MN clusters derived from ADAR1 KD H9 cells. Right, the percentage of MN clusters derived from scramble control and ADAR1 KD H9 cells (H). Left, representative images showing the retardation of MN formation. Cells were stained with anti-Tuj1 and anti-HB9. Right, the length of neurites in Tuj1-positive cells was measured in MNs (d35) derived from control and ADAR1 KD H9 cells (I). (J) ADAR1 expression was maintained at very low level under ADAR1 knockdown condition upon neural induction and neuronal specification in H9 cells, as revealed by WB. Actin was used as a loading control. In C, E, F, H and I, error bars represent ± SD of triplicate experiments. Also see Supplementary information, Figures S1 and S2 and Table S1.
Figure 2
Figure 2
Effects of ADAR1 knockdown on gene expression in H9 cells upon FB neuron differentiation. (A) Repression of neuron-specific gene expression in ADAR1 KD H9 cells upon FB neuron differentiation. Heat map showing the hierarchical clustering of expression profiles of differentially expressed genes (DEGs) as measured by RNA-seq. Pairwise distances were measured by Pearson correlation coefficient (PCC). Different gene clusters are labeled beside the gene tree with different colors. The data shown in the maps are logarithm transformed expression values (ln(RPKM)). (B) ADAR1 KD hESCs exhibit clusters of repressed neuronal gene expression upon FB neuron differentiation. A representative cluster (#14) containing 102 genes was significantly repressed in ADAR1 KD H9 cells after the induction of NE (d10; P = 1.9e-7 for d17, or P < 2.2e-16 for d35, Student's t-test). (C) Histograph of RNA-seq results showing that FoxG1 was repressed during hESC differentiation into neurons with ADAR1 knockdown. (D) Cluster 14 was enriched for genes with neuronal functions. The enrichment P value cut-off is set to a significance value of 0.01 after Benjamini-Hochberg correction. (E) Verification of RNA-seq using RT-qPCR analysis. Error bars represent ± SD of triplicate experiments. Also see Supplementary information, Figure S3, Tables S1 and S2.
Figure 3
Figure 3
ADAR1 knockdown alteres miRNA expression. (A) A schematic depiction of miRNA analysis. Known miRNA A-to-I editing sites were first examined from our small RNA-seq data sets. miRNA expression was further evaluated with miRDeep2. Predicted regulatory targets of all highly expressed miRNAs were retrieved by TargetScan. The correlation of miRNA and mRNA expression was calculated by PCC using the paired RNA-seq and small RNA-seq data sets (Supplementary information, Table S4). (B) Selection of highly expressed miRNAs. About 1 960 known miRNAs were retrieved with default miRDeep2 pipeline. 305 highly expressed (≥ 100 RPM) known miRNAs (Supplementary information, Table S5) were subjected to further analysis. (C) Downregulation of the miR302 cluster is delayed in ADAR1 KD H9 cells upon differentiation into FB neurons. Each colored dot represents the expression level of a corresponding miR302 family miRNA (P = 4.5e-8 for d0, 2.4e-7 for d10, 1.4e-11 for d17 or 1.8e-4 for d35, pairwise t-test). (D) Expression of hsa-miR-302a-5p at differentiation time points examined in WT and ADAR1 KD H9 cells. (E) Upregulation of the let-7 cluster expression is repressed in ADAR1 KD H9 cells upon differentiation to FB neurons. Each colored dot represents the expression level of a corresponding let-7 family miRNA (P = 1.2e-5 for d35, pairwise t-test). (F) Expression of hsa-let-7c-5p at differentiation time points examined in WT and ADAR1 KD H9 cells. Also see Supplementary information, Figure S4.
Figure 4
Figure 4
ADAR1 knockdown promotes the processing from pri-miR302s to mature miR302s. (A) Knockdown of ADAR1 led to reduced expression of pri-miR302s (top, normalized to gapdh mRNA) and pre-miR302s (bottom, normalized to U6), but not miR191, miR30a and miR30e. Error bars represent ± SD of triplicate experiments. (B) Pri-miR302a processing in WT or ADAR1 KD HeLa cells. Long (> 200 nt) pri- and short (< 200 nt) pre-miRNAs were fractionated according to their sizes and were then used for RT-qPCR to quantify the relative abundance of pri- or pre-miR302a. Mature miRNA was measured from total RNAs with miScript II RT-qPCR. Error bars represent ± SD of triplicate experiments. (C) ADAR1 knockdown promotes miR302 maturation. IVT pri-miR302a was incubated with either WT or ADAR1 KD HeLa cell lysates. After incubation, RNAs were extracted for northern blot with denaturing PAGE gels. Pre-mixtures without incubation were loaded as controls. Note that matured miR302a was more abundant after the incubation with ADAR1 KD HeLa cell lysate than that with WT cell lysate. Triplicated experiments were performed and one representative is shown. (D) ADAR1 inhibits pri-miR302 processing. IVT pri-miR302a was incubated with ADAR1 KD HeLa cell lysates in the presence or absence of partially purified Flag-ADAR1 according to the protocol published previously. After incubation, RNAs were extracted for northern blot with denaturing PAGE gels. Note that the processing of miR302a was repressed with the addition of ADAR1. Triplicated experiments were performed and one representative is shown. The relative abundance of pri-miR302a and mature miR302a was determined using Image J and labeled underneath. Also see Supplementary information, Figure S5.
Figure 5
Figure 5
The RNA-binding property of ADAR1 affects miR302 processing from pri-miR302s. (A) Rescue of ADAR1 expression in H9 cells by Flag-ADAR1, Flag-E912A or Flag-EAA. Left, a drawing showing the generation of ADAR1-rescued ADAR1 KD H9 cells by lentiviral infection. Right, WB confirms their expression in ADAR1 KD H9 cells. (B) Immunoprecipitation of Flag-ADAR1, Flag-E912A (catalytically inactive mutant), or Flag-EAA (RNA-binding-null mutant) from HEK293 cells extracts, followed by immunoblotting with ADAR1, DGC8 and DICER antibodies. (C) Flag-E912A, but not Flag-EAA, reversed the upregulation of miR302s in ADAR1 KD H9 cells. RT-qPCR revealed the expression of miR302s, miR30a, miR30e and miR577 (normalized to U6) in control, ADAR1 KD, KD+Flag-ADAR1, KD+Flag-E912A and KD+Flag-EAA H9 lines. Error bars represent ± SD of triplicate experiments. P values from one-tail t-tests are shown. Also see Supplementary information, Figure S5.
Figure 6
Figure 6
ADAR1 binds to pri-miR302s and interferes with processing. (A) UV crosslinking RIP confirms that both Flag-ADAR1 and Flag-E912A, but not Flag-EAA, are associated with the polycistronic primary transcript of miR302s. Note that non-altered miRNAs, such as miR191 and miR30e, were not precipitated by ADAR1 proteins. qPCR primers for pri-miR302 detection are labeled as black arrows in B. Error bars represent ± SD of triplicate experiments. (B) iCLIP-seq defines that Flag-ADAR1- and Flag-E912A-binding sites are located within pri-miR302 hairpins. Individual Flag-ADAR1 and Flag-E912A iCLIP-seq reads (in blue) or iCLIP binding counts (in black) were aligned to pri-miR302s, with the mature miRNA boundaries depicted below (orange and gray bars). The iCLIP clusters are depicted as purple rectangles. (C) Two DGCR8 dimers clamp a pri-miRNA hairpin and activate Drosha cleavage (middle). The binding of ADAR1 to hairpins of pri-miR302s competes with DGCR8 binding, resulting in an inhibitory effect on pri-miR302 processing (right). (D) The majority of Flag-ADAR1 and Flag-E912A iCLIP reads are located in pri-miRNA regions of the upregulated miRNA targets after ADAR1 knockdown in H9 cells. (E) Flag-ADAR1 and Flag-E912A bind to pri-miRNAs with no sequence specificity. iCLIP clusters, significant (purple points) or non-significant (blue points), were scattered evenly on pri-miRNAs for both Flag-ADAR1 (right panel, top) and Flag-E912A (right panel, bottom). Also see Supplementary information, Figures S5, S6 and Table S6.
Figure 7
Figure 7
Catalytically inactive Flag-E912A rescues the retarded neural induction and aberrant miRNA expression upon differentiation in ADAR1 KD H9 cells. (A) Flag-E912A, but not Flag-EAA, could reverse the aberrant EB formation derived from ADAR1 KD H9 cells. Left, representative images of EBs derived from different H9 cell lines. Right, the percentage of morphologically normal EBs derived from different H9 cell lines (n > 200). (B) Flag-E912A restored the repressed neural induction in ADAR1 KD H9 cells. Left, representative images of MAP2+ FB neurons derived from different H9 cell lines. Right, the percentage of MAP2+ cells derived from different H9 cell lines (n > 200). (C) Flag-E912A reversed the upregulation of neural induction repression-related miRNAs in ADAR1 KD H9 cells at d10 upon neural induction, as revealed by RT-qPCR (normalized to U6). (D) A model for ADAR1 regulation in hESC self-renewal and differentiation. ADAR1 inhibits the processing of pri-mi302s and other miRNAs in hESCs upon differentiation by acting as a dsRNA-binding protein. In A, B and C, error bars represent ± SD of triplicate experiments. P values from one-tail t-tests are shown.

Similar articles

Cited by

References

    1. Bass BL. RNA editing by adenosine deaminases that act on RNA. Ann Rev Biochem. 2002;71:817–846. - PMC - PubMed
    1. Nishikura K. Functions and regulation of RNA editing by ADAR deaminases. Ann Rev Biochem. 2010;79:321–349. - PMC - PubMed
    1. Burns CM, Chu H, Rueter SM, et al. Regulation of serotonin-2C receptor G-protein coupling by RNA editing. Nature. 1997;387:303–308. - PubMed
    1. Higuchi M, Maas S, Single FN, et al. Point mutation in an AMPA receptor gene rescues lethality in mice deficient in the RNA-editing enzyme ADAR2. Nature. 2000;406:78–81. - PubMed
    1. Hoopengardner B, Bhalla T, Staber C, Reenan R. Nervous system targets of RNA editing identified by comparative genomics. Science. 2003;301:832–836. - PubMed

Publication types

MeSH terms

Associated data