. 2015 Apr;16(4):415-25.
doi: 10.1038/ni.3115. Epub 2015 Feb 23.

The RNA-binding protein HuR is essential for the B cell antibody response

Affiliations

The RNA-binding protein HuR is essential for the B cell antibody response

Manuel D Diaz-Muñoz et al. Nat Immunol. 2015 Apr.

Abstract

Post-transcriptional regulation of mRNA by the RNA-binding protein HuR (encoded by Elavl1) is required in B cells for the germinal center reaction and for the production of class-switched antibodies in response to thymus-independent antigens. Transcriptome-wide examination of RNA isoforms and their abundance and translation in HuR-deficient B cells, together with direct measurements of HuR-RNA interactions, revealed that HuR-dependent splicing of mRNA affected hundreds of transcripts, including that encoding dihydrolipoamide S-succinyltransferase (Dlst), a subunit of the 2-oxoglutarate dehydrogenase (α-KGDH) complex. In the absence of HuR, defective mitochondrial metabolism resulted in large amounts of reactive oxygen species and B cell death. Our study shows how post-transcriptional processes control the balance of energy metabolism required for the proliferation and differentiation of B cells.


Figures
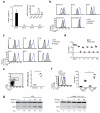
Figure 1
Figure 1. HuR expression is increased during B cell activation
(a) qPCR analysis of Elavl1 (HuR), Elavl2, Elavl3 and Elavl4 mRNA expression in ex vivo splenic B cells (n=6) and brain (n=2). Data shown relative to Elavl1 mRNA expression (ND = not detected). (b) Intracellular HuR staining in B cell subsets in the bone marrow (BM). (c) HuR protein expression in splenic B cell subsets. B cell populations in BM and spleen in Mb1-Cre (unfloxed controls, Ctrl.) and Elavl1fl/flMb1-Cre (HuR-cKO) mice were analysed by flow cytometry as described in online methods. (d) Quantification of HuR expression. Median Fluorescence Intensity (MFI) of HuR staining relative to an isotype control (IC) antibody is shown (n=3 biological replicates). Dashed line indicates the detection limit of the assay. (e) Normalised HuR mRNA expression in GC B cells (B220+CD95+PNA+) relative to the expression of HuR mRNA in non-GC B cells (B220+PNACD95). A representative dot plot is shown to indicate cell sorting strategy. Cells from individual mice were isolated independently for mRNA expression analysis. Data from each individual sample and the mean value are shown (n=3-4 per group, unpaired t-test). (f) HuR protein expression in non-GC and GC B cells from individual immunised mice measured by flow cytometry. Data from each individual sample and the mean value are shown. (n=6, unpaired t-test). Histograms and dot plots shown in b, c, e and f are representative of more than 3 independent stainings using individual mice. (g) Time course analysis of HuR expression after in vitro B cell activation with LPS or αCD40+IL-4+IL-5. Immunoblots are representative of four (activation with LPS) or two (activation with αCD40+IL-4+IL-5) independent experiments respectively. In each experiment, HuR (Abs794) expression was normalised by β-actin levels and quantified relative to non-activated B cells. Data is shown as mean value.
Figure 2
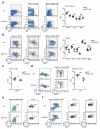
Figure 2. HuR-cKO mice have no major defects in B cell development
(a) Analysis of B cell populations in the bone marrow of Mb1-Cre (Ctrl) and Elavl1fl/flMb1-Cre (HuR-cKO) mice. Representative dot plots summarise the cell gating strategy and cell frequency. The number of Pre-, immature-, and mature-B cells was calculated based on the expression of surface cell markers. (b) Quantitation of the number of different B cell subsets in the spleen of Ctrl. and HuR-cKO mice. T1, T2, T3, FO and MZ B cells were defined based on cell surface markers as described in the online methods. (c) Analysis of the number of CD19+ cells in peripheral lymph nodes. (d) Analysis of B1 B cells in the peritoneal cavity. Representative dot plots summarise the cell gating strategy and cell frequency. Analysed data shown in a, b, c and d are from individual mice of each genotype and is representative of more than 3 independent experiments (n=8 per group; Mann-Whitney analysis was performed; *p<0.05, **p<0.005, ***p<0.0005). (e) Representative flow cytometry plots of BrdU incorporation in Pre-B cells after 2.5 hours labelling. The mean percentage ± SD of BrdU+ cells is shown (n=8 per group). (f) Analysis of BrdU+ mature B cells following 7 days labelling. Representative dot plots and contour plots are shown. The mean percentage ± SD of BrdU+ cells is shown (n=5 individual mice per group).
Figure 3
Figure 3. B cells require HuR for responses to different classes of antigens
(a) Quantitation of serum immunoglobulin in non-immunised mice. Samples from individual Mb1-Cre (Ctrl) and Elavl1fl/flMb1-Cre (HuR-cKO) mice were collected in two independent experiments (n=10; Mann-Whitney test). (b, c) Analysis of NP-reactive IgM and IgG3 antibodies present in serum samples from individual mice of each genotype collected 7 days after immunization with NP-LPS (b) or NP-Ficoll (c). Dot line indicates the limit of detection in this assay (n=6 per group in b; n=6-7 per group in c; Mann-Whitney test). (d) Time course analysis of NP23 reactive IgM and IgG1 in serum of mice immunised with NP-KLH at day 0 and day 42. (e) Ratio of NP2- bound (high affinity) and NP23-bound (low + high affinity) IgG1 antibodies. Data is shown in d and e as mean ± SEM, n=6/group. Statistical analysis of the data at each time point was performed using a Mann-Whitney test (p<0.005 in all cases). (f) The number of GC B cells present in the spleen of Mb1-Cre (Ctrl) and HuR-cKO mice seven days after immunization with NP-KLH. Representative dot plots show the gating strategy and frequency of GC B cells (B220+ PNA+ CD95+ cells). The number of GC cells in individual mice of each genotype (n= 7-8 mice) from one of the two independent experiments performed is shown (Mann-Whitney test). (g) ELISPOT of the number of IgM and IgG1 ASC present in the spleens of the mice analysed in f (n=7-8, Mann-Whitney test). (h, i) Quantitation of IgM-ASC and IgG1-ASC present in spleen (h) and BM (i) of Mb1-Cre (Ctrl.) and HuR-cKOmice seven days after secondary immunization. Data from each individual mice of each group is shown (n=7-8; Mann-Whitney test) (*p<0.05, **p<0.005, ***p<0.0005).
Figure 4
Figure 4. Genes involved in energy metabolism are deregulated in HuR-deficient B cells
(a) Analysis of the fold change in mRNA expression and mRNA translation (HuR-cKO/Ctrl) of those genes involved in cell energy pathways (Glycolysis and Gluconeogenesis, TCA Cycle and Electron Transport Chain) that are differentially translated in the absence of HuR (number of genes=25). mRNAseq and Ribo-seq libraries were generated in two independent experiments using LPS-activated splenic B cells from Elavl1fl/flMb1+/+ (Ctrl) and Elavl1fl/flMb1-Cre (HuR-cKO) mice (RNAseq, n=3-4 per group; Ribo-seq, n=5 per group). (b) Statistical significance of changes in mRNA expression and translation of the genes shown in a. P adjusted values (padj) were calculated after multiple correction of p values (Benjamini-Hochberg correction) obtained from DESeq analysis of RNAseq and Ribo-seq datasets. (c) Dlst mRNA splicing profiles in Ctrl and HuR-cKO B cells. Representative sashimi plots were generated in IGV. The exon number and read counts across each exon-exon junction are indicated for representative mRNAseq data from ex vivo and mitogen activated B cells. HuR iCLIP data for the Dlst locus collected from three independent experiments is shown as unique single nucleotide crosslink sites.
Figure 5
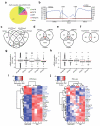
Figure 5. HuR regulates intron usage in B cells
(a) Proportion of unique HuR crosslink sites annotated to each genomic features. The sum of unique cDNA counts from three independent iCLIP experiments performed with LPS-activated B cells (Supplementary Fig. 5) was used for peak call analysis (FDR<0.05) and quantification of HuR crosslink sites. (b) RNA map of crosslink sites assessed at the exon-intron boundaries (BP=branch point; 5′ SS=5′ splice site; 3′ SS=3′ splice site). (c) Correlation between HuR binding and differential intron expression in HuR-cKO B cells. (d) Venn-diagram showing the relationship between genes with differential intron expression (Genes), differential mRNA expression (mRNAs) and mRNA bound by HuR (Targets). (e) Relationship between genes with differential intron expression (Genes), differential ribosome occupancy (mRNAs) and HuR binding (Targets). (f) Identification of mRNAs with differential intron expression which are both differentially expressed and differentially translated. (g) Global analysis of the fold change (HuR-cKO/Ctrl) (log2) in mRNA expression of all genes; genes with differential intron expression (group 1; n=375); HuR-targeted genes with differential intron usage and differential RNA abundance (group 2; n=64); HuR-targeted genes with differential intron usage and differential ribosome occupancy (group 3; n=71); and HuR-targeted genes with differential intron expression which are both differentially expressed and differentially translated (group 4; n=25). (h) Global analysis of the fold change (HuR-cKO/Ctrl) (log2) in ribosome occupancy in the groups described in g. Data in g and h is shown as box whisker plots showing the mean ± SD and 10-90 percentiles. Wilcoxon signed-rank test was performed between each group against all genes (* p<0.05, ** p<0.005). (i) Heatmap of the fold change (HuR-cKO/Ctrl) (log2) in mRNA expression of genes in group 4. (j) Heatmap showing the fold change (HuR-cKO/Ctrl) (log2) in ribosome occupancy of genes in group 4. Genes previously annotated as alternative spliced are highlighted in blue.
Figure 6
Figure 6. Alternative splicing of Dlst in HuR-cKO B cells reduces αKGDH enzymatic activity
(a) Design summary of PCR primers, spanning exon 10/intron 10 junction and intron 10/exon 11 junction, used to detect intron inclusion in Elavl1fl/flMb1-Cre (HuR-cKO) B cells. Intron inclusion in ex vivo and LPS-activated B cells was quantified relative to Elavl1fl/flMb1+/+ (Ctrl) cells. (b) PCR across the exon 10/exon 11 junction. The percentage of alternative exon inclusion was calculated after gel density quantification of long (alternative exon included) and short (alternative exon skipped) amplicons. Data in a and b was from 6 (naïve cells) or 4 (LPS-treated cells) biological replicates collected in two independent experiments and is shown as mean values ± SD (unpaired t test; * p<0.05, *** p<0.0005). Images are representative. (c) Dlst reads measured by mRNAseq in ex vivo and LPS-activated B cells from Ctrl and HuR-cKO mice. Mean normalised read counts ± SD are shown (n=3-4 per group; differential expression analysis performed with DESeq; *padj<0.05, ***padj < 0.0005). (d) Quantification of ribosome footprints mapped to Dlst mRNA. Data from ex vivo and LPS-activated B cells is shown as mean normalised read counts ± SD (n=4-5 per group; differential expression analysis performed using DESeq2; ***padj < 0.0005). (e) Immunoblot analysis of Dlst protein. Total protein lysates were prepared from ex vivo and LPS-activated splenic B cells from Elval1fl/flMb1+/+ (Ctrl) and HuR-cKO mice in three independent experiments and loaded in the same gel. β-actin was detected as sample loading control. (f) Gel density quantification of Dlst protein abundance relative to β-actin (n=3 per group; unpaired t test; *p<0.05). (g) αKGDH enzymatic activity in total cell extracts from ex vivo B cells collected from individual Elavl1fl/flMb1+/+ (Ctrl.) and HuR-cKO mice (Mean ± SD; n=4 per group from two independent experiments; unpaired t test; *p<0.05).
Figure 7
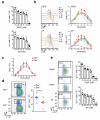
Figure 7. αKGDH enzymatic activity is required for B cell survival and proliferation
(a) Viability of splenic B cells activated with LPS + IL-4 (96 h) in the presence of the indicated doses of succinyl phosphonate (SP) or phosphonoethyl ester of succinyl phosphonate (PESP). Data from one of the two independent experiments performed is shown as mean ± SD (n=4 per group; unpaired t tests comparing control samples against each different dose; *p<0.05, **p<0.01, ***p<0.001). (b) Representative CellTrace Violet (CTV) dye profiles in the presence of SP and PESP. The number of cells in each generation was calculated based on dye dilution. (c) In vitro proliferation of Dlst+/+ and Dlst+/− splenic B cells after activation with LPS + IL-4 for 96 hours analysed by CellTrace Violet dye dilution as described in b. Splenic B cells were isolated from 6 different mice and treated separately in two independent experiments. Data are shown as the mean number of cells per generation ± SD. Two way ANOVA test was performed (p=0.0162). (d) Quantification of the number of IgG1+ cells in cultures described in c. Representative plots show CellTrace Violet dye dilution versus IgG1 surface expression. Unpaired Student’s t test was performed for statistical analysis of the data (n=6; *p<0.05). (e) Analysis of CSR in the cultures in a. Representative plots and the mean number of IgG1+ cells ± SD from one of the two independent experiments are shown (n=4 per group; unpaired Student’s t test comparing no treated cells against the other conditions; *p<0.05, **p<0.01, ***p<0.001).
Figure 8
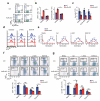
Figure 8. ROS scavengers rescue HuR-deficient B cells from cell death
(a) Representative plots showing H2DCFDA and DAPI staining of Mb1-Cre (Ctrl) and HuR-cKO B cells after four hours of in vitro culture in the absence or presence of recombinant catalase (Cat, 20 U/ml). (b) Quantitation of the number of DAPI+ cells and the MFI of H2DCFDA in DAPI cells in the cultures described in a (Mean ± SD, n=3 per group). (c) Effect of Q-VD-OPh (3 μM) and Necrostatin-1 (Nec-1, 3 μM) on in vitro B cell survival (Mean number of DAPI cells ± SD, n=4 per group). (d) Representative CellTrace Violet dye profiles of LPS + IL-4 stimulated Mb1-Cre (Ctrl.) and HuR-cKO B cells cultured in complete RPMI media supplemented with catalase (20 U/ml), L-N-acetyl-cysteine (L-NAC, 10 mM) or EUK-134 (5 μM) for 96 hours. (e) Number of live cells in each cell generation of the proliferation profile shown in d (Mean ± SD, n=3 per group). (f) Representative plots and the mean number of IgG1+ cells ± SD. (g) Representative plots and the mean number of CD138+ cells ± SD is shown. Data shown in each figure panel is from one of the at least three independent experiments performed. Unpaired Student’s t tests were performed for statistical analysis of the data (*p<0.05,**p<0.01,***p<0.001).

Similar articles

Cited by

References

    1. Pearce EL, Poffenberger MC, Chang CH, Jones RG. Fueling immunity: insights into metabolism and lymphocyte function. Science. 2013;342:1242454. - PMC - PubMed
    1. Caro-Maldonado A, et al. Metabolic reprogramming is required for antibody production that is suppressed in anergic but exaggerated in chronically BAFF-exposed B cells. J Immunol. 2014;192:3626–3636. - PMC - PubMed
    1. Blair D, Dufort FJ, Chiles TC. Protein kinase Cbeta is critical for the metabolic switch to glycolysis following B-cell antigen receptor engagement. The Biochemical journal. 2012;448:165–169. - PubMed
    1. Nutt SL, Taubenheim N, Hasbold J, Corcoran LM, Hodgkin PD. The genetic network controlling plasma cell differentiation. Seminars in immunology. 2011;23:341–349. - PubMed
    1. Calado DP, et al. The cell-cycle regulator c-Myc is essential for the formation and maintenance of germinal centers. Nature immunology. 2012;13:1092–1100. - PMC - PubMed

Publication types

MeSH terms

Associated data