PT-1 selectively activates AMPK-γ1 complexes in mouse skeletal muscle, but activates all three γ subunit complexes in cultured human cells by inhibiting the respiratory chain
- PMID: 25695398
- PMCID: PMC5689378
- DOI: 10.1042/BJ20141142
PT-1 selectively activates AMPK-γ1 complexes in mouse skeletal muscle, but activates all three γ subunit complexes in cultured human cells by inhibiting the respiratory chain
Abstract
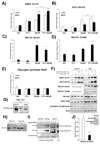
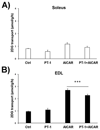
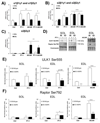
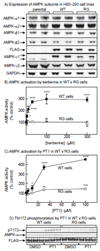
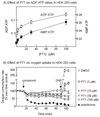
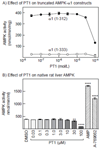
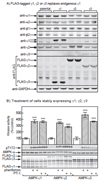
AMP-activated protein kinase (AMPK) occurs as heterotrimeric complexes in which a catalytic subunit (α1/α2) is bound to one of two β subunits (β1/β2) and one of three γ subunits (γ1/γ2/γ3). The ability to selectively activate specific isoforms would be a useful research tool and a promising strategy to combat diseases such as cancer and Type 2 diabetes. We report that the AMPK activator PT-1 selectively increased the activity of γ1- but not γ3-containing complexes in incubated mouse muscle. PT-1 increased the AMPK-dependent phosphorylation of the autophagy-regulating kinase ULK1 (unc-51-like autophagy-activating kinase 1) on Ser555, but not proposed AMPK-γ3 substrates such as Ser231 on TBC1 (tre-2/USP6, BUB2, cdc16) domain family, member 1 (TBC1D1) or Ser212 on acetyl-CoA carboxylase subunit 2 (ACC2), nor did it stimulate glucose transport. Surprisingly, however, in human embryonic kidney (HEK) 293 cells expressing human γ1, γ2 or γ3, PT-1 activated all three complexes equally. We were unable to reproduce previous findings suggesting that PT-1 activates AMPK by direct binding between the kinase and auto-inhibitory domains (AIDs) of the α subunit. We show instead that PT-1 activates AMPK indirectly by inhibiting the respiratory chain and increasing cellular AMP:ATP and/or ADP:ATP ratios. Consistent with this mechanism, PT-1 failed to activate AMPK in HEK293 cells expressing an AMP-insensitive R299G mutant of AMPK-γ1. We propose that the failure of PT-1 to activate γ3-containing complexes in muscle is not an intrinsic feature of such complexes, but is because PT-1 does not increase cellular AMP:ATP ratios in the specific subcellular compartment(s) in which γ3 complexes are located.
Figures

Similar articles
-
Benzimidazole derivative small-molecule 991 enhances AMPK activity and glucose uptake induced by AICAR or contraction in skeletal muscle.Am J Physiol Endocrinol Metab. 2016 Oct 1;311(4):E706-E719. doi: 10.1152/ajpendo.00237.2016. Epub 2016 Aug 30. Am J Physiol Endocrinol Metab. 2016. PMID: 27577855 Free PMC article.
-
α2 isoform-specific activation of 5'adenosine monophosphate-activated protein kinase by 5-aminoimidazole-4-carboxamide-1-β-D-ribonucleoside at a physiological level activates glucose transport and increases glucose transporter 4 in mouse skeletal muscle.Metabolism. 2006 Mar;55(3):300-8. doi: 10.1016/j.metabol.2005.09.003. Metabolism. 2006. PMID: 16483872
-
Differential regulation by AMP and ADP of AMPK complexes containing different γ subunit isoforms.Biochem J. 2016 Jan 15;473(2):189-99. doi: 10.1042/BJ20150910. Epub 2015 Nov 5. Biochem J. 2016. PMID: 26542978 Free PMC article.
-
AMP-activated protein kinase in metabolic control and insulin signaling.Circ Res. 2007 Feb 16;100(3):328-41. doi: 10.1161/01.RES.0000256090.42690.05. Circ Res. 2007. PMID: 17307971 Review.
-
[Participation AMPK in the regulation of skeletal muscles metabolism].Ross Fiziol Zh Im I M Sechenova. 2013 Jun;99(6):657-73. Ross Fiziol Zh Im I M Sechenova. 2013. PMID: 24459875 Review. Russian.
Cited by
-
AMPK activators: mechanisms of action and physiological activities.Exp Mol Med. 2016 Apr 1;48(4):e224. doi: 10.1038/emm.2016.16. Exp Mol Med. 2016. PMID: 27034026 Free PMC article. Review.
-
Benzimidazole derivative small-molecule 991 enhances AMPK activity and glucose uptake induced by AICAR or contraction in skeletal muscle.Am J Physiol Endocrinol Metab. 2016 Oct 1;311(4):E706-E719. doi: 10.1152/ajpendo.00237.2016. Epub 2016 Aug 30. Am J Physiol Endocrinol Metab. 2016. PMID: 27577855 Free PMC article.
-
Heterotypic endosomal fusion as an initial trigger for insulin-induced glucose transporter 4 (GLUT4) translocation in skeletal muscle.J Physiol. 2017 Aug 15;595(16):5603-5621. doi: 10.1113/JP273985. Epub 2017 Jul 10. J Physiol. 2017. PMID: 28556933 Free PMC article.
-
AMPK in skeletal muscle function and metabolism.FASEB J. 2018 Apr;32(4):1741-1777. doi: 10.1096/fj.201700442R. Epub 2018 Jan 5. FASEB J. 2018. PMID: 29242278 Free PMC article. Review.
-
Endothelial AMP-Activated Kinase α1 Phosphorylates eNOS on Thr495 and Decreases Endothelial NO Formation.Int J Mol Sci. 2018 Sep 13;19(9):2753. doi: 10.3390/ijms19092753. Int J Mol Sci. 2018. PMID: 30217073 Free PMC article.
References
-
- Arad M, Seidman CE, Seidman JG. Circ Res. 2007;100:474–488. - PubMed
-
- Barnes BR, Marklund S, Steiler TL, Walter M, Hjalm G, Amarger V, Mahlapuu M, Leng Y, Johansson C, Galuska D, Lindgren K, et al. J Biol Chem. 2004;279:38441–38447. - PubMed
-
- Barre L, Richardson C, Hirshman MF, Brozinick J, Fiering S, Kemp BE, Goodyear LJ, Witters LA. Am J Physiol Endocrinol Metab. 2007;292:E802–E811. - PubMed
-
- Carling D, Thornton C, Woods A, Sanders MJ. Biochem J. 2012;445:11–27. - PubMed
Publication types
MeSH terms
Substances
Grants and funding
LinkOut - more resources
Full Text Sources
Molecular Biology Databases
Miscellaneous

