. 2015 Feb 19;518(7539):360-364.
doi: 10.1038/nature14221.

Cell-of-origin chromatin organization shapes the mutational landscape of cancer

Affiliations

Cell-of-origin chromatin organization shapes the mutational landscape of cancer

Paz Polak et al. Nature. .

Abstract

Cancer is a disease potentiated by mutations in somatic cells. Cancer mutations are not distributed uniformly along the human genome. Instead, different human genomic regions vary by up to fivefold in the local density of cancer somatic mutations, posing a fundamental problem for statistical methods used in cancer genomics. Epigenomic organization has been proposed as a major determinant of the cancer mutational landscape. However, both somatic mutagenesis and epigenomic features are highly cell-type-specific. We investigated the distribution of mutations in multiple independent samples of diverse cancer types and compared them to cell-type-specific epigenomic features. Here we show that chromatin accessibility and modification, together with replication timing, explain up to 86% of the variance in mutation rates along cancer genomes. The best predictors of local somatic mutation density are epigenomic features derived from the most likely cell type of origin of the corresponding malignancy. Moreover, we find that cell-of-origin chromatin features are much stronger determinants of cancer mutation profiles than chromatin features of matched cancer cell lines. Furthermore, we show that the cell type of origin of a cancer can be accurately determined based on the distribution of mutations along its genome. Thus, the DNA sequence of a cancer genome encompasses a wealth of information about the identity and epigenomic features of its cell of origin.


Figures

Extended Data Figure 1
Correlation of mutation density measured in different cancer types.
Extended Data Figure 2
Chromatin features and replication data used in the models.
Extended Data Figure 3
Scatter plots of the measured number of somatic mutations per MB in different cancer genomes versus the number of mutations predicted by the Random Forest algorithm. The training set consisted of 10% of the data, while 90% was used to test the predictions.
Extended Data Figure 4
Prediction accuracy of the models trained on individual cancers as a function of the number of mutations. The red line represents the prediction accuracy of the model used to predict the mutation density of samples pooled by cancer type (sum of all mutations in individual cancers of a certain cancer type). N – number of individual cancers per cancer type.
Extended Data Figure 5
Sampling variance. Red: The squared correlation coefficient (R2) between the observed mutational profile and the profiles predicted by Random Forest. Blue: the maximal attainable variance explained, calculated as the average correlation coefficient squared (R2) between the mutational profiles predicted by Random Forest and 100 simulated mutational profiles modeled as a Poisson distribution with the mean predicted by epigenomic features. N – number of individual cancers per cancer type.
Extended Data Figure 6
Frequency of different types of mutations in different cancer types.
Extended Data Figure 7
Prediction accuracy of models obtained using different subsets of predictor variables. (A) Comparison of the prediction accuracy obtained using the full set of chromatin features, 38 chromatin features measured in cell types for which expression data was available, and expression data. Expression in 1MB windows was calculated using mRNA-seq reads mapping to either protein coding exons, protein coding and lncRNA exons, maximally expressed gene or non-genic regions, and normalized by the cumulative length of each of these regions, respectively. Bars represent the mean prediction accuracy; error bars represent standard errors of the mean prediction accuracy estimated using 10-fold cross-validation. (B) Distribution of the percent of variance explained in 10 folds of cross-validation (n=10) for models trained on chromatin, replication, expression (non-genic mRNA-seq) or sequence features, or a combination of these subsets of features. Models trained on chromatin features were compared to all other models for a certain cancer type (Wilcoxon rank-sum test). Significant differences, Benjamini–Hochberg-corrected: **P < 0.01, ***P < 0.001. Box plots, band inside the box, median; box, first and third quartiles; whiskers, most extreme values within 1.5 * inter-quartile range from the box; points, outliers.
Extended Data Figure 8
Feature selection by using the backward elimination procedure. For each cancer type, variables are ordered from top to bottom by decreasing importance. Each bar represents the fraction of variance explained by the model using the corresponding bar and all bars above it. The red line indicates the cutoff needed to achieve the prediction accuracy of the full model – 1 s.e.m. For each cancer type, features measured in related cell lines are shown in red.
Extended Data Figure 9
The number of mutations per megabase in COLO829 cell line versus DHS density in melanoma cell lines (DHS measured in 11 melanoma cell lines), melanocytes, DHSs specific to melanomas (not observed in melanocytes) and DHSs specific to melanocytes (not observed in melanomas). Correlation is calculated using the Spearman's rank correlation coefficient.
Figure 1
Figure 1
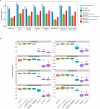
Mutation density in melanoma is associated with individual chromatin features specific to melanocytes. (a) The density of C>T mutations in melanoma alongside a 100kb window profile of melanocyte chromatin accessibility (“DNase I accessibility index”; shown in normalized, reverse scale; high values correspond to less accessible chromatin and vice versa). (b) The number of mutations per megabase in melanoma versus DHS density, for three types of skin cells. (c) The normalized density of mutations in liver cancer and melanoma genomes as a function of density quintiles of H3K4me1 marks in liver cells and in melanocytes. For both cancer genomes, mutation density depends only on H3K4me1 marks measured in the cell of origin.
Figure 2
Figure 2
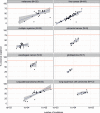
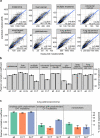
Predicting local mutation density in cancer genomes using Random Forest regression trained on 424 epigenomic profiles. Pearson correlation between observed and predicted mutation densities along chromosomes is shown. (a) Actual versus predicted mutation densities in eight cancers. (b, c) Prediction accuracy represented as mean ± s.e.m (estimated using 10-fold cross-validation). Panels show prediction accuracy for all mutations and for nucleotide changes predominant in the corresponding cancer (b), and prediction accuracy in lung adenocarcinoma genomes stratified by smoking history and predominant nucleotide changes (G>T or C>T) (c).
Figure 3
Figure 3
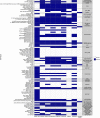
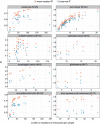
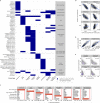
Epigenomic features that significantly contribute to the prediction of local mutation density. (a) Features (blue rectangles) significantly contributed to the predictions in at least one cancer type (see Methods). (b) Melanoma mutation density versus the density of chromatin modifications in melanocytes. (c) Prediction accuracy (mean ± s.e.m estimated using 10-fold cross-validation) of models separately trained on features from different tissues for each cancer type. Red bars: tissues with the highest prediction accuracy. Red line: prediction accuracy when using all 424 epigenetic features. (d) Comparison of predictions accuracies of liver cancer mutation density from features of normal liver cells vs. cancer cells (HepG2). (E) Mutation density in COLO829 melanoma cell line versus DHS density in COLO829, melanocytes, DHSs specific to COLO829 (not observed in melanocytes) and DHSs specific to melanocytes (not observed in COLO829). Spearman's rank correlation coefficient is given for each comparison.
Figure 4
Figure 4
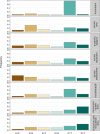
Analysis of individual cancer genomes and prediction of cell type of origin. (a) Principal coordinate analysis (PCOA) of the distribution of mutations in individual cancer genomes. Filled circles represent cancers for which the correct cell type of origin was identified. (b) The accuracy of cell type of origin prediction for individual cancer genomes: the number of cancer samples that were assigned to the correct (solid colors) or incorrect (textures) cell types of origin based on their mutation profile.

Comment in

  • Epigenetics: Chromatin marks the spot.
    Villanueva MT. Villanueva MT. Nat Rev Cancer. 2015 Apr;15(4):196-7. doi: 10.1038/nrc3934. Epub 2015 Mar 19. Nat Rev Cancer. 2015. PMID: 25786694 No abstract available.

Similar articles

Cited by

References

    1. Lawrence MS, et al. Mutational heterogeneity in cancer and the search for new cancer-associated genes. Nature. 2013;499:214–218. doi:10.1038/nature12213. - PMC - PubMed
    1. Hodgkinson A, Chen Y, Eyre-Walker A. The large-scale distribution of somatic mutations in cancer genomes. Human mutation. 2012;33:136–143. doi:10.1002/humu.21616. - PubMed
    1. Liu L, De S, Michor F. DNA replication timing and higher-order nuclear organization determine single-nucleotide substitution patterns in cancer genomes. Nature communications. 2013;4:1502. doi:10.1038/ncomms2502. - PMC - PubMed
    1. Schuster-Bockler B, Lehner B. Chromatin organization is a major influence on regional mutation rates in human cancer cells. Nature. 2012;488:504–507. doi:10.1038/nature11273. - PubMed
    1. Woo YH, Li WH. DNA replication timing and selection shape the landscape of nucleotide variation in cancer genomes. Nature communications. 2012;3:1004. doi:10.1038/ncomms1982. - PubMed

Publication types

Associated data