. 2015 Feb 18;11(2):e1004996.
doi: 10.1371/journal.pgen.1004996. eCollection 2015 Feb.

An integrative multi-scale analysis of the dynamic DNA methylation landscape in aging

Affiliations

An integrative multi-scale analysis of the dynamic DNA methylation landscape in aging

Tian Yuan et al. PLoS Genet. .

Abstract

Recent studies have demonstrated that the DNA methylome changes with age. This epigenetic drift may have deep implications for cellular differentiation and disease development. However, it remains unclear how much of this drift is functional or caused by underlying changes in cell subtype composition. Moreover, no study has yet comprehensively explored epigenetic drift at different genomic length scales and in relation to regulatory elements. Here we conduct an in-depth analysis of epigenetic drift in blood tissue. We demonstrate that most of the age-associated drift is independent of the increase in the granulocyte to lymphocyte ratio that accompanies aging and that enrichment of age-hypermethylated CpG islands increases upon adjustment for cellular composition. We further find that drift has only a minimal impact on in-cis gene expression, acting primarily to stabilize pre-existing baseline expression levels. By studying epigenetic drift at different genomic length scales, we demonstrate the existence of mega-base scale age-associated hypomethylated blocks, covering approximately 14% of the human genome, and which exhibit preferential hypomethylation in age-matched cancer tissue. Importantly, we demonstrate the feasibility of integrating Illumina 450k DNA methylation with ENCODE data to identify transcription factors with key roles in cellular development and aging. Specifically, we identify REST and regulatory factors of the histone methyltransferase MLL complex, whose function may be disrupted in aging. In summary, most of the epigenetic drift seen in blood is independent of changes in blood cell type composition, and exhibits patterns at different genomic length scales reminiscent of those seen in cancer. Integration of Illumina 450k with appropriate ENCODE data may represent a fruitful approach to identify transcription factors with key roles in aging and disease.


Conflict of interest statement

The authors have declared that no competing interests exist.

Figures

Fig 1
Fig 1. Age-DMRs are mostly enriched for CGIs and the enrichment of age-hypermethylated CGIs increases after adjustment for changes in blood cell subtype composition.
A) Probabilities that a randomly picked open-sea, shore/shelf and CpG-island region is an age-DMR (defined as the top 5% of DMRs). B) Relative numbers of age-hypermethylated and age-hypomethylated DMRs within each regional class. C) Focusing on CpG-islands, density plots of beta DNAm values of 2500 age-DMRs (red) vs. 2500 non-age associated DMRs (green) (P > 0.8). D) As A) but now for age-DMRs derived using the reference-based method of Houseman et al, which adjusts for putative changes in blood cell subtype proportions. E) As B), but now for the adjusted analysis. F) Scatterplot of the t-statistics of age-DMRs (defined here as those with FDR < 0.05 in the unadjusted analysis) (x-axis) against their corresponding t-statistics from the reference-based adjusted analysis (t(RefBased), y-axis). Green dashed lines indicate the lines of significance at FDR < 0.05.
Fig 2
Fig 2. Age-associated hypomethylated blocks enriched for hypermethylated CGIs.
A) Example of a large genomic region on chromosome-19 containing a significant age-associated hypomethylated block (indicated in green). y-axis gives the fit from the Bumphunter algorithm indicating the methylation change for an increase in 10 age-years, x-axis the genomic position. B) Selected age-hypomethylated blocks enriched for CGIs undergoing hypermethylation. Each plot shows the fit from the Bumphunter algorithm indicating the methylation change per 10 age-years (y-axis) as a function of opensea probe position (x-axis). In blue we indicate the positions of CGIs, and in red those that are significantly hypermethylated with age. Some of the genes associated with the age-hypermethylated CGIs are indicated in red.
Fig 3
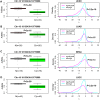
Fig 3. Age-associated hypomethylated blocks exhibit preferential hypomethylation in cancer.
Left boxplots show the average beta methylation levels over open-sea regions within an age-associated hypomethylated block on Chr-10 in normal tissue and age-matched cancers from the TCGA. (A) Endometrial Cancer (UCEC), B) Lung Adenoma Carcinoma (LUAD), C) Breast Cancer, D) Lung Squamous Cell Carcinoma (LSCC). P-values in boxplots are from a Wilcoxon rank sum test. Number of samples in each group is indicated. Right panel depicts the density distribution of the t-statistics of all age-hypomethylated blocks (magenta), as assessed between normal and age-matched cancer tissue. The cyan curve represents the corresponding statistics for a random set of non-age associated blocks, matched for number and length distribution of the observed age-hypomethylated blocks. P-value is from a Kolmogorov-Smirnov test.
Fig 4
Fig 4. Age-associated hypermethylation (hypomethylation) targets lowly (highly) expressed genes.
A) Boxplots of mRNA expression levels in cord blood and placenta samples, for three sets of genes: (i) genes undergoing age-associated hypomethylation in their CGI promoters (AgeHypoM), (ii) genes not undergoing any age-associated DNAm changes (NonAgeDMR), and (iii) genes undergoing age-associated hypermethylation in their CGI promoters (AgeHyperM). P-values shown between groupds are from a Wilcoxon-rank sum test comparing the respective neighboring gene classes. The number of genes in each class is indicated below plot. The P-value from a linear regression of expression against gene-class is also indicated in red. B) Left panel: As A) but for the whole blood samples of de Jong et al 2014, for individuals under the age of 30. Right panel: As left panel, but now for 49 whole blood samples from people over the age of 50. C) As B) but now for the expression data set of Beineke et al 2012.
Fig 5
Fig 5. Identification of pluripotent and lineage-specific TFs by integration of Illumina 450k DNAm with ENCODE data.
A) Probabilities that a randomly picked open-sea, shore/shelf and CpG-island region is a DMR between pluripotent and differentiated cells (defined as the top 5% of DMRs). B) Relative numbers of DMRs hypomethylated within hESCs and differentiated cell types and within each regional class. C) Enrichment heatmap of transcription factor binding sites (as assessed in H1-hESC) for 58 TFs, among the DMRs hypomethylated in hESCs (HypoESC) and DMRs hypomethylated in differentiated cells (HypoDIFF). D) Enrichment heatmap of transcription factor binding sites (HepG2 line) for the top ranked 58 TFs, among DMRs hypomethylated in hESCs (HypoESC) and DMRs hypomethylated in liver cells (HypoLIV). In C-D), TFs have been ranked according to the significance of enrichment among HypoESC DMRs. Color codes: white (P > 0.01), pink (P < 0.01), red (P < 1e − 5), brown (P < 1e − 10). ChIP-Seq binding profiles of the same TF but generated by different labs are distinguished by an abbreviation of the corresponding lab: SF (Stanford), HA (Hudson-Alpha).
Fig 6
Fig 6. Enrichment of TFBSs among age-DMRs.
A) Left top panel depicts the age of the individuals from which the blood samples were taken, sorted by increasing age. Heatmap depicts relative DNA methylation levels for the top 500 age-hypomethylated and top 500 age-hypermethylated DMRs (blue = relative high DNA methylation, yellow = relative low DNA methylation), with samples sorted by increasing age. Right panel depicts (with black lines) which DMRs overlap with transcription factor binding sites (TFBS) for a number of TFs which exhibited highly significant enrichment either for age-hypermethylated or age-hypomethylated DMRs (or both). Below the panels we give the odds ratios (OR) and Fisher-test P-values (P) of enrichment of the corresponding TFBSs among age-hypermethylated and age-hypomethylated regions of the top 5% of age-DMRs. B) Combinatorial enrichment analysis of TFBSs. TFs have been sorted according to the strength of association (P-value) of their binding profile with the association of a region’s DNA methylation with age, as assessed from a multivariate linear regression model. Color code for P-values: white (P > 0.01), pink (P < 0.01), red (P < 1e − 5), brown (P < 1e − 10). Below P-value bar we show the corresponding estimated t-statistic in the multivariate analysis (magenta = strongly significant (P < 0.001) positive values, cyan = strongly significant (P < 0.001) negative values).

Similar articles

Cited by

References

    1. Maegawa S, Hinkal G, Kim HS, Shen L, Zhang L, et al. (2010) Widespread and tissue specific age-related DNA methylation changes in mice. Genome Res 20: 332–340. 10.1101/gr.096826.109 - DOI - PMC - PubMed
    1. Teschendorff AE, Menon U, Gentry-Maharaj A, Ramus SJ, Weisenberger DJ, et al. (2010) Age-dependent DNA methylation of genes that are suppressed in stem cells is a hallmark of cancer. Genome Res 20: 440–446. 10.1101/gr.103606.109 - DOI - PMC - PubMed
    1. Rakyan VK, Down TA, Maslau S, Andrew T, Yang TP, et al. (2010) Human aging-associated DNA hypermethylation occurs preferentially at bivalent chromatin domains. Genome Res 20: 434–439. 10.1101/gr.103101.109 - DOI - PMC - PubMed
    1. Heyn H, Li N, Ferreira HJ, Moran S, Pisano DG, et al. (2012) Distinct DNA methylomes of newborns and centenarians. Proceedings of the National Academy of Sciences. - PMC - PubMed
    1. Hannum G, Guinney J, Zhao L, Zhang L, Hughes G, et al. (2013) Genome-wide methylation profiles reveal quantitative views of human aging rates. Mol Cell 49: 359–67. 10.1016/j.molcel.2012.10.016 - DOI - PMC - PubMed

Publication types

MeSH terms

Associated data

Grants and funding

TY, YJ, and AET are supported by the Chinese Academy of Sciences. The funders had no role in study design, data collection and analysis, decision to publish, or preparation of the manuscript.