. 2015 Mar;17(3):228-240.
doi: 10.1038/ncb3109. Epub 2015 Feb 16.

Early steps in primary cilium assembly require EHD1/EHD3-dependent ciliary vesicle formation

Affiliations

Early steps in primary cilium assembly require EHD1/EHD3-dependent ciliary vesicle formation

Quanlong Lu et al. Nat Cell Biol. 2015 Mar.

Erratum in

Abstract

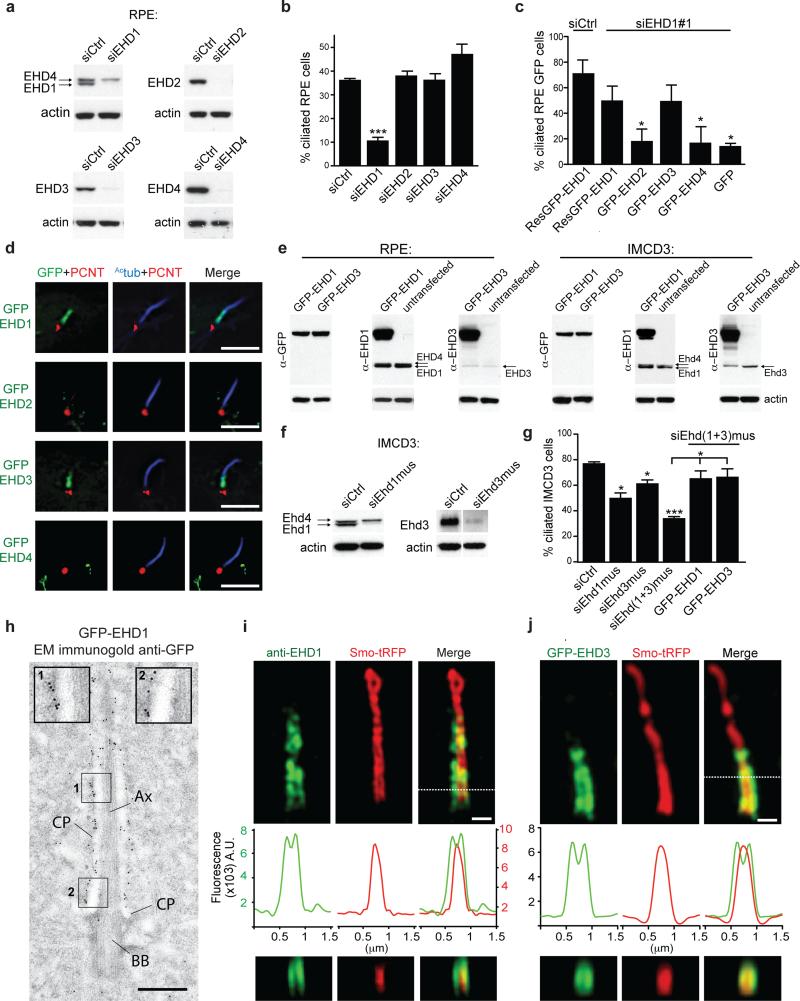
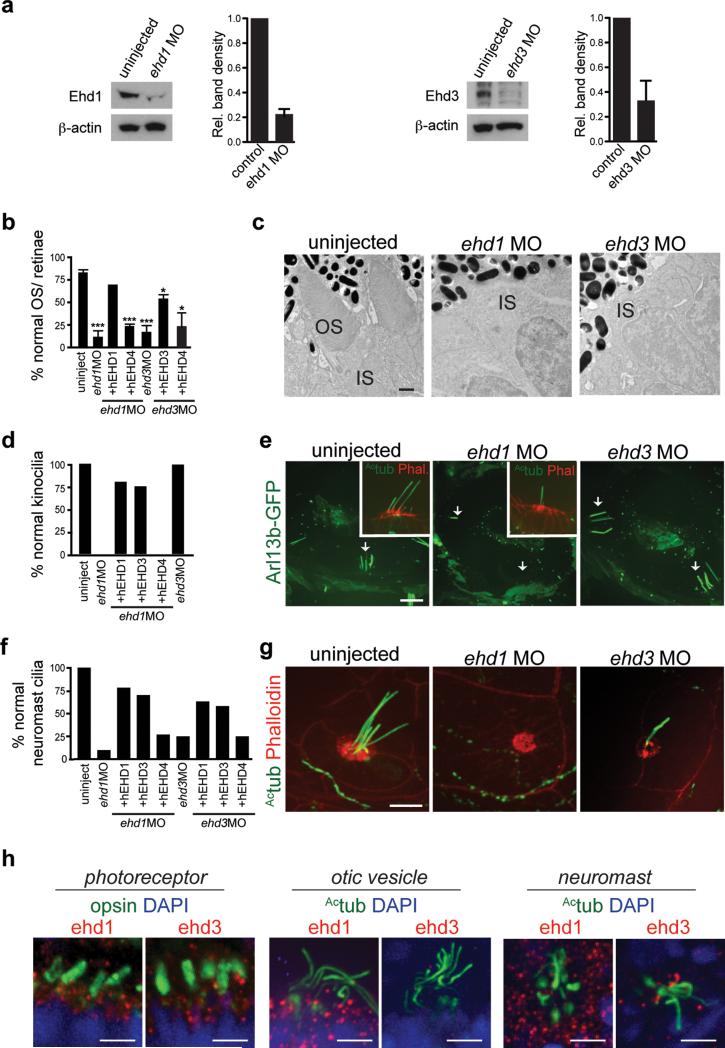
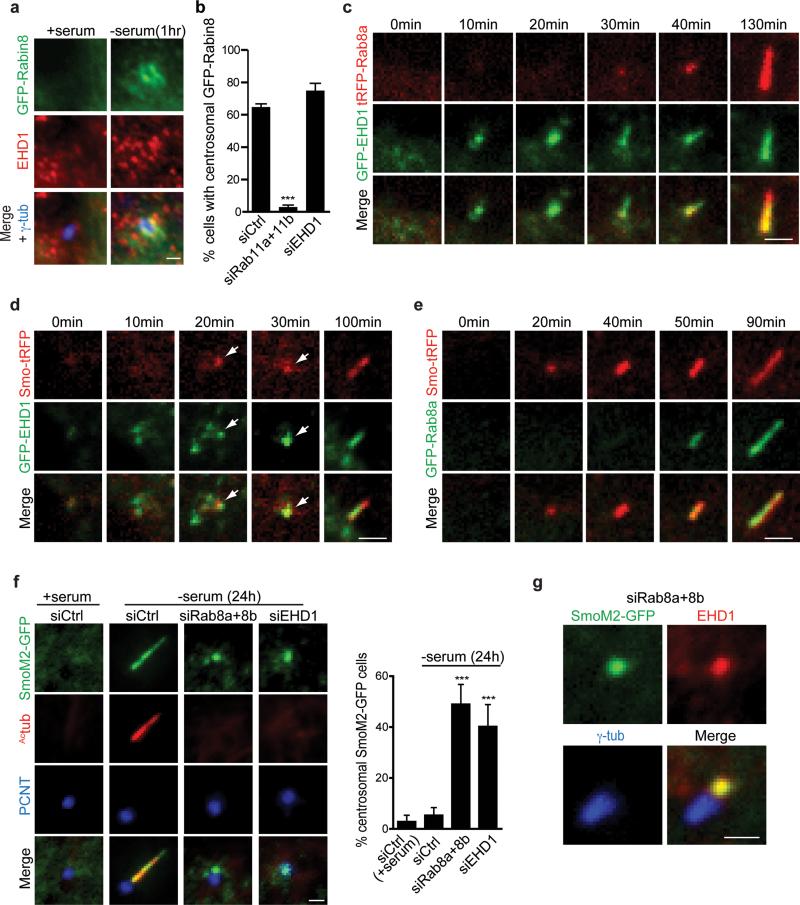
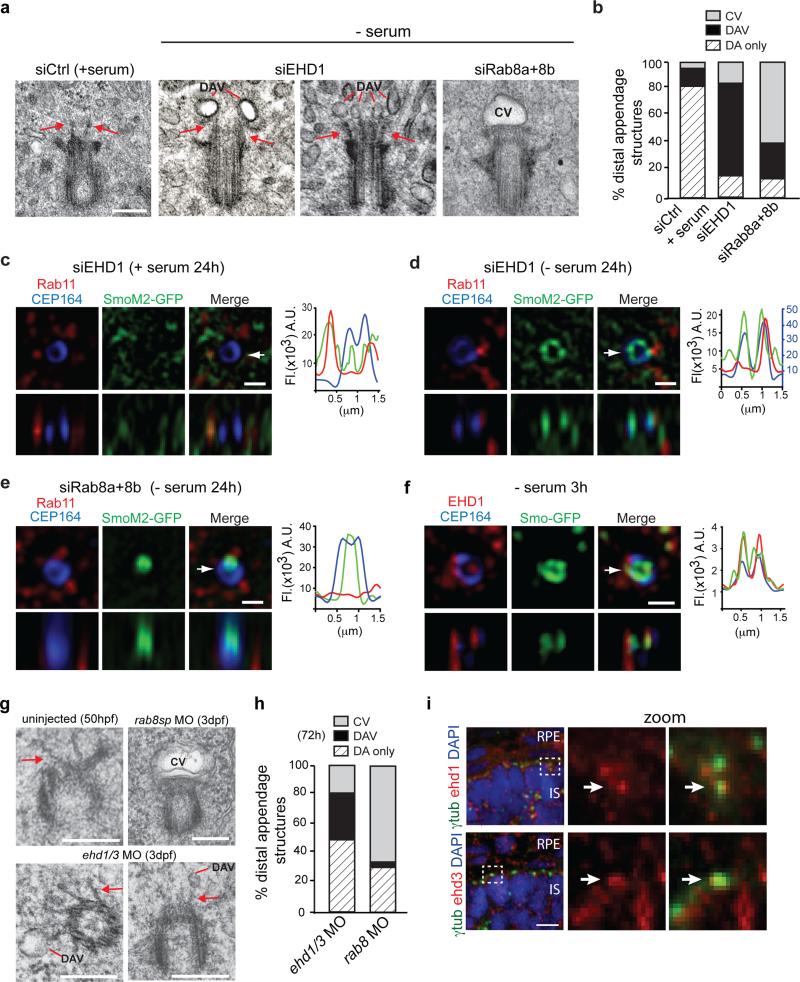
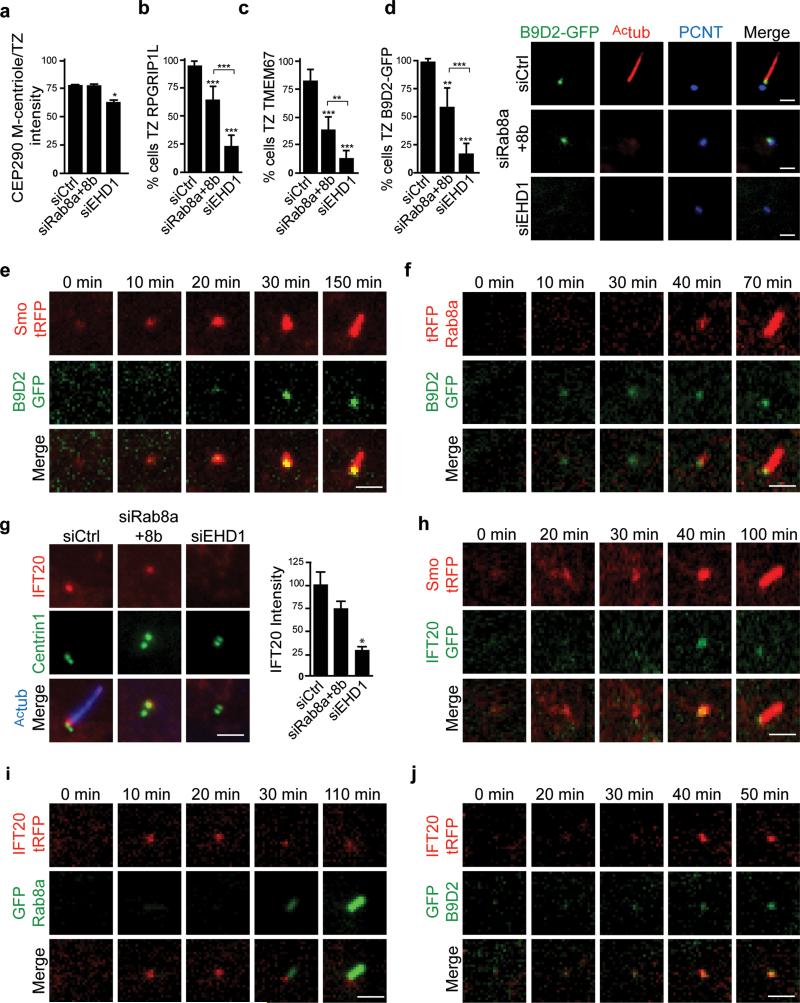
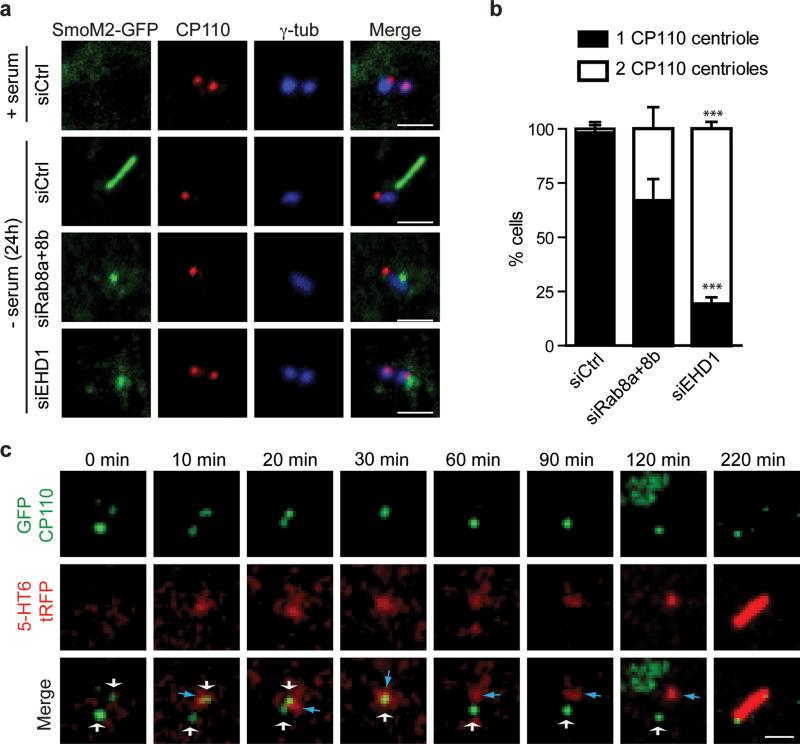
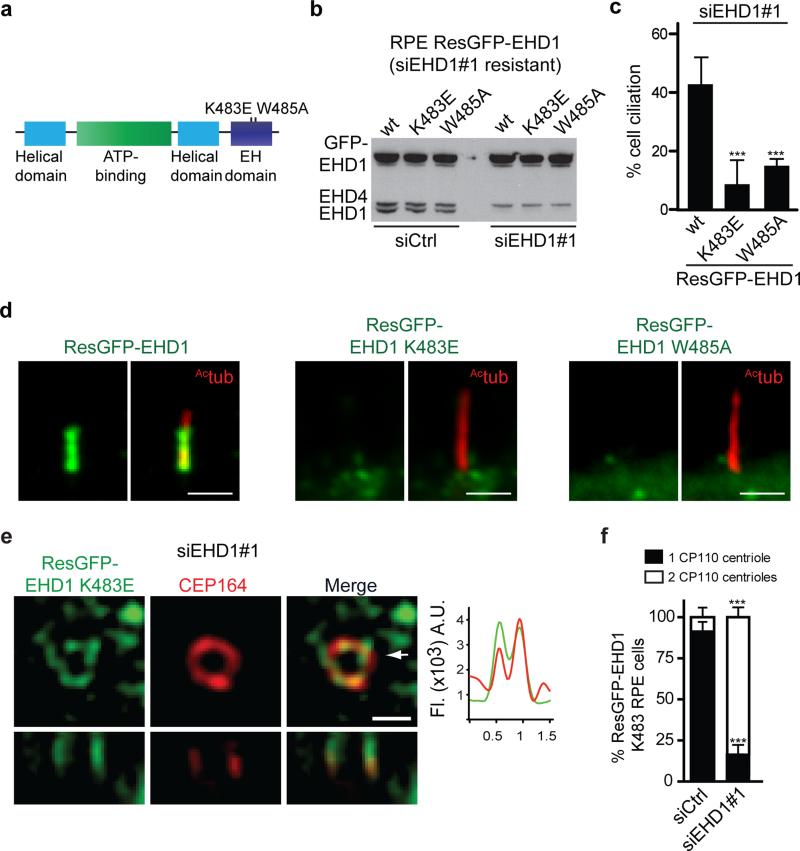
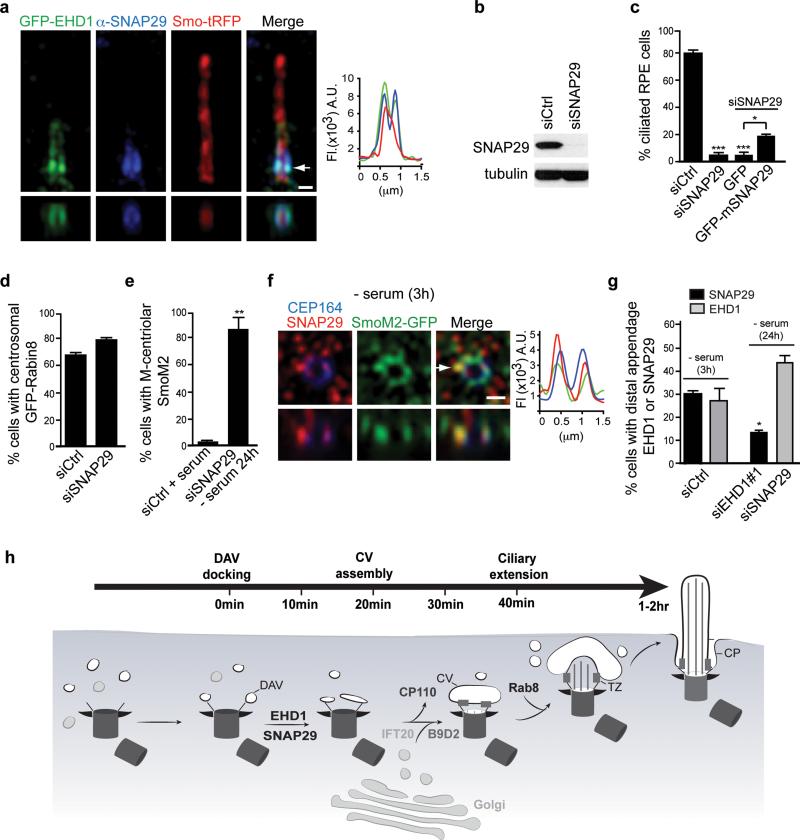
Membrane association with mother centriole (M-centriole) distal appendages is critical for ciliogenesis initiation. How the Rab GTPase Rab11-Rab8 cascade functions in early ciliary membrane assembly is unknown. Here, we show that the membrane shaping proteins EHD1 and EHD3, in association with the Rab11-Rab8 cascade, function in early ciliogenesis. EHD1 and EHD3 localize to preciliary membranes and the ciliary pocket. EHD-dependent membrane tubulation is essential for ciliary vesicle formation from smaller distal appendage vesicles (DAVs). Importantly, this step functions in M-centriole to basal body transformation and recruitment of transition zone proteins and IFT20. SNAP29, a SNARE membrane fusion regulator and EHD1-binding protein, is also required for DAV-mediated ciliary vesicle assembly. Interestingly, only after ciliary vesicle assembly is Rab8 activated for ciliary growth. Our studies uncover molecular mechanisms informing a previously uncharacterized ciliogenesis step, whereby EHD1 and EHD3 reorganize the M-centriole and associated DAVs before coordinated ciliary membrane and axoneme growth.


Figures

Figure 1
Figure 1. EHD1 and EHD3 function in ciliogenesis and localize to the ciliary pocket membrane
a. Western analysis of EHD proteins from 72h siRNA treated RPE cells (siRNA #1 from Supplementary Table 1). b. Ciliation quantification in 72h siRNA treated RPE cells (siEHD1#2, siEHD2#1, siEHD3#1, siEHD4#1), with 24h serum starvation, followed by staining with Actub and pericentrin (PCNT) antibodies. Mean ± SEM from n=3 independent experiments is shown (>100 cells per treatment). Two-tailed t-test analysis compared with siCtrl. c. Quantification of ciliation in RPE cells siRNA treated for 6h, followed by transfection with siRNA resistant (Res)GFP-EHD proteins or GFP. At 48h post-transfection, cells were serum starved and stained as in (b). Mean ± SEM from n=3 independent experiments is shown (>50 cells per condition). Two-tailed t-test analysis compared with siEHD1 ResGFP-EHD1. d. Localization of transiently expressing GFP-EHD proteins in RPE cells after 24h serum starvation and staining as in (b); Deconvolved single xy-plane from epifluorescence stack is shown. Scale bar: 5 μm. e. Western analysis comparing EHD1 and EHD3 expression in cell lines transiently expressing GFP-EHD1 or GFP-EHD3. f. Western analysis of EHD protein depletion in IMCD3 cells treated with siRNA for 72h. g. Quantification of ciliation in IMCD3 cells treated with siRNAs for 72h, and where indicated, rescued with human GFP-EHD proteins and stained as in (a-c). Mean ± SEM from n=3 independent experiments is shown (>300 cells per condition). Two-tailed t-test analysis compared with siCtrl or siEhd(1+3)mus, h. Immuno-electron micrograph of RPE cells expressing GFP-EHD1 stained with anti-GFP antibody. 10 nm gold particles accumulate on the ciliary pocket (CP) membrane. Magnification of region 1 and 2 (inset). Ax: axoneme; BB: basal body. Scale bar: 500 nm. i,j. SIM imaging of 24h serum starved RPE cells transiently expressing Smo-tRFP stained with anti-EHD1 antibody (i) or transiently expressing GFP-EHD3 (j). Middle panels show fluorescence profile plots and lower panels show orthogonal views of dotted line region. Representative image of > 10 cilia. Scale bar: 500 nm. *** P<0.0001, * P<0.05. Un-cropped blots are shown in Supplementary Fig 6. Fig 1 b,c,g statistics source data can be found in Supplementary Table 2.
Figure 2
Figure 2. ehd1 and ehd3 regulate ciliogenesis in zebrafish
a. Western analysis and quantification of Ehd1 and Ehd3 protein expression in 3 dpf MO injected embryos. Mean ± SEM from n=3 independent experiments (lysates with 50 embryos per condition) is shown. b. Quantification of photoreceptor OS number from histological sections of 3 dpf retinae stained with toluidin blue. Mean ± SEM from n=3 independent experiments is shown (>100 photoreceptors per condition). ehd1 MO+EHD1 from n=2 independent experiments (>100 photoreceptors), Two-tailed t-test analysis compared with uninjected. c. Representative electron micrographs from n=3 independent experiments (1-2 fish per condition) showing two photoreceptor cells in control, ehd1 and ehd3 morphants at 3 dpf. OS: outer segment, IS: inner segment. Scale bar: 500nm. d. Quantification of otic vesicles with kinocilia in 2 dpf Tg(arl13b-GFP) embryos uninjected or injected with ehd1 or ehd3 MO. uninjected, n=18; ehd1MO, n=13; ehd1MO+ hEHD1, n=6; ehd1MO+ hEHD3, n=4; ehd1MO+ hEHD4, n=5; ehd3MO, n=10. e. Representative images of otic vesicles described in (d) with insets showing sensory patches fixed and stained with anti-Actub antibody and phalloidin. Note that ehd1 morphants lack kinocilia. Scale bar: 10 μm. f. Quantification as in (d) of neuromasts with normal cilia in 2 dpf embryos stained with Actub and phalloidin antibodies. Uninjected, n=20; ehd1MO, n=10; ehd1MO+ hEHD1, n=23; ehd1MO+ hEHD3, n=27; ehd1MO+ hEHD4, n=22; ehd3MO, n=16; ehd3MO+ hEHD3, n=41; ehd3MO+ hEHD1, n=12; ehd3MO+ hEHD4, n=16. Note that ehd3 morphants present a partial phenotype with reduced number of kinocilia (quantification in Supplemental Fig 2b). Pooled data across 3 independent experiments is shown in (d) and (f). g. Representative images of neuromasts as described in (f). Scale bar: 10 μm. h. Representative images of photoreceptors in retinae of 3 dpf embryos, anterior cristae of otic vesicles and neuromasts stained with anti-Ehd1 or anti-Ehd3 and anti-rhodopsin or anti-Actub antibodies showing punctate accumulation of proteins in the cytosol and around the base of cilia in these organelles. Organs were imaged with the same fluorescence microscopy settings, which show that Ehd3 levels were low in the otic vesicles. Scale bar: 10 μm. Un-cropped images of blots are shown in Supplementary Fig 6. *P<0.05, *** P<0.0001. Statistics source data for Fig 2 a,b found in Supplementary Table 2.
Figure 3
Figure 3. EHD1 localize to pre-ciliary membranes and the developing cilia
a. Representative images of GFP-Rabin8 stably expressed in RPE cells grown in the presence or absence (1h) of serum and stained with antibodies to EHD1 and centrosomal marker γ-tubulin. Scale bar: 1 μm. b. Quantification of RPE GFP-Rabin8 cells treated with siRNA for 72h and imaged live by epifluorescence microscopy for GFP-Rabin8 centrosomal accumulation 1h after serum starvation. Mean ± SEM from n=3 independent experiments is shown (total number of cells counted in all experiments: siControl, 198 cells; siRab11a+b, 318 cells; siEHD1, 139 cells). Two-tailed t-test analysis compared with siCtrl. c. RPE GFP-EHD1 cells transiently expressing tRFP-Rab8a were serum starved for 1h and imaged live by spinning disk confocal microscopy. Images are maximum intensity projections of z-stacks. d. RPE GFP-EHD1 cells transiently expressing Smo-tRFP were imaged as in (c). Arrows show accumulation of EHD1 and Smo over time in developing cilia. e. RPE GFP-Rab8a cells transiently expressing Smo-tRFP were imaged as in (c). Images are single xy planes. Note that panels c-e are representative image series of > 10 cilia assembly events observed. Scale bars c-e: 2 μm f. RNAi of EHD1 or Rab8a+8b in stably expressing RPE SmoM2-GFP cell line. Cells were stained with cilia marker (Actub) and centrosome marker (PCNT) (left panel). Quantification of SmoM2-GFP centrosomal accumulation (right panel). Means ± SD are pooled data from n= 9 areas imaged in 3 independent experiments (total number of cells counted in all experiments: siCtrl (+ serum), 123; siCtrl (-serum), 179; siRab8a+8b, 172; siEHD1#1, 241). Two-tailed t-test analysis compared with siCtrl (-serum), Scale bar: 1 μm. g. RPE cells stably expressing SmoM2-GFP were transfected with Rab8a+8b siRNAs for 48h, serum starved for 24h and stained with anti-EHD1 and anti-γ-tubulin antibodies. Imaging was performed by epifluorescence microscopy. Scale bar: 1 μm. *** P<0.0001. Statistics source data for Fig3 b,f can be found in Supplementary Table 2.
Figure 4
Figure 4. EHD1 functions in ciliary vesicle formation upstream of Rab8
a. Representative electron micrographs of RPE cell M-centrioles treated with siRNA for 72h, with serum starvation (- serum) the last 24h. Scale bar: 200 nm. b. Quantification of M-centriole non-cilia distal appendages structures from (a). Pooled data from 2-4 independent experiments (total number of cells counted in all experiments: siControl+serum, 48 cells; siEHD1, 44 cells; siRab8a+8b, 51 cells). c,d,e. SIM images of RPE SmoM2-GFP cells treated with siRNA as in (a) and stained with Rab11 and CEP164 antibodies. Arrow marks orthogonal view in lower panels and corresponds to fluorescence profile plots. (c) Representative images from 5 random serum fed cells showing no centriolar SmoM2-GFP accumulation. (d) 5 out of 8 cells (63%) showed SmoM2-GFP positive DAV like structures. (e) 5 out of 9 cells (56%) showed CV-like structures. Note that 37.5% of siEHD1 treated cells showed CV-like structures, while 22% of siRab8 depleted cells had DAV-like structures. Profile plots, CEP164 values were normalized by a factor 2 (c) and SmoM2-GFP values were normalized by factor 2 (d). Scale bars: 500 nm. f. 3h serum starved RPE Smo-GFP cells stained with anti-CEP164 and anti-EHD1 antibodies and imaged by SIM. 7 out of 17 cells (41%) showed distal appendage Smo-GFP co-localization with EHD1. Arrow marks orthogonal view in lower panels and corresponds to fluorescence profile plots. Scale bar: 500 nm. g. Representative electron micrographs of M-centrioles (MC) from uninjected zebrafish photoreceptor at 50 hpf and 3 dpf photoreceptors injected with ehd1 and ehd3 or rab8sp MO. ehd1 and ehd3 MO were co-injected to maximize depletion of both proteins. Because of high lethality resulting in ehd1 and ehd3 MO, only viable embryos with small eyes were analyzed. Scale bar: 250 nm. h. Quantification of M-centriole distal appendages structures observed in electron micrographs described in (g). Averages from pooled data across 3 independent experiments (>25 photoreceptors per treatment in total across the experiments). i. Representative images of M-centrioles in zebrafish photoreceptors at 50hpf stained with anti-Ehd1 or Ehd3 and anti-γ-tubulin antibodies and imaged by spinning disk confocal microscopy. Scale bar: 10 μm. DAV: Distal appendages vesicles, CV: ciliary vesicle or DA: non-membrane associated distal appendages.
Figure 5
Figure 5. Transition zone proteins and IFT20 are recruited after distal appendage vesicle reorganization and before Rab8-dependent ciliary membrane extension
a. Quantification of CEP290 centrosome levels as previously described in RPE cells treated with siRNA for 72h, and serum starved for the final 24h, followed by staining with CEP164 and CEP290 antibodies. Mean ± SEM from n=3 independent experiments is shown (total number of cells from all 3 experiments: siCtrl, 127 cells; siRab8a+8b, 110 cells; siEHD1#1, 143 b, c. Quantification of RPGRIP1L (b) and TMEM67 (c) -positive M-centrioles-basal bodies in RPE cells treated as in (a), stained with γ-tubulin and RPGRIP1L or TMEM67 antibodies. Mean ± SD are pooled data from 3 independent experiments with (b) n=15 and (c) n=6 areas imaged (total number of cells counted in all experiments: b: siCtrl, 288; siRab8a+8b, 323; siEHD1#1, 218, c: siCtrl, 131; siRab8a+8b, 138; siEHD1#1, 117). d. RPE B9D2-GFP cells were treated with siRNA as described (a), serum starved for 24h, and stained with Actub and PCNT antibodies (right panel). Scale bars: 2 μm. Quantification cells with GFP-B9D2-positive M-centrioles-basal bodies (left panel). Means ± SD are pooled data from 3 independent experiments with n=7 areas imaged (total number of cells counted in all experiments: siCtrl, 134; siRab8a+8b, 171; siEHD1#1, 149). TZ: transition zone. Two tailed t-test analyses compared with siCtrl or between siRab8a+b and siEHD1 in a-d. e, f. RPE B9D2-GFP cells transiently expressing tRFP-Smo or tRFP-Rab8a (f) were serum starved for 1h and imaged live by spinning disk confocal microscopy. Images show single xy-planes from z-stacks. g. RPE GFP-Centrin1 cells treated with siRNA as described in (a) and stained for IFT20 and Actub. Quantification of IFT20 fluorescence intensity at the M-centriole-basal bodies in cells from left panel. Mean ± SEM from n=3 independent experiments is shown (total number of cells counted in all experiments: siCtrl, 183; siRab8a+8b, 142; siEHD1#1, 127). Two tailed t-test analysis compared with siCtrl. h,i,j. RPE cells transiently expressing IFT20-GFP and Smo-tRFP (h), RPE GFP-Rab8a cells transiently expressing IFT20-tRFP (i), RPE GFP-B9D2 cells transiently expressing IFT20-tRFP (j) were imaged and analyzed as described in (e). Scale bars: 2 μm. Note that panels e,f,h-j are representative image series of > 5 cilia assembly events observed. * P<0.05, ** P<0.001, *** P<0.001. Statistics source data for Fig5 a-d,g, can be found in Supplementary Table 2.
Figure 6
Figure 6. EHD1-dependent ciliary vesicle formation stimulates CP110 loss from the distal end of the mother-centriole
a. RPE SmoM2-GFP cells treated with siRNA for 72h, grown in serum or serum starved for the last 24h, and stained with anti-CP110 and anti-γ-tubulin antibodies. Scale bar: 2 μm. b. Quantification of serum starved RPE cells described in (a) showing CP110 localization on the mother and daughter centriole (2 dots) or only the daughter centriole (1 dot). Note that we disregarded cells with more than 2 dots in our quantification. Means ± SD are pooled data from 3 independent experiments with n=6 areas imaged (total number of cells counted in all experiments: siCtrl, 184; siRab8a+8b, 161; siEHD1#1, 157). Two tailed t-test analysis compared with siCtrl, *** P<0.0001. Statistics source data can be found in Supplementary Table 2. c. RPE cells transiently co-expressing GFP-CP110 and 5-HT6-tRFP, serum starved for 1h and imaged live over time by spinning disk confocal microscopy as in Fig 5c. Representative images of maximum intensity projections of z-stack imaging series from 5 cilia assembly events observed. White and blue arrows indicate CP110-positive centrioles and 5-HT6 vesicles respectively. For presentation purposes images were smoothed with a Gaussian blur filter. Scale bar: 2 μm.
Figure 7
Figure 7. EHD1 tubulation function is required for distal appendages vesicles assembly into the ciliary vesicle
a. Domain structure of EHD1 and loss of function mutations. b. Immunoblot analysis of siRNA resistant (Res) GFP-EHD1 wildtype, -K483E and -W485A proteins stably expressed in RPE cells 72h after transfection with siControl or siEHD1#1. Endogenous and GFP-EHD proteins expression levels were detected using anti-EHD1 antibody. Note that the EHD1 antibody also recognizes endogenous EHD4 as indicated. Un-cropped images of blots are shown in Supplementary Fig 6. c. Quantification of cilia in cells treated with siEHD1#1 as described in (b) and serum starved the last 24h. Means ± SD are pooled data from 3 independent experiments with n=8 areas imaged (total number of cells from all experiments: ResGFP-EHD1, 293; ResGFP-EHD1 K483E, 269; ResGFP-EHD1 W485A, 263).Two tailed t-test analysis compared with WT. d. Cell lines described in (b) were serum starved for 24h and stained with Actub antibody to mark the cilia. Scale bar: 2 μm. e. Representative SIM image of RPE cells expressing the siRNA resistant GFP-K483E mutant transfected with EHD1 siRNA as in (c) and stained with CEP164 antibody. 9 out of 15 cells (60%) imaged expressing the K483E showed DAV-like structures. Arrow marks orthogonal view (bottom panels) and corresponds to fluorescence profile plots. Scale bar: 500nm. f. Quantification of CP110 localization on the mother and daughter centrioles in RPE cells treated as in (c) and stained as described in Fig 6b. Means ± SD are pooled data from 3 independent experiments with n=6 areas imaged (total number of cells from all experiments: siCtrl, 148; siEHD1#1, 114). Two tailed t-tests compared with siCtrl. *** P<0.0001. Statistics source data for Fig7 c,f can be found in Supplementary Table 2.
Figure 8
Figure 8. SNAP29, a SNARE and EHD1 and EHD3 binding protein, functions in CV assembly
a. SIM image of RPE cells expressing Smo-tRFP and GFP-EHD1 stained with anti-SNAP29 antibody. Arrow corresponds to orthogonal view (bottom panels) and fluorescence intensity plot. Representative image of > 10 cells. Scale bar: 500 nm. b. Western analysis of SNAP29 depletion in RPE cells treated for 72h. Un-cropped blots are shown in Supplementary Fig 6. c. Quantification of ciliogenesis in RPE cells treated with siRNA for 72h (- serum the last 24h) with and without expression of GFP or GFP-mSnap29, stained with Actub and PCNT antibodies. Not included in the plot are short cilia (<1 μm) detected in 44 ± 2.4% in mSNAP29-positive cells. Mean ± SEM from n=3 independent experiments (>150 cells per treatment). d. Quantification of RPE GFP-Rabin8 cells transfected with siRNAs for 72h and imaged live for centrosomal GFP-Rabin8 accumulation after 1hr starvation. Mean ± SEM from n=3 independent experiments (>150 cells per treatment). e. Quantification of SmoM2-GFP at the M-centriole in RPE cells treated as described in (c) and stained with CEP164 antibodies. Mean ± SEM from n=3 independent experiments (>150 cells per treatment). f. Representative SIM image of RPE SmoM2-GFP cells serum starved for 3h and stained with SNAP29 and CEP164 antibodies. 6 out of 14 cells (42%) showed SNAP29 co-localization with Smo-GFP at the distal appendages. Arrow corresponds to orthogonal view (bottom panels) and fluorescence intensity plot. Scale bars: 500nm. g. Quantification of EHD1 and SNAP29 M-centriolar accumulation in RPE cells treated with siRNAs for 48h followed by 24h or 3h (siControl) serum starvation, and stained with CEP164 and EHD1 or SNAP29 antibodies. Mean ± SEM from n=3 independent experiments is shown (total number of cells counted in all experiments: siCtrl SNAP29, 234; siCtrl EHD1, 215: siEHD1#1, 116, siSNAP29, 149). Two tailed t-test analysis compared with siCtrl. h. Model of intracellular ciliogenesis and time-line for the accumulation of ciliogenesis proteins at the M-centriole and developing cilia. Two tailed t-test analyses compared with siCtrl or GFP Figure 8c,d,e.* P<0.05, ** P<0.001. Statistics source data for Fig 8c-e,g can be found in Supplementary Table 2.

Comment in

Similar articles

Cited by

References

    1. Goetz SC, Anderson KV. The primary cilium: a signalling centre during vertebrate development. Nat Rev Genet. 2010;11:331–344. - PMC - PubMed
    1. Hildebrandt F, Benzing T, Katsanis N. Ciliopathies. N Engl J Med. 2011;364:1533–1543. - PMC - PubMed
    1. Graser S, et al. Cep164, a novel centriole appendage protein required for primary cilium formation. J Cell Biol. 2007;179:321–330. - PMC - PubMed
    1. Ishikawa H, Kubo A, Tsukita S, Tsukita S. Odf2-deficient mother centrioles lack distal/subdistal appendages and the ability to generate primary cilia. Nat Cell Biol. 2005;7:517–524. - PubMed
    1. Schmidt KN, et al. Cep164 mediates vesicular docking to the mother centriole during early steps of ciliogenesis. J Cell Biol. 2012;199:1083–1101. - PMC - PubMed

Publication types

MeSH terms