

Neonatal overnutrition causes early alterations in the central response to peripheral ghrelin
- PMID: 25685686
- PMCID: PMC4314535
- DOI: 10.1016/j.molmet.2014.10.003
Neonatal overnutrition causes early alterations in the central response to peripheral ghrelin
Abstract
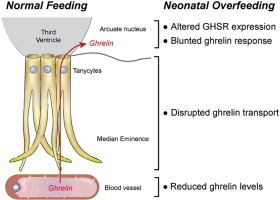
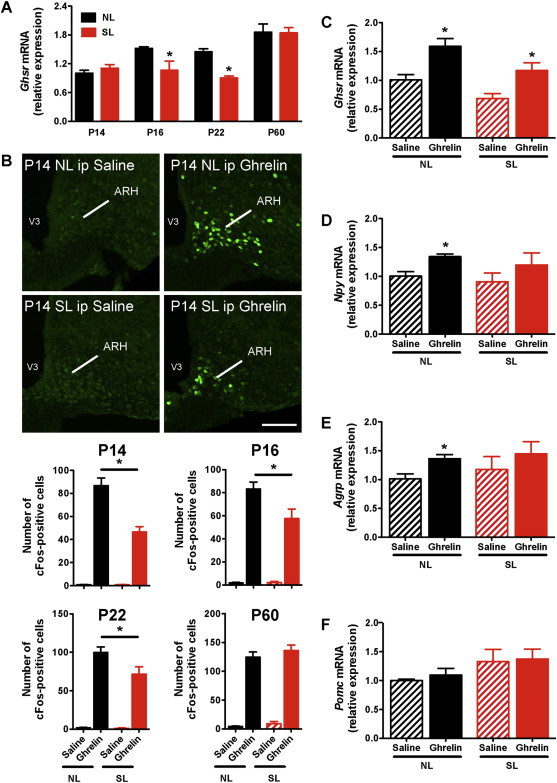
Objective: Excess nutrient supply and rapid weight gain during early life are risk factors for the development of obesity during adulthood. This metabolic malprogramming may be mediated by endocrine disturbances during critical periods of development. Ghrelin is a metabolic hormone secreted from the stomach that acts centrally to promote feeding behavior by binding to growth hormone secretagogue receptors in the arcuate nucleus of the hypothalamus. Here, we examined whether neonatal overnutrition causes changes in the ghrelin system.
Methods: We used a well-described mouse model of divergent litter sizes to study the effects of postnatal overfeeding on the central and peripheral ghrelin systems during postnatal development.
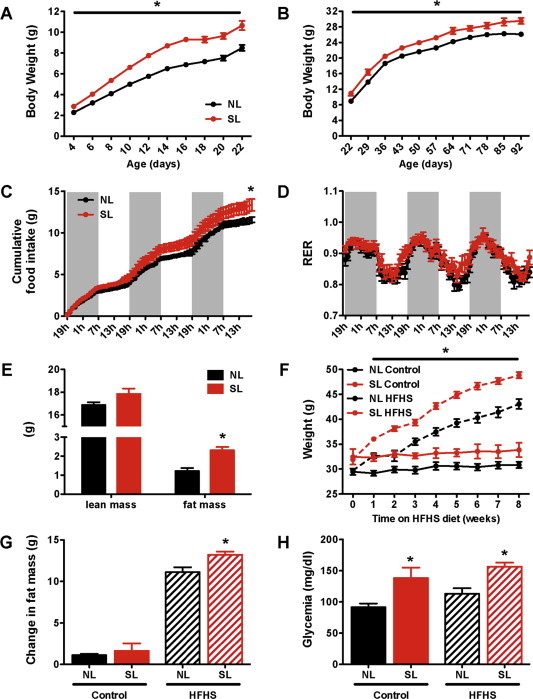
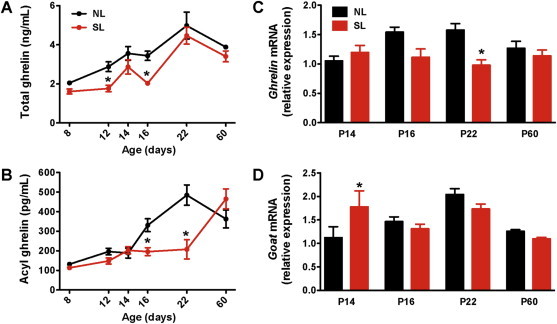
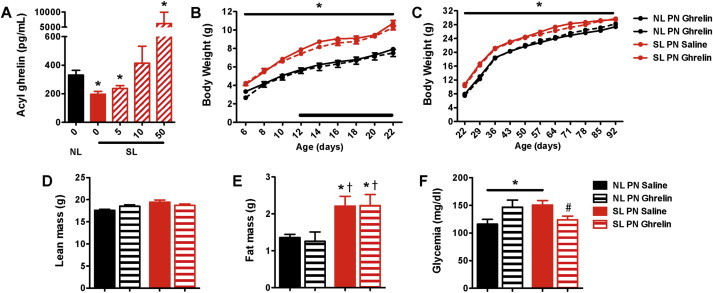
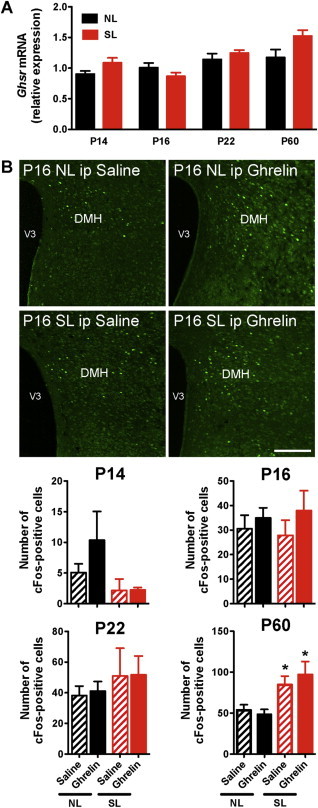
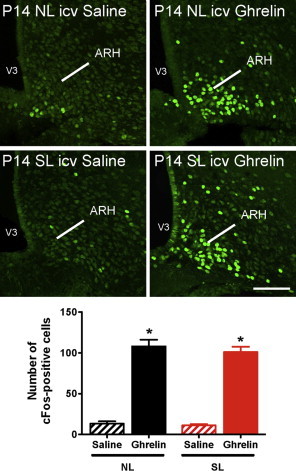
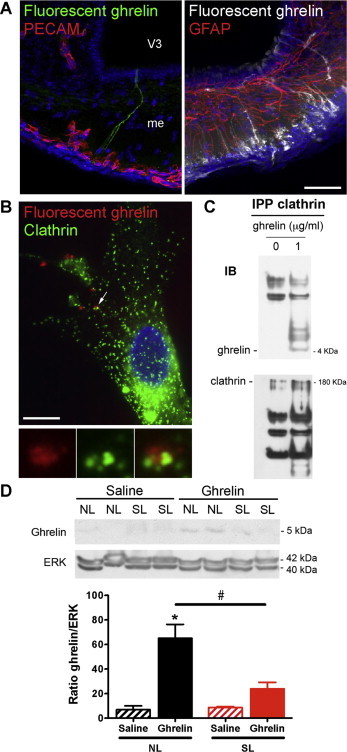
Results: Mice raised in small litters became overweight during lactation and remained overweight with increased adiposity as adults. Neonatally overnourished mice showed attenuated levels of total and acyl ghrelin in serum and decreased levels of Ghrelin mRNA expression in the stomach during the third week of postnatal life. Normalization of hypoghrelinemia in overnourished pups was relatively ineffective at ameliorating metabolic outcomes, suggesting that small litter pups may present ghrelin resistance. Consistent with this idea, neonatally overnourished pups displayed an impaired central response to peripheral ghrelin. The mechanisms underlying this ghrelin resistance appear to include diminished ghrelin transport into the hypothalamus.
Conclusions: Early postnatal overnutrition results in central resistance to peripheral ghrelin during important periods of hypothalamic development. Because ghrelin signaling has recently been implicated in the neonatal programming of metabolism, these alterations in the ghrelin system may contribute to the metabolic defects observed in postnatally overnourished mice.
Keywords: ARH, arcuate nucleus; AgRP, agouti-related peptide; DMH, dorsomedial nucleus; GHSR, growth hormone secretagogue receptor; GOAT, ghrelin O-acyltransferase; Ghrelin; HFHS, high-fat/high-sucrose diet; Hormone; Hypothalamus; LHA, lateral hypothalamic area; MBH, mediobasal hypothalamus; ME, median eminence; NL, normal litters; NPY, neuropeptide Y; Nutrition; P, postnatal day; POMC, pro-opiomelanocortin; PVH, paraventricular nucleus; Programming; SL, small litter; Tanycytes.
Figures
Similar articles
-
Neonatal overnutrition programming impairs cholecystokinin effects in adultmale rats.J Nutr Biochem. 2020 Dec;86:108494. doi: 10.1016/j.jnutbio.2020.108494. Epub 2020 Sep 11. J Nutr Biochem. 2020. PMID: 32920089
-
Hypothalamic effects of neonatal diet: reversible and only partially leptin dependent.J Endocrinol. 2017 Jul;234(1):41-56. doi: 10.1530/JOE-16-0631. Epub 2017 Apr 28. J Endocrinol. 2017. PMID: 28455431
-
Early life disruption to the ghrelin system with over-eating is resolved in adulthood in male rats.Neuropharmacology. 2017 Feb;113(Pt A):21-30. doi: 10.1016/j.neuropharm.2016.09.023. Epub 2016 Sep 23. Neuropharmacology. 2017. PMID: 27671325
-
Development of Hypothalamic Circuits That Control Food Intake and Energy Balance.In: Harris RBS, editor. Appetite and Food Intake: Central Control. 2nd edition. Boca Raton (FL): CRC Press/Taylor & Francis; 2017. Chapter 7. In: Harris RBS, editor. Appetite and Food Intake: Central Control. 2nd edition. Boca Raton (FL): CRC Press/Taylor & Francis; 2017. Chapter 7. PMID: 28880512 Free Books & Documents. Review.
-
The arcuate nucleus as a conduit for diverse signals relevant to energy homeostasis.Int J Obes Relat Metab Disord. 2001 Dec;25 Suppl 5:S63-7. doi: 10.1038/sj.ijo.0801913. Int J Obes Relat Metab Disord. 2001. PMID: 11840218 Review.
Cited by
-
Appetite-regulating hormones in early life and relationships with type of feeding and body composition in healthy term infants.Eur J Nutr. 2017 Jun;56(4):1725-1732. doi: 10.1007/s00394-016-1219-8. Epub 2016 May 11. Eur J Nutr. 2017. PMID: 27170102 Free PMC article.
-
Neurodevelopmental Programming of Adiposity: Contributions to Obesity Risk.Endocr Rev. 2024 Mar 4;45(2):253-280. doi: 10.1210/endrev/bnad031. Endocr Rev. 2024. PMID: 37971140 Free PMC article. Review.
-
Non-nutritive Sweeteners Induce Hypothalamic ER Stress Causing Abnormal Axon Outgrowth.Front Endocrinol (Lausanne). 2019 Dec 17;10:876. doi: 10.3389/fendo.2019.00876. eCollection 2019. Front Endocrinol (Lausanne). 2019. PMID: 31920985 Free PMC article.
-
Non-Neuronal Cells in the Hypothalamic Adaptation to Metabolic Signals.Front Endocrinol (Lausanne). 2017 Mar 21;8:51. doi: 10.3389/fendo.2017.00051. eCollection 2017. Front Endocrinol (Lausanne). 2017. PMID: 28377744 Free PMC article. Review.
-
Contrast Enhancement of the Normal Infundibular Recess Using Heavily T2-weighted 3D FLAIR.Magn Reson Med Sci. 2022 Jul 1;21(3):469-476. doi: 10.2463/mrms.mp.2021-0021. Epub 2021 May 13. Magn Reson Med Sci. 2022. PMID: 33980787 Free PMC article.
References
-
- Wang Y., Beydoun M.A., Liang L., Caballero B., Kumanyika S.K. Will all Americans become overweight or obese? Estimating the progression and cost of the US obesity epidemic. Obesity (Silver Spring) 2008;16:2323–2330. - PubMed
-
- Rogers I. The influence of birthweight and intrauterine environment on adiposity and fat distribution in later life. International Journal of Obesity and Related Metabolic Disorders. 2003;27:755–777. - PubMed
-
- Cruz M.L., Shaibi G.Q., Weigensberg M.J., Spruijt-Metz D., Ball G.D.C., Goran M.I. Pediatric obesity and insulin resistance: chronic disease risk and implications for treatment and prevention beyond body weight modification. Annual Review of Nutrition. 2005;25:435–468. - PubMed
-
- Duque-Guimarães D.E., Ozanne S.E. Nutritional programming of insulin resistance: causes and consequences. Trends in Endocrinology & Metabolism. 2013;24:525–535. - PubMed
Grants and funding
LinkOut - more resources
Full Text Sources
Other Literature Sources
Miscellaneous
