. 2015 Feb 10;7(2):559-89.
doi: 10.3390/v7020559.

Elevated cytokines, thrombin and PAI-1 in severe HCPS patients due to Sin Nombre virus

Affiliations

Elevated cytokines, thrombin and PAI-1 in severe HCPS patients due to Sin Nombre virus

Virginie Bondu et al. Viruses. .

Abstract

Sin Nombre Hantavirus (SNV, Bunyaviridae Hantavirus) is a Category A pathogen that causes Hantavirus Cardiopulmonary Syndrome (HCPS) with case fatality ratios generally ranging from 30% to 50%. HCPS is characterized by vascular leakage due to dysregulation of the endothelial barrier function. The loss of vascular integrity results in non-cardiogenic pulmonary edema, shock, multi-organ failure and death. Using Electric Cell-substrate Impedance Sensing (ECIS) measurements, we found that plasma samples drawn from University of New Mexico Hospital patients with serologically-confirmed HCPS, induce loss of cell-cell adhesion in confluent epithelial and endothelial cell monolayers grown in ECIS cultureware. We show that the loss of cell-cell adhesion is sensitive to both thrombin and plasmin inhibitors in mild cases, and to thrombin only inhibition in severe cases, suggesting an increasing prothrombotic state with disease severity. A proteomic profile (2D gel electrophoresis and mass spectrometry) of HCPS plasma samples in our cohort revealed robust antifibrinolytic activity among terminal case patients. The prothrombotic activity is highlighted by acute ≥30 to >100 fold increases in active plasminogen activator inhibitor (PAI-1) which, preceded death of the subjects within 48 h. Taken together, this suggests that PAI-1 might be a response to the severe pathology as it is expected to reduce plasmin activity and possibly thrombin activity in the terminal patients.


Figures

Figure 1
Figure 1
Effect of pooled (n = 4) class III Hantavirus Cardiopulmonary Syndrome (HCPS) patient plasma on cell barrier properties of Vero E6 cells measured by Electric Cell-substrate Impedance Sensing (ECIS). (A) Vero E6 cells were plated in electrode-containing dishes at 105 cells/cm2 and allowed to attach, spread, and organize for at least 20 h. Cellular impedance was measured continuously at a single frequency of 4000 Hz. Increase in resistance corresponds to increasing cell barrier function. a: The rapid increase in resistance at about 20 h occurred after the media was exchanged; b: Class III plasma collected on day of admission and healthy control plasma were added to monolayers; (B) Comparing the effect of patient plasma and controls by normalizing data from (A), at baseline established after media was refreshed. Error bars represent duplicate measurements; (C) Effect of 4-fold dilution on the barrier function of confluent monolayers of pooled plasma from classes I, and III patients. Data also show that the loss of resistance is caused by a concentration-dependent fast acting component and a slowly acting component, which is relatively insensitive to dilution.
Figure 2
Figure 2
ECIS measurement of molecular weight-based fractions of patient plasma showing that proteins retained by 100 kDa cutoff filters cause permanent loss of resistance. Arrows indicate the time points when media was changed (19 h) and plasma samples were added (22 h). (B) Baseline normalized ECIS profiles shows the effect of plasma proteins fractionated by molecular weight on cell barrier function (in different sample from (A)). Component protein(s) retained by the 100 kDa filter are shown to cause sustained loss of resistance, while lower molecular weight proteins of 30 kDa and 10 kDa range are shown to show reversible loss of resistance.
Figure 3
Figure 3
Relative effects of pooled classes I and III plasma samples on the barrier function of Vero E6 cell monolayers in assays using thrombin (Arg) and plasmin (TA) inhibitors. (A) Class I and controls (cntrl); (B) Class III and controls (cntrl); (C) Ratiometric plot of Arg/(Arg + TA) versus time, used to determine activity of plasmin in classes I and III samples. The result shows that plasmin expression is significant in class I. Dimethyl sulfoxide (DMSO) was used to solubilize argatroban. The final concentration of DMSO in media was uniformly kept at <1% in all samples; (D) List of false discovery rate (FDR) - adjusted p-values (<0.01) used to determine whether the recovery endpoint (6 h) of cell barrier function in the assay conditions shown in A and B differ significantly from the controls. The assays on the list were found to differ significantly from the controls.
Figure 4
Figure 4
ECIS analysis of cell monolayers exposed to serial plasma samples. (A) Serial changes of ECIS profiles on different days suggest the diminution of thrombin expression on day five; (B) Relative effect of argatroban on day one and day five samples, implicate thrombin expression in day 1 sample and negligible amount on day five sample, perhaps indicating patient recovery. Dimethyl sulfoxide (DMSO) was used to solubilize argatroban. (C) Ratiometric plot of Arg/(Arg+TA) versus time was used to determine activity of plasmin in class II samples. The results show that plasmin activity is not significant in class II as measured by assay endpoint determinations between controls and class II serial samples.
Figure 5
Figure 5
SNV induces loss of cell barrier function in intact tight-junction forming monolayers of polarized Vero and TIVE. (A) Confocal images of tight junctions in polarized monolayers; (B) Development of tight junctions in polarized monolayers grown in 6 mm microporous filter inserts at 150,000 cells/well was measured on days shown in the plot of TER versus time for HLMVEC, TIVE and Vero E6 cells. The error bars are standard deviations from 12 monolayers; (C, D) Effect of live SNV on the barrier integrity of Vero E6 and TIVE monolayers under different conditions described in the text. Error bars represent standard deviations from independent replicates of 3 monolayers.
Figure 6
Figure 6
Plot of cytokines that are differentially upregulated in plasma from classes I, II, and III HPCS patients. (A) Duplicate samples of pooled plasma (day 0, n = 5 for classes I and II; n = 4 for class III) were analyzed using a Millipore HCYTMAG-60K-PX41 Cytokine kit. Significant increases in cytokine expression were determined by a two-way ANOVA with a Bonferroni's multiple comparison test; (B) The data from (A) were recast as fold increase above normal expression levels.
Figure 7
Figure 7
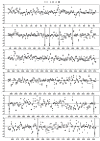
Plot of the logarithm of geometric mean fold change relative to control, ((Δsg=lisg¯lisC¯) see text for details) for all 2D gel spots derived from the analysis of Classes I, II, and III plasma. Spot reference numbers are on the horizontal axis, and there is one value for each of the three classes. The spots marked with a grey bar represent ones associated with statistically significant (False Discovery Rate) changes relative to control. Spot 126 was rejected as an outlier after visual inspection of the gel spots.
Figure 8
Figure 8
Plot of the logarithm of geometric mean fold change relative to control, ((Δsg=lisg¯lisC¯) see text for details) for 2D gel spots associated with proteins above the nominal molecular weight of 50 kDa derived from the analysis of Classes I, II, and III plasma. Spot reference numbers are on the horizontal axis, and there is one value for each of the three classes. The spots marked with a grey bar represent spots associated with statistically significant changes (FDR) relative to control.
Figure 9
Figure 9
Plasminogen activator inhibitor 1 (PAI-1) is highly upregulated in Class III HCPS patients as measured with ELISA assays. (A) Average expression of PAI-1 samples from individual control, cntrl (n = 5), Class I (n = 5), II (n = 5), and III (n = 4) subjects. Data show, analysis results of samples collected on day of admission to UNMH. Error bars reflect subject-to-subject variability with median, upper and lower limits as follows: cntrl (19.1, 29.8, 12.6); I (17.6, 25.4, 14.1); II (82.8, 120.3, 55.8); III (230.5, 1377.0, 59.0); (B) Plot of active PAI-1 expression in individual class III subjects identified as 281, 260, 256 and 280. Sample collection ended on different days due to death of the subjects. Error bars are duplicate measurements; (C) Plot of fold increase in active PAI-1 measured in pooled samples of Class II and individual Class III HCPS patients versus length of hospital stay (LOS). Error bars are duplicate measurements.
Figure 10
Figure 10
Model of hemostatic impairment and adverse PAI-1 generation in class III HCPS patients. (A) Vascular permeability in HCPS is induced by viral engagement to endothelial cells as well as the severe inflammatory insult from cytokines and complement anaphylatoxins. Damage to the endothelial wall, and subsequent efflux of plasma into the interstitium triggers thrombogenesis as subendothelial tissue factor is exposed to coagulation factors; (B) Local accumulation of fibrin thrombi develops profibrinolytic activity in order to prevent thrombosis. Robust antifibrinolytic activity is upregulated in class III HCPS. Carboxypeptidases, such as carboxypeptidase N (CPN) and activated thrombin-activable fibrinolysis inhibitor (TAFIa) play important roles in controlling fibrinolysis. Plasmin degradation of fibrin is enabled by the exposure of C-terminal lysine residues (Lys), to which it binds. Exposed Lys groups provide a catalytic substrate for plasminogen activation due to increased binding. Carboxypeptidases inhibit plasmin formation by removing exposed lysine residue from the fibrin clot. PZP (pregnancy zone protein) is an anti plasmin inhibitor, that is also upregulated in the plasma of class III patients (Schematic for B was adapted from reference [111]).

Similar articles

Cited by

References

    1. Schmaljohn C., Hjelle B. Hantaviruses: A global disease problem. Emerg. Infect. Dis. 1997;3:95–104. doi: 10.3201/eid0302.970202. - DOI - PMC - PubMed
    1. Vaheri A., Strandin T., Hepojoki J., Sironen T., Henttonen H., Makela S., Mustonen J. Uncovering the mysteries of hantavirus infections. Nat. Rev. Microbiol. 2013;11:539–550. doi: 10.1038/nrmicro3066. - DOI - PubMed
    1. Hjelle B. Epidemiology and diagnosis of hantavirus infections. In: Rose B.D., editor. UpToDate. Wolters Kluwer; Wellesley, MA, USA: 2014.
    1. Botten J., Mirowsky K., Kusewitt D., Bharadwaj M., Yee J., Ricci R., Feddersen R.M., Hjelle B. Experimental infection model for sin nombre hantavirus in the deer mouse (peromyscus maniculatus) Proc. Natl. Acad. Sci. USA. 2000;97:10578–10583. doi: 10.1073/pnas.180197197. - DOI - PMC - PubMed
    1. Botten J., Mirowsky K., Kusewitt D., Ye C., Gottlieb K., Prescott J., Hjelle B. Persistent sin nombre virus infection in the deer mouse ( peromyscus maniculatus ) model: Sites of replication and strand specific expression. J. Virol. 2003;77:1540–1550. doi: 10.1128/JVI.77.2.1540-1550.2002. - DOI - PMC - PubMed

Publication types

MeSH terms