. 2015 Feb 6;11(2):e1004640.
doi: 10.1371/journal.ppat.1004640. eCollection 2015 Feb.

Non-redundant and redundant roles of cytomegalovirus gH/gL complexes in host organ entry and intra-tissue spread

Affiliations

Non-redundant and redundant roles of cytomegalovirus gH/gL complexes in host organ entry and intra-tissue spread

Niels A W Lemmermann et al. PLoS Pathog. .

Abstract

Herpesviruses form different gH/gL virion envelope glycoprotein complexes that serve as entry complexes for mediating viral cell-type tropism in vitro; their roles in vivo, however, remained speculative and can be addressed experimentally only in animal models. For murine cytomegalovirus two alternative gH/gL complexes, gH/gL/gO and gH/gL/MCK-2, have been identified. A limitation of studies on viral tropism in vivo has been the difficulty in distinguishing between infection initiation by viral entry into first-hit target cells and subsequent cell-to-cell spread within tissues. As a new strategy to dissect these two events, we used a gO-transcomplemented ΔgO mutant for providing the gH/gL/gO complex selectively for the initial entry step, while progeny virions lack gO in subsequent rounds of infection. Whereas gH/gL/gO proved to be critical for establishing infection by efficient entry into diverse cell types, including liver macrophages, endothelial cells, and hepatocytes, it was dispensable for intra-tissue spread. Notably, the salivary glands, the source of virus for host-to-host transmission, represent an exception in that entry into virus-producing cells did not strictly depend on either the gH/gL/gO or the gH/gL/MCK-2 complex. Only if both complexes were absent in gO and MCK-2 double-knockout virus, in vivo infection was abolished at all sites.


Conflict of interest statement

The authors have declared that no competing interests exist.

Figures

Figure 1
Figure 1. Knock-out of gO strongly impairs infection of otherwise highly-susceptible neonatal mice.
(A) Virion pictograms illustrating alternative gH/gL complex envelope equipment of viruses used. Black bar within capsid symbol: ORF m74 encoding gO. Grey bar: ORF m131–129 encoding MCK-2. (B) Newborn BALB/c mice were infected i.p. with 2000 PFU of the indicated viruses and survival rates were monitored daily until day 15. (C) Newborn BALB/c mice were infected i.p. with 1000 PFU of the indicated viruses, and virus titers in organ homogenates (PFU/organ for spleen and lungs; PFU/g for the liver) were determined 9.5 days later. Symbols represent titers in organs of individual mice with median values marked. DL, detection limit. P values (distribution-free Wilcoxon-Mann-Whitney rank sum test, two-sided) for evaluating the significance of differences are indicated for group comparisons of most interest.
Figure 2
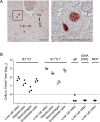
Figure 2. Synchronicity of infection initiation in main cell types of the liver.
(A) 2C-IHC of liver tissue sections taken at 24h after i.v. infection of immunocompromised BALB/c mice (6.5 Gy of γ-irradiation) with 1 x 10⁶ PFU of WT mCMV, simultaneously detecting viral proteins IE1 (black staining) and E1 (red staining) in nuclei of infected cells. Left image: overview. iEC, infected endothelial cell; iHc, infected hepatocyte. The framed area is shown enlarged in the right image. Bar markers represent 25 μm. (B) Cell counts in representative 10-mm2 areas of liver tissue sections quantitating IE1+E1- and IE1+E1+ cells differentiated by cell type as indicated. Infection had not proceeded in any cell type to expression of gB, viral DNA synthesis (vDNA detected by ISH), and the late (L) phase protein MCP. Symbols represent linked data from livers of 3 mice analyzed individually. The median values are marked.
Figure 3
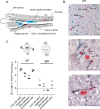
Figure 3. Requirement of gO for efficient initiation of infection in diverse liver cell types.
(A) Sketch of liver tissue microanatomy with the localization of Hc, EC (black stain), and MΦ (turquoise-green stain). Infection of cells is symbolized by viral IE1 protein-containing cell nuclei (red stain). (B) 3C-IHC images of liver tissue sections taken at 24h after i.v. infection of immunocompromised BALB/c mice (6.5 Gy of γ-irradiation) with 1 x 10⁶ PFU of WT mCMV. (a) Overview showing infected Hc (iHc, red stained nucleus, IE1 protein), infected IE1+ (red) F4/80+ (turquoise green) MΦ (iMΦ), and infected IE1+ (red) CD31+ (black) EC (iEC). (b) Higher magnification image showing iMΦ and iHc in greater detail. (c) Higher magnification image showing iEC and a binucleated iHc in greater detail. Bar markers: 25 μm. (C) Counts of infected IE1+ cells (sum of IE1+E1- and IE1+E1+ cells) of the indicated liver cell types in representative 10-mm2 areas of liver tissue sections after infection with viruses WT or ΔgO (Δm74) under the conditions specified above. Symbols represent data (linked data within each infection group) from individual mice with the median values marked.
Figure 4
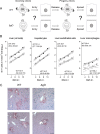
Figure 4. gO-independence of virus spread in liver tissue.
(A) Sketch of the concept with WT and ΔgO (Δm74) virion pictograms explaining the gH/gL complex envelope equipment of viruses upon first cell entry (incoming virions) and of their progeny participating in subsequent intra-tissue spread. (B) Time course of counts of infected IE1+ liver cells, all cells or differentiated by cell type, after i.v. infection of immunocompromised BALB/c mice (6.5 Gy of γ-irradiation) with 103 PFU of WT virus (filled circles) or ΔgO virus (open squares). Symbols represent the median values of cell counts per representative 10-mm2 areas of liver tissue sections from at least 3 mice per group and time of assay. Log-linear regression lines (based on all data) and their corresponding 95% confidence areas (bordered by dotted lines) are indicated. Viral doubling times (vDT) were calculated based on the slopes a of the regression lines according to the formula vDT = log2/a. The 95% confidence intervals of vDT are given in parentheses. (C) 2C-IHC images taken on day 10 after infection with WT virus (left panels) or ΔgO virus (right panels). Upper two images show representative tissue section areas stained for IE1 (red) and the macrophage marker F4/80 (turquoise green). Lower two images show representative tissue section areas stained for IE1 (red) and the EC marker CD31 (black). The bar marker represents 100 μm and applies to all 4 images.
Figure 5
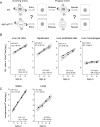
Figure 5. Reversal of the ΔgO growth deficiency phenotype by gO-transcomplementation.
(A) Sketch with WT and ΔgO-gOtrans virion pictograms explaining the gH/gL complex envelope equipment of viruses upon first cell entry (incoming virions) and of their progeny participating in subsequent intra-tissue spread. (B) Time course of counts of infected IE1+ liver cells, all cells or differentiated by cell type, after i.v. infection of immunocompromised BALB/c mice (6.5 Gy of γ-irradiation) with 103 PFU of WT virus (filled circles) or virus ΔgO-gOtrans (filled squares). Symbols represent the median values of cell counts per representative 10-mm2 areas of liver tissue sections from at least 3 mice per group and time of assay. (C) Corresponding analysis of viral DNA load in spleen and lungs (mean of triplicate tissue samples per mouse) by qPCR specific for gene M55 (encoding gB), with qPCR specific for cellular gene pthrp performed for normalization to host cell numbers. Symbols represent median values from at least 3 individually tested mice per group and time of assay. For the explanation of log-linear regression analysis (calculating vDT), see the legend of Fig. 4.
Figure 6
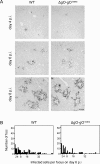
Figure 6. Comparable development of infection foci of viruses WT and ΔgO-gOtrans.
Immunocompromised BALB/c mice (6.5 Gy of γ-irradiation) were infected i.v. with 103 PFU of WT virus or of virus ΔgO-gOtrans. (A) IHC images of liver tissue sections were taken on days 4, 6, and 8 p.i. to show the growth development of viral foci over time. Infected cells are visualized by black staining of intranuclear IE1 protein. Bar marker: 100 μm. (B) Bar diagrams of the focus size distributions on day 6 for representative 10-mm2 areas of liver tissue sections, revealing similar numbers and comparable sizes of foci of infection for the two viruses under study.
Figure 7
Figure 7. Double-ko of gO and MCK-2 ablates in vivo virus growth.
(A) Sketch with WT and ΔgOΔMCK-2-gOtrans virion pictograms explaining the gH/gL complex envelope equipment of viruses upon first cell entry (incoming virions) and of their progeny participating in subsequent intra-tissue spread. (B) Time course of counts of infected IE1+ liver cells (outer left panel) or of qPCR-determined viral genome loads in liver, spleen, and lungs (remaining panels) after i.v. infection of immunocompromised BALB/c mice (6.5 Gy of γ-irradiation) with 103 PFU of WT virus (filled circles) or ΔgOΔMCK-2-gOtrans virus (open circles). For the explanation of log-linear regression analysis (calculating vDT), see the legend of Fig. 4.
Figure 8
Figure 8. Redundance of alternative gH/gL complexes gH/gL/gO and gH/gL/MCK-2 in securing the infection of salivary glands.
(A) Time course of SG infection (for conditions and qPCR assay see the legend of Fig. 5) by viruses WT (filled circles), ΔgO (open squares), and ΔgOΔMCK-2-gOtrans (open circles). (B) Independent second experiment reproducing the time course of SG infection by viruses WT (filled circles) and ΔgO (open squares), now compared to virus ΔMCK-2 (open circles) still expressing the gH/gL/gO complex. Symbols in the three single virus panels represent data from individual mice, symbols in the merge (outer right) panel represent the corresponding median values. For the explanation of log-linear regression analysis (calculating vDT), see the legend of Fig. 4.

Similar articles

Cited by

References

    1. Connolly SA, Jackson JO, Jardetzky TS, Longnecker R (2011) Fusing structure and function: a structural view of the herpesvirus entry machinery. Nat Rev Microbiol 9:369–381. 10.1038/nrmicro2548 - DOI - PMC - PubMed
    1. Eisenberg RJ, Atanasiu D, Cairns TM, Gallagher JR, Krummenacher C, et al. (2012) Herpes virus fusion and entry: a story with many characters. Viruses 4:800–832. 10.3390/v4050800 - DOI - PMC - PubMed
    1. Hutt-Fletcher LM (2007) Epstein-Barr virus entry. J Virol 81:7825–7832. - PMC - PubMed
    1. Pedersen SM Hollsberg P (2006) Complexities in human herpesvirus-6A and-6B binding to host cells. Virology 356:1–3. - PubMed
    1. Adler B, Sinzger C (2013) Cytomegalovirus inter-strain variance in cell-type tropism. In: Reddehase, editor. Cytomegaloviruses: from molecular pathogenesis to intervention. Caister Academic Press, Norfolk, UK: Vol. II, pp. 297–322.

Publication types

Substances

Grants and funding

BA was supported by the Deutsche Forschungsgemeinschaft through grant AD131/3-2. NAWL and MJR were supported by the Deutsche Forschungsgemeinschaft, Clinical Research Group KFO 183. NAWL was supported by the Young Investigators Program MAIFOR at the University Medical Center of the Johannes Gutenberg-University Mainz. AK was supported by the Croatian Science Foundation under the project 7132. The funders had no role in study design, data collection and analysis, decision to publish, or preparation of the manuscript.