

Impaired macrophage autophagy increases the immune response in obese mice by promoting proinflammatory macrophage polarization
- PMID: 25650776
- PMCID: PMC4502775
- DOI: 10.1080/15548627.2015.1009787
Impaired macrophage autophagy increases the immune response in obese mice by promoting proinflammatory macrophage polarization
Abstract
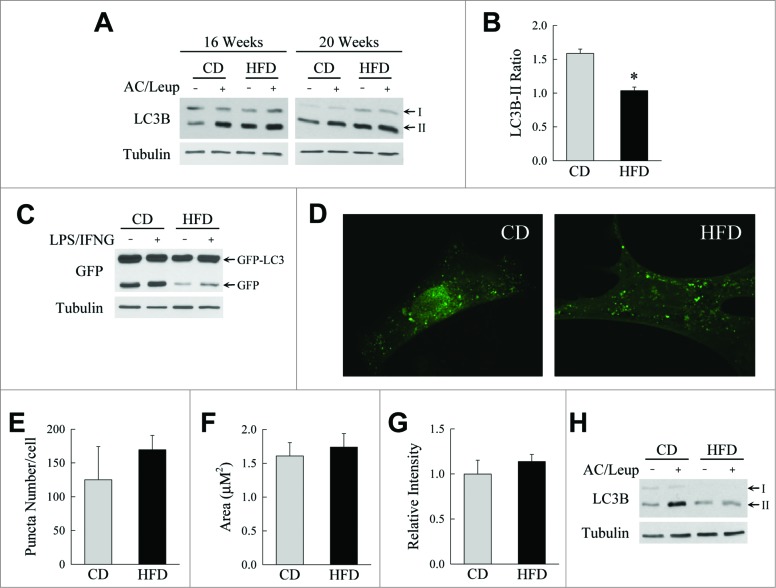
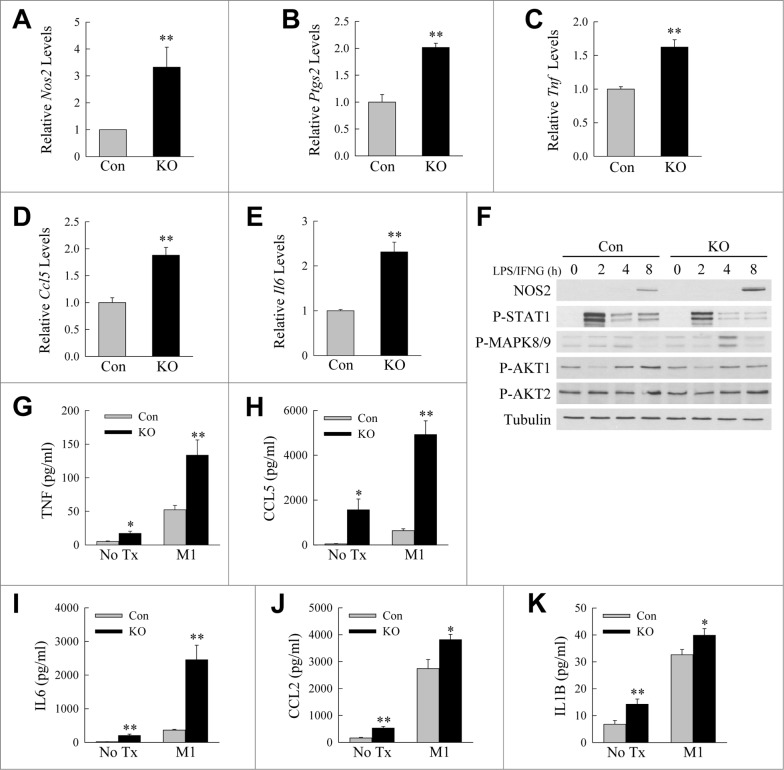
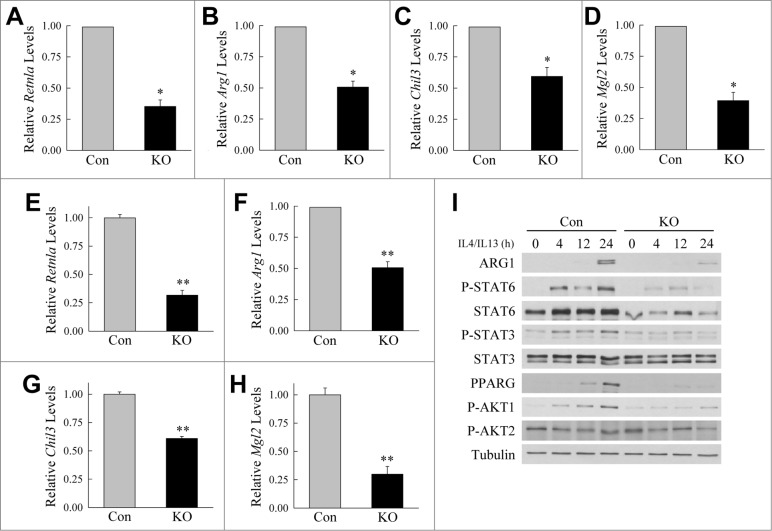
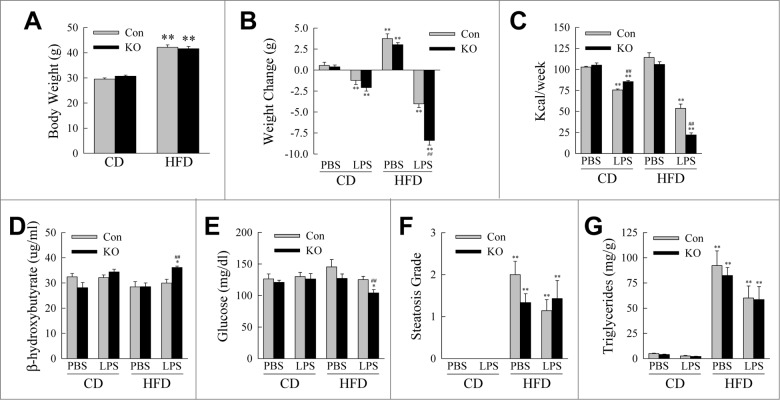
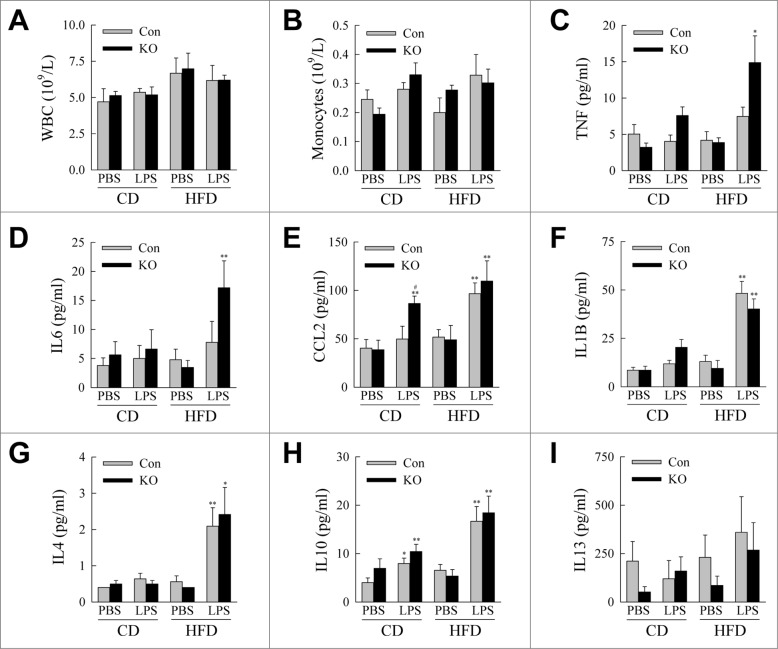
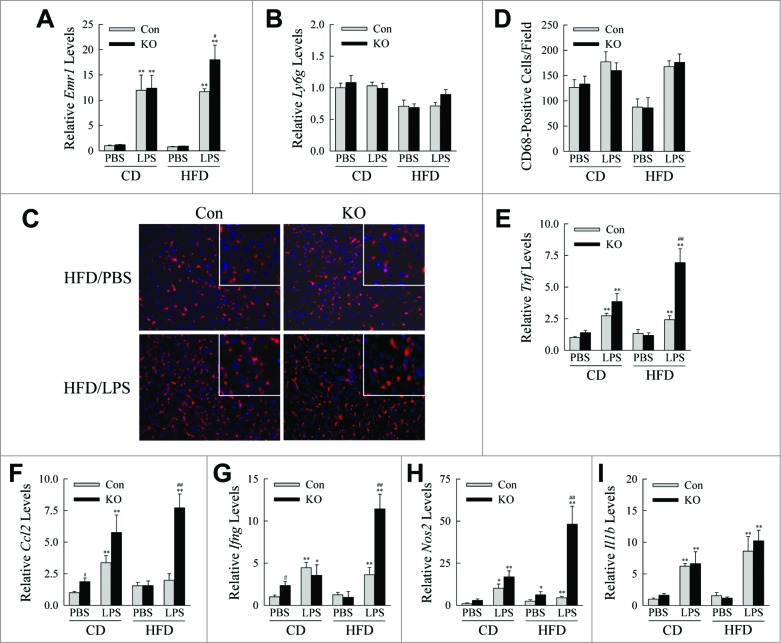
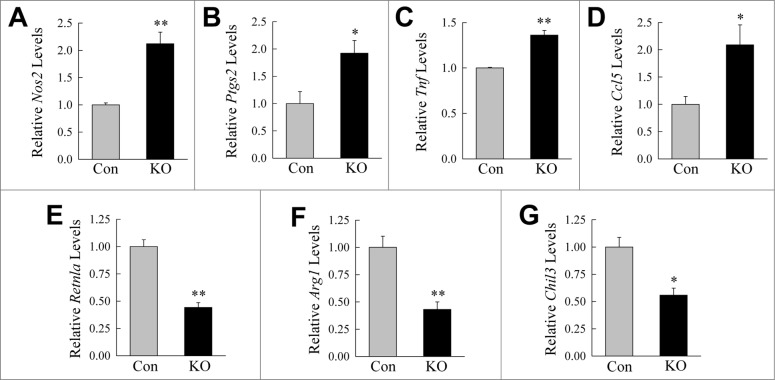
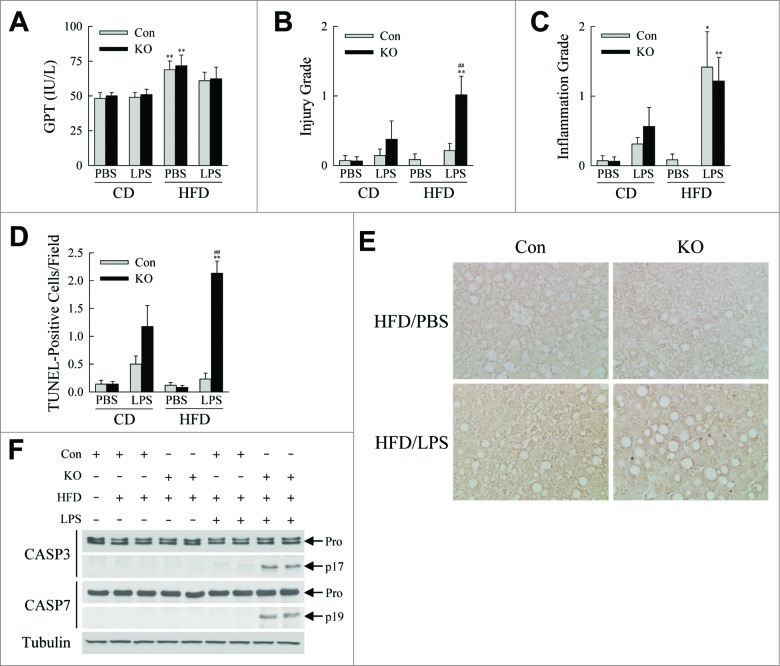
Recent evidence that excessive lipid accumulation can decrease cellular levels of autophagy and that autophagy regulates immune responsiveness suggested that impaired macrophage autophagy may promote the increased innate immune activation that underlies obesity. Primary bone marrow-derived macrophages (BMDM) and peritoneal macrophages from high-fat diet (HFD)-fed mice had decreased levels of autophagic flux indicating a generalized impairment of macrophage autophagy in obese mice. To assess the effects of decreased macrophage autophagy on inflammation, mice with a Lyz2-Cre-mediated knockout of Atg5 in macrophages were fed a HFD and treated with low-dose lipopolysaccharide (LPS). Knockout mice developed systemic and hepatic inflammation with HFD feeding and LPS. This effect was liver specific as knockout mice did not have increased adipose tissue inflammation. The mechanism by which the loss of autophagy promoted inflammation was through the regulation of macrophage polarization. BMDM and Kupffer cells from knockout mice exhibited abnormalities in polarization with both increased proinflammatory M1 and decreased anti-inflammatory M2 polarization as determined by measures of genes and proteins. The heightened hepatic inflammatory response in HFD-fed, LPS-treated knockout mice led to liver injury without affecting steatosis. These findings demonstrate that autophagy has a critical regulatory function in macrophage polarization that downregulates inflammation. Defects in macrophage autophagy may underlie inflammatory disease states such as the decrease in macrophage autophagy with obesity that leads to hepatic inflammation and the progression to liver injury.
Keywords: ARG1, arginase 1; BMDM, bone marrow-derived macrophages; CCL, chemokine (C-C motif) ligand; CD, chow diet; CHIL3/CHI3L3, chitinase-like 3; GAPDH, glyceraldehyde-3-phosphate dehydrogenase; GFP, green fluorescent protein; GPT, glutamic pyruvic transaminase, soluble; HFD, high-fat diet; IFNG, interferon gamma; IL, interleukin; Kupffer cells; LPS, lipopolysaccharide; MAP1LC3/LC3B, microtubule-associated protein 1 light chain 3 β; MAPK, mitogen-activated protein kinase; MGL2, macrophage galactose N-acetyl-galactosamine specific lectin 2; NOS2, nitric oxide synthase 2, inducible; PBS, phosphate-buffered saline; PTGS2, prostaglandin-endoperoxide synthase 2; RETNLA, resistin like α;; STAT, signal transducer and activator of transcription; TNF, tumor necrosis factor; TUNEL, terminal deoxynucleotide transferase-mediated deoxyuridine triphosphate nick end-labeling; WAT, white adipose tissue; autophagy; innate immunity; lipopolysaccharide; macrophage; obesity; polarization; qRT-PCR, quantitative real-time PCR; steatohepatitis.
Figures
Similar articles
-
Exercise training inhibits inflammation in adipose tissue via both suppression of macrophage infiltration and acceleration of phenotypic switching from M1 to M2 macrophages in high-fat-diet-induced obese mice.Exerc Immunol Rev. 2010;16:105-18. Exerc Immunol Rev. 2010. PMID: 20839495
-
FNDC5 attenuates adipose tissue inflammation and insulin resistance via AMPK-mediated macrophage polarization in obesity.Metabolism. 2018 Jun;83:31-41. doi: 10.1016/j.metabol.2018.01.013. Epub 2018 Jan 31. Metabolism. 2018. PMID: 29374559
-
Macrophage autophagy limits acute toxic liver injury in mice through down regulation of interleukin-1β.J Hepatol. 2016 Jan;64(1):118-27. doi: 10.1016/j.jhep.2015.08.019. Epub 2015 Aug 29. J Hepatol. 2016. PMID: 26325539 Free PMC article.
-
Decoding cell death signals in liver inflammation.J Hepatol. 2013 Sep;59(3):583-94. doi: 10.1016/j.jhep.2013.03.033. Epub 2013 Apr 6. J Hepatol. 2013. PMID: 23567086 Review.
-
Macrophage polarization and function with emphasis on the evolving roles of coordinated regulation of cellular signaling pathways.Cell Signal. 2014 Feb;26(2):192-7. doi: 10.1016/j.cellsig.2013.11.004. Epub 2013 Nov 9. Cell Signal. 2014. PMID: 24219909 Review.
Cited by
-
Pathophysiology of decompensated cirrhosis: Portal hypertension, circulatory dysfunction, inflammation, metabolism and mitochondrial dysfunction.J Hepatol. 2021 Jul;75 Suppl 1(Suppl 1):S49-S66. doi: 10.1016/j.jhep.2021.01.002. J Hepatol. 2021. PMID: 34039492 Free PMC article. Review.
-
Nitric oxide in liver diseases.Trends Pharmacol Sci. 2015 Aug;36(8):524-36. doi: 10.1016/j.tips.2015.05.001. Epub 2015 May 28. Trends Pharmacol Sci. 2015. PMID: 26027855 Free PMC article. Review.
-
A bibliometric analysis of autophagy in atherosclerosis from 2012 to 2021.Front Pharmacol. 2022 Sep 15;13:977870. doi: 10.3389/fphar.2022.977870. eCollection 2022. Front Pharmacol. 2022. PMID: 36188570 Free PMC article.
-
Immunoregulation by antigen-presenting cells in human intestinal lamina propria.Front Immunol. 2023 Feb 9;14:1138971. doi: 10.3389/fimmu.2023.1138971. eCollection 2023. Front Immunol. 2023. PMID: 36845090 Free PMC article. Review.
-
Autophagy, Metabolism, and Alcohol-Related Liver Disease: Novel Modulators and Functions.Int J Mol Sci. 2019 Oct 11;20(20):5029. doi: 10.3390/ijms20205029. Int J Mol Sci. 2019. PMID: 31614437 Free PMC article. Review.
References
-
- Deretic V, Saitoh T, Akira S. Autophagy in infection, inflammation and immunity. Nat Rev Immunol 2013; 13:722-37; PMID:24064518; http://dx.doi.org/10.1038/nri3532 - DOI - PMC - PubMed
-
- Levine B, Mizushima N, Virgin HW. Autophagy in immunity and inflammation. Nature 2011; 469:323-35; PMID:21248839; http://dx.doi.org/10.1038/nature09782 - DOI - PMC - PubMed
-
- Mosser DM, Edwards JP. Exploring the full spectrum of macrophage activation. Nat Rev Immunol 2008; 8:958-69; PMID:19029990; http://dx.doi.org/10.1038/nri2448 - DOI - PMC - PubMed
-
- Dupont N, Jiang S, Pilli M, Ornatowski W, Bhattacharya D, Deretic V. Autophagy-based unconventional secretory pathway for extracellular delivery of IL-1β. EMBO J 2011; 30:4701-11; PMID:22068051; http://dx.doi.org/10.1038/emboj.2011.398 - DOI - PMC - PubMed
-
- Nakahira K, Haspel JA, Rathinam VA, Lee SJ, Dolinay T, Lam HC, Englert JA, Rabinovitch M, Cernadas M, Kim HP, et al. . Autophagy proteins regulate innate immune responses by inhibiting the release of mitochondrial DNA mediated by the NALP3 inflammasome. Nat Immunol 2011; 12:222-30; PMID:21151103; http://dx.doi.org/10.1038/ni.1980 - DOI - PMC - PubMed
Publication types
MeSH terms
Grants and funding
LinkOut - more resources
Full Text Sources
Other Literature Sources
Molecular Biology Databases
Research Materials
Miscellaneous