. 2015 Apr;35(8):1316-28.
doi: 10.1128/MCB.01263-14. Epub 2015 Feb 2.

LIMK1 regulates long-term memory and synaptic plasticity via the transcriptional factor CREB

Affiliations

LIMK1 regulates long-term memory and synaptic plasticity via the transcriptional factor CREB

Zarko Todorovski et al. Mol Cell Biol. 2015 Apr.

Abstract

Deletion of the LIMK1 gene is associated with Williams syndrome, a unique neurodevelopmental disorder characterized by severe defects in visuospatial cognition and long-term memory (LTM). However, whether LIMK1 contributes to these deficits remains elusive. Here, we show that LIMK1-knockout (LIMK1(-/-)) mice are drastically impaired in LTM but not short-term memory (STM). In addition, LIMK1(-/-) mice are selectively defective in late-phase long-term potentiation (L-LTP), a form of long-lasting synaptic plasticity specifically required for the formation of LTM. Furthermore, we show that LIMK1 interacts and regulates the activity of cyclic AMP response element-binding protein (CREB), an extensively studied transcriptional factor critical for LTM. Importantly, both L-LTP and LTM deficits in LIMK1(-/-) mice are rescued by increasing the activity of CREB. These results provide strong evidence that LIMK1 deletion is sufficient to lead to an LTM deficit and that this deficit is attributable to CREB hypofunction. Our study has identified a direct gene-phenotype link in mice and provides a potential strategy to restore LTM in patients with Williams syndrome through the enhancement of CREB activity in the adult brain.


Figures

FIG 1
FIG 1
Selective deficits in LTM in LIMK1−/− mice in the water maze test. (A) Learning acquisition graph showing that both LIMK1−/− mice and their WT littermates were able to locate the hidden platform equally well during the 3 days of training. (B) Learning acquisition graph showing the distance traveled to locate the platform during the training period. (C) Results of the probe test carried out 2 h after the 3rd day of training showing that both LIMK1−/− mice and their WT littermates exhibited a significant bias toward the target zone, suggesting that STM was intact in LIMK1−/− mice. (D) Results of the probe test done at 48 h posttraining showing that WT mice but not LIMK1−/− mice exhibited a significant bias toward the target zone. (E) Results of a probe test done at 1 week posttraining showing that WT mice but not LIMK1−/− mice exhibited a significant bias toward the target zone, suggesting a deficit in LTM in LIMK1−/− mice. (F) During the probe test carried out 2 h after the training, neither LIMK1−/− mice nor WT mice spent a considerable amount of time searching around the perimeter of the water maze. (G, H) During the probe test carried out 48 h (G) and 1 week (H) after the training, LIMK1−/− mice spent significantly more time than the WT control mice searching around the perimeter of the water maze. (I to K) The swim speed recorded during the probe test at 2 h (I), 48 h (J), and 1 week (K) after the training showed no significant differences between LIMK1−/− mice and their WT littermates. Error bars represent SEMs. *, P < 0.05; n, number of animals; ns, no statistical significance.
FIG 2
FIG 2
Impaired LTM but not STM in LIMK1−/− mice in the fear conditioning test. (A) During the training phase, LIMK1−/− mice exhibited a similar amount of freezing as their WT littermates before and after the foot shock. (B) In an STM contextual test carried out 2 h after the training, LIMK1−/− mice showed a similar amount of freezing as their WT littermates. (C, D) In LTM tests carried out 48 h (C) or 1 week (D) after the training, LIMK1−/− mice showed significantly reduced freezing compared to their WT littermates. Error bars represent SEMs. *, P < 0.05; n, number of animals; ns, no statistical significance.
FIG 3
FIG 3
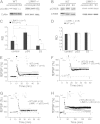
Selective L-LTP deficits in LIMK1−/− mice. (A) Plasticity induced by theta burst stimulation showing a significantly reduced L-LTP in LIMK1−/− mice compared to their WT littermates. (B) LTP induced by four trains of 100 Hz lasting 1 s each delivered at 5-min intertrain intervals showing that LIMK1−/− mice were significantly impaired in L-LTP compared to their WT littermates. Note that E-LTP was enhanced in LIMK1−/− mice. (C) Plasticity induced by four trains of 100 Hz lasting 1 s each delivered at 20-s intertrain intervals showing that LIMK1−/− mice were significantly impaired in L-LTP compared to their WT littermates. (D) Baseline recordings without LTP-inducing stimuli showing that synaptic responses were stable for up to 4 h in both WT and LIMK1−/− mice. Representative traces shown above the graphs were taken at the time points indicated by their respective numbers (1 and 2). Dashed lines indicate 100% and are shown for reference. Error bars represent SEMs. Arrows, L-LTP-inducing protocols; *, P < 0.05; n, number of animals.
FIG 4
FIG 4
Rescue of E-LTP but not L-LTP in LIMK1−/− mice by reduced cofilin activity. (A) Western blot analysis of total protein lysates prepared from hippocampal slices treated for 30 min with pS3 or S3 peptide or not treated (control) showing that pS3 increased the amount of phosphorylated cofilin (pCofilin) in WT and LIMK1−/− mice and that S3 decreased the amount of phosphorylated cofilin in WT but not LIMK1−/− mice. The level of total cofilin (A) and CREB or phosphorylated CREB (B) was not affected by either the pS3 or S3 peptide. (C) Summary graph of the Western blot shown in panel A showing a significant increase in the phosphorylated cofilin/cofilin relative density (RD) in slices from both WT and LIMK1−/− mice treated with pS3 peptide and a significant decrease in phosphorylated cofilin/cofilin in slices from WT but not LIMK1−/− mice treated with S3 peptide. Note that the basal phosphorylated cofilin/cofilin was significantly lower in slices from LIMK1−/− mice than those from WT mice. (D) Summary graph of the Western blot in panel B showing that neither the pS3 nor the S3 peptide had an effect on CREB or pCREB. (E) E-LTP induced by one train of HFS (100 Hz lasting 1 s) showing a significant enhancement of E-LTP in LIMK1−/− mice compared to that in WT mice. (F) E-LTP induced by one train of HFS (100 Hz lasting 1 s) in hippocampal slices treated with S3 peptide showing that the E-LTP in WT mice was increased to the level in LIMK1−/− mice. The S3 peptide had no effect on LIMK1−/− mice. (G) E-LTP induced by one train of HFS (100 Hz lasting 1 s) in hippocampal slices treated with pS3 peptides showing that enhanced E-LTP in LIMK1−/− mice was reduced to the level found in WT mice. The pS3 peptide had no effect on slices from WT mice. (H) L-LTP induced by four trains of HFS (100 Hz each lasting 1 s at 20-s intertrain intervals) showing that the pS3 peptide did not rescue the L-LTP deficit in LIMK1−/− mice. Traces above the graphs are representative responses taken from the indicated time points. Representative traces shown above the graphs were taken at the time points indicated by their respective numbers (1 and 2). Dashed lines indicate 100% and are shown for reference. Error bars represent SEMs. Arrows, LTP-inducing protocols; *, P < 0.05; ns, no significant difference; n, number of independent experiments (A to D) or number of animals (E to H).
FIG 5
FIG 5
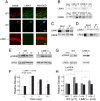
LIMK1 interacts with and regulates CREB. (A) (Top) WT mouse brain sectioned 10 μm thick coimmunostained with anti-CREB (red) and anti-LIMK1 (green) showing the colocalization of LIMK1 and CREB in the cell bodies of hippocampal CA1 neurons; (middle) cultured WT mouse hippocampal neuron (21 days in vitro) coimmunostained with anti-CREB (red) and anti-LIMK1 (green) showing coexpression of CREB and LIMK1 in the nucleus of the neuron; (bottom) LIMK1−/− mouse brain section 10 μm thick costained with anti-CREB (red) and anti-LIMK1 (green) showing no detectable LIMK1 immunoactivities. (B) Western blot analysis with anti-LIMK1 (top) or anti-CREB (bottom) of total brain lysates (input) and immunoprecipitates prepared by using anti-LIMK1 (LIMK1 IP), anti-CREB (CREB IP), or control IgG (IgG), showing that LIMK1 and CREB exist in one protein complex. Note that anti-LIMK1 pulled down both LIMK1 and CREB in WT mouse (+/+) but not in LIMK1−/− mouse (−/−) protein samples and that anti-CREB pulled down LIMK1 in WT mouse but not LIMK1−/− mouse samples. (C) LIMK1 and CREB interact in transfected HEK293 cells. Protein lysates were prepared from HEK293 cells cotransfected with either hemagglutinin (HA)-tagged or green fluorescent protein (GFP)-tagged LIMK1 and CREB, immunoprecipitated with hemagglutinin and green fluorescent protein, and probed with anti-LIMK1 (top) and anti-CREB (bottom), and the analyses show that LIMK1 and CREB exist in one protein complex. Inputs were WT and LIMK1−/− mouse brain lysates. (D) LIMK1 and CREB interact in hippocampal nuclear fraction. Total protein lysate (L), nuclear (N), and cytosolic (C) fractions were prepared from the hippocampus, immunoprecipitated with anti-LIMK1, and probed with anti-LIMK1 (top) and anti-CREB (bottom), and the analyses show that LIMK1 and CREB interact in the hippocampal nuclear fraction. Note that a small amount of LIMK1 was detected in the nuclear fraction, whereas a small amount of CREB was found in the cytosolic fraction. (E, F) Western blot analysis of hippocampal protein lysates (E) and summary graph (F) showing that NMDA treatment (30 μM NMDA plus 10 μM glycine) for 0 to 10 min (the times are indicated above the lanes in panel E) induced a significant increase in the amount of pCREB at serine 133 in slices from WT mice and that this NMDA-induced pCREB upregulation was significantly reduced in slices from LIMK1−/− mice at 10 min following treatment. The level of total CREB in slices from either WT or LIMK1−/− mice was not affected by NMDA treatment. (G, H) Western blot analysis of dissected hippocampal CA1 areas (G) and summary graph (H) showing that an L-LTP-inducing protocol (HFS) elicited a significant increase in pCREB in slices from WT mice and that this HFS-induced pCREB upregulation was significantly reduced in slices from LIMK1−/− mice. The level of total CREB was not affected by HFS in slices from either WT or LIMK1−/− mice. Error bars represent SEMs. *, P < 0.05; n, number of independent experiments.
FIG 6
FIG 6
Rescue of L-LTP by enhanced CREB activity. (A) Western blot analysis of total protein lysates prepared from hippocampal slices treated with forskolin for 10 min (lanes 10) showing increased pCREB but not CREB compared to that in untreated slices (lanes 0) for both LIMK1−/− mice and their WT littermates. (B) Summary graph of the Western blots shown in panel A showing a significant increase in the levels of pCREB and CREB in hippocampal slices treated with forskolin (10 min) compared to the levels in untreated slices. (C) Western blot analysis of total brain protein lysates prepared from mice treated with intraperitoneal injections of rolipram (R) or the DMSO vehicle (V) showing that rolipram enhanced pCREB but not CREB levels in both LIMK1−/− mice and their WT littermates. (D) Summary graph of the Western blots shown in panel C showing a significant increase in the levels of pCREB and CREB in mice treated with rolipram compared to that in mice treated with DMSO. (E to H) Western blot experiments showing that neither forskolin (E, F) nor rolipram (G, H) had an effect on cofilin or phosphorylated cofilin. (I, J) Plasticity induced by HFS (four trains of 100 Hz lasting 1 s each delivered at 20-s intertrain intervals) showing that L-LTP in LIMK1−/− mice was completely rescued to the level in WT mice by coapplication of 50 μM forskolin (solid line) during HFS (arrows) (I) or rolipram injections (J). Representative traces shown above the graphs were taken at the time points indicated by their respective numbers (1 and 2). Dashed lines indicate 100% and are shown for reference. Error bars represent SEMs. *, P < 0.05; n, number of independent experiments (A to H) and number of animals (I and J).
FIG 7
FIG 7
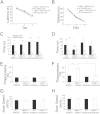
Rescue of spatial LTM in LIMK1−/− mice by enhanced CREB activity (A, B) Learning acquisition graphs of the results of water maze training showing no differences in latency (A) and travel distance (B) to locate the hidden platform between LIMK1−/− mice and their WT littermates treated with rolipram or vehicle (DMSO). (C) Results of a probe test carried out 2 h after the training showing that all groups showed a significant bias toward the target zone. (D) Results of a probe test carried out 48 h after the training showing that LIMK1−/− mice treated with rolipram but not those treated with DMSO displayed a significant bias toward the target zone. (E to H) Locomotor behavior of LIMK1−/− and WT mice treated with rolipram. (E) Results of a probe test carried out 2 h after the training showing that all mice treated with either vehicle (DMSO) or rolipram spent a similar amount of time searching around the perimeter of the water maze. (F) Results of a probe test carried out 48 h after the training showing that LIMK1−/− mice treated with DMSO spent significantly more time searching around the perimeter of the water maze than LIMK1−/− mice treated with rolipram or WT mice treated or not treated with rolipram. (G, H) Swim speeds in the probe test recorded 2 h (G) and 48 h (H) after training showing no differences between LIMK1−/− mice and their WT littermates treated with DMSO or rolipram. Error bars represent SEMs. *, P < 0.05; ns, no statistical significance; n, number of animals.
FIG 8
FIG 8
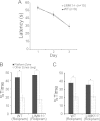
Rescue of spatial LTM in LIMK1−/− mice by enhanced CREB activity with bilateral local hippocampal injections of rolipram (0.1 μmol/kg). (A) Learning acquisition graph of the results of water maze training showing no differences in the latency to locate the hidden platform between LIMK1−/− mice and their WT littermates injected with rolipram or vehicle (DMSO). (B) Results of a probe test carried out 2 h after training showing that all groups showed a significant bias toward the target zone. (C) Results of a probe test carried out 48 h after the training showing that LIMK1−/− mice treated with hippocampal local injections of rolipram displayed a significant bias toward the target zone.
FIG 9
FIG 9
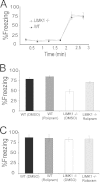
Rescue of LTM of fear in LIMK1−/− mice by rolipram treatment. (A) During the training phase, both LIMK1−/− mice and their WT littermates showed similar amounts of freezing before and after the foot shock. After the training, mice were randomly selected for rolipram or DMSO injections, and then STM and LTM were tested at 2 and 48 h posttraining, respectively. (B) All groups performed equally well in the STM test. (C) In the LTM test, LIMK1−/− mice treated with rolipram performed significantly better than LIMK1−/− mice treated with DMSO and similarly to their WT littermates. Error bars represent SEMs. *, P < 0.05; n, number of animals.
FIG 10
FIG 10
Impaired L-LTP and LTM in LIMK1+/− mice. (A) LTP induced by HFS (four trains of 100 Hz lasting 1 s each delivered at 20-s intertrain intervals) showing that L-LTP was diminished in LIMK1+/− mice and that this impaired L-LTP was rescued by coapplication of 50 μM forskolin during HFS (arrows). (B, C) Learning acquisition graphs of the results of the water maze test showing no differences in either latency (B) or travel distance (C) to locate the hidden platform between LIMK1+/− mice and their WT littermates. (D) Results of a probe test carried out 2 h after the 3rd day of training showing that both LIMK1+/− mice and their WT littermates exhibited a significant bias toward the target zone, suggesting that STM was intact in LIMK1+/− mice. (E) Results of a probe test done at 48 h posttraining showing that LIMK1+/− mice exhibited a significantly reduced bias toward the target zone compared to their WT littermates. Representative traces shown above the graphs were taken at the time points indicated by their respective numbers (1 and 2). Dashed lines indicate 100% and are shown for reference. Error bars represent SEMs. *, P < 0.05; n, number of animals.

Similar articles

Cited by

References

    1. Pober BR. 2010. Williams-Beuren syndrome. N Engl J Med 362:239–252. doi:10.1056/NEJMra0903074. - DOI - PubMed
    1. Mervis CB, Robinson BF, Bertrand J, Morris CA, Klein-Tasman BP, Armstrong SC. 2000. The Williams syndrome cognitive profile. Brain Cogn 44:604–628. doi:10.1006/brcg.2000.1232. - DOI - PubMed
    1. Meyer-Lindenberg A, Mervis CB, Berman KF. 2006. Neural mechanisms in Williams syndrome: a unique window to genetic influences on cognition and behaviour. Nat Rev Neurosci 7:380–393. doi:10.1038/nrn1906. - DOI - PubMed
    1. Bellugi U, Lichtenberger L, Jones W, Lai Z, St George M. 2000. I. The neurocognitive profile of Williams syndrome: a complex pattern of strengths and weaknesses. J Cogn Neurosci 12(Suppl 1):S7–S29. doi:10.1162/089892900561959. - DOI - PubMed
    1. Mervis CB, John AE. 2010. Cognitive and behavioral characteristics of children with Williams syndrome: implications for intervention approaches. Am J Med Genet C Semin Med Genet 154C:229–248. doi:10.1002/ajmg.c.30263. - DOI - PMC - PubMed

Publication types

MeSH terms

Substances