. 2015 Feb 9;212(2):253-65.
doi: 10.1084/jem.20141703. Epub 2015 Jan 26.

PDK1 orchestrates early NK cell development through induction of E4BP4 expression and maintenance of IL-15 responsiveness

Affiliations

PDK1 orchestrates early NK cell development through induction of E4BP4 expression and maintenance of IL-15 responsiveness

Meixiang Yang et al. J Exp Med. .

Abstract

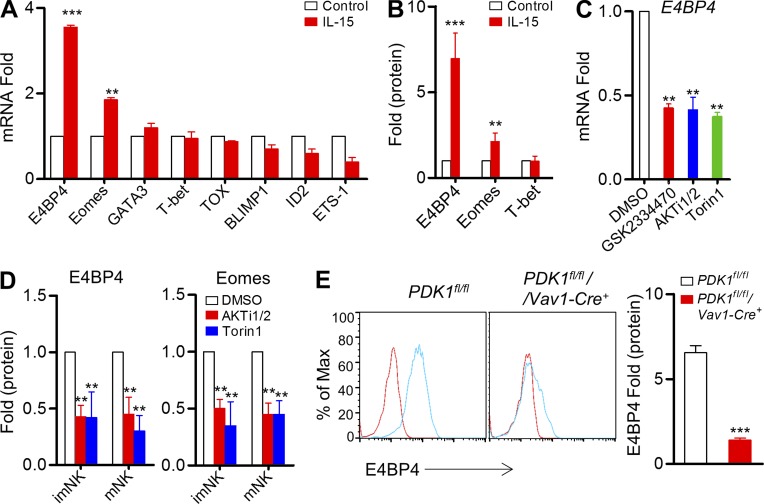
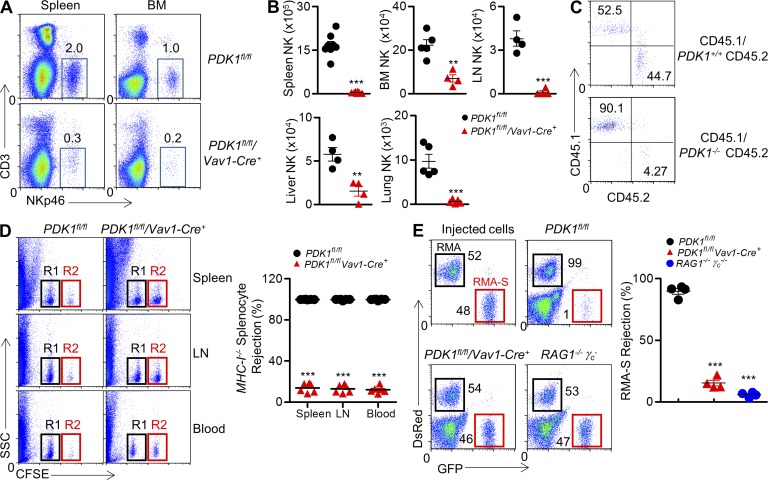
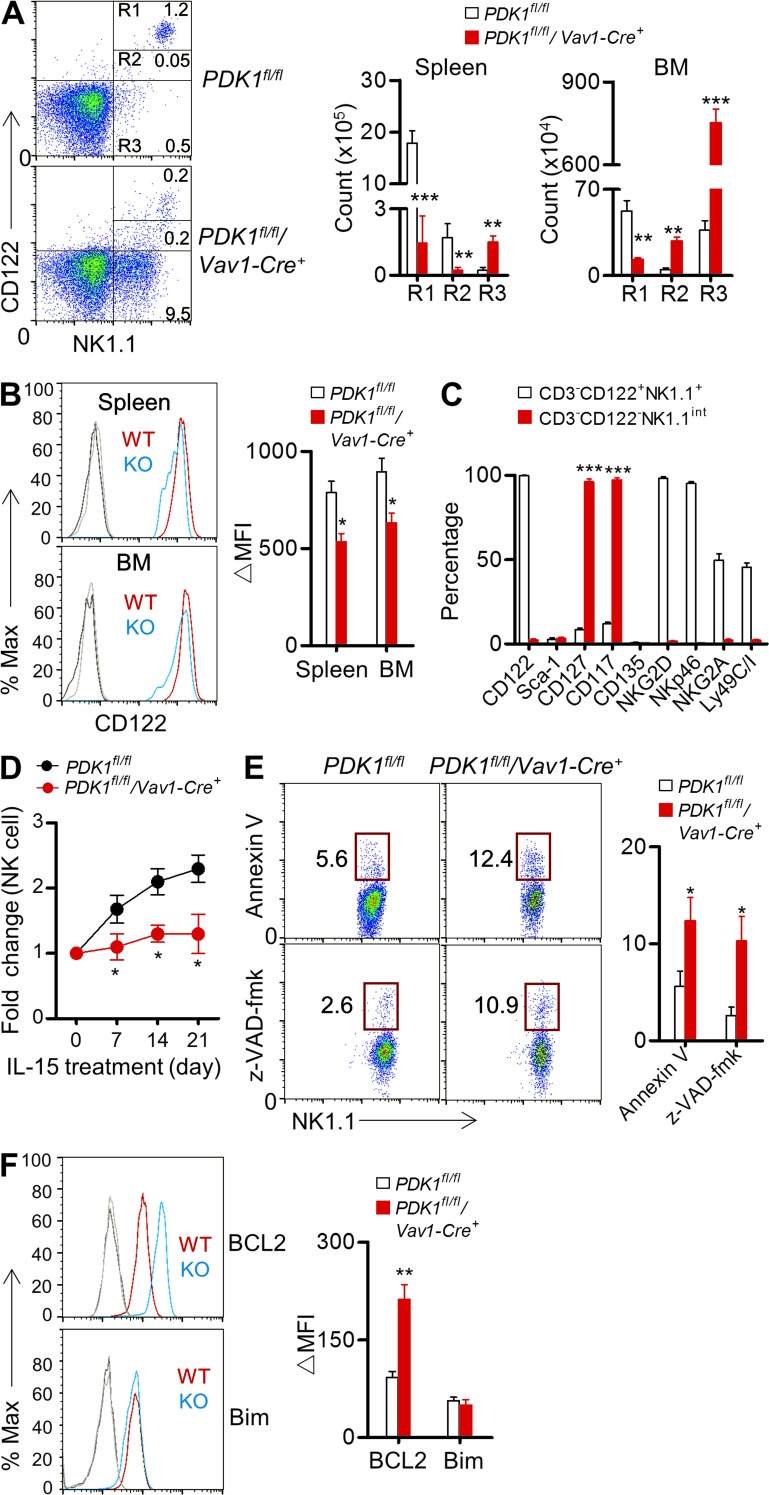
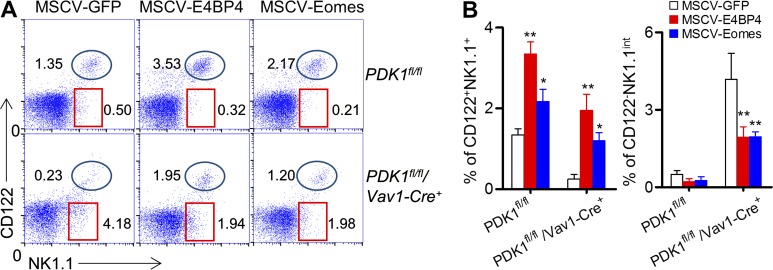
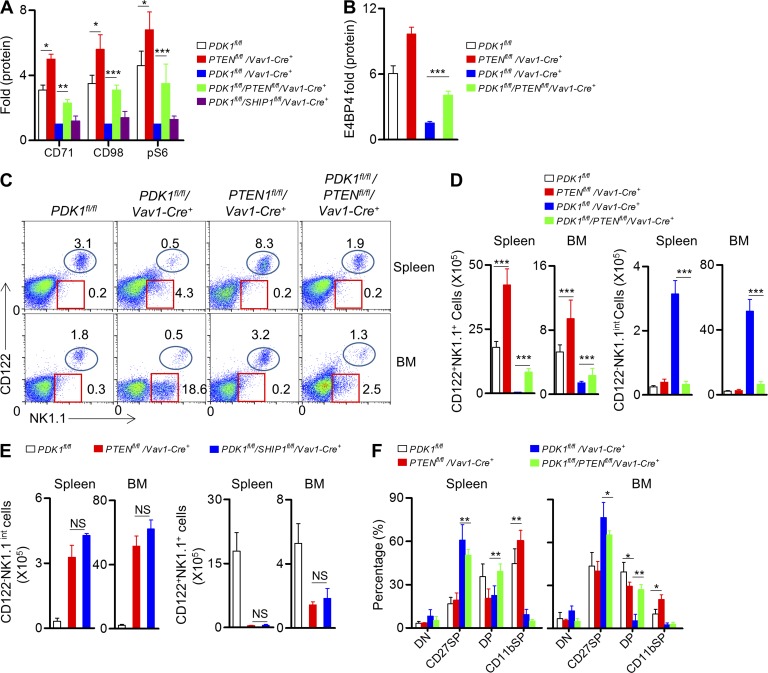
E4BP4, a circadian protein, is indispensable for NK cell development. It remains largely unknown which signal is required to induce E4BP4 expression and what effects it has during NK cell differentiation. Here, we reveal that PDK1, a kinase upstream of mTOR, connects IL-15 signaling to E4BP4. Early deletion of PDK1 caused a severe loss of NK cells and compromised antitumor activity in vivo. PDK1-deficient NK cells displayed much weaker IL-15-induced mTOR activation and E4BP4 induction, as well as remarkable reduction in CD122, a receptor subunit specifying NK cell responsiveness to IL-15. The phenotypes were partially reversible by ectopic expression of E4BP4 or bypassed activation of mTOR. We also determined that PDK1-mediated metabolic signaling was dispensable for NK cell terminal maturation and survival. Thus, we identify a role for PDK1 signaling as a key mediator in regulating E4BP4 expression during early NK cell development. Our findings underscore the importance of IL-15 self-responsiveness through a positive feedback loop that involves PDK1-mTOR-E4BP4-CD122 signaling.


Figures

Figure 1.
Figure 1.
PDK1-mTOR signaling regulates IL-15–induced E4BP4 expression in vitro. (A) Quantitative RT-PCR analysis of NK cell–related genes in sorted wild-type CD3NK1.1+ cells before and after stimulation with IL-15–IL-15R complexes; the results were normalized to those of β-actin and are presented relative to those of untreated cells, set as 1. Data were pooled from three independent experiments. **, P < 0.005; ***, P < 0.0005 versus control. (B) Intracellular staining was used to analyze the expression of E4BP4, Eomes, and T-bet on gated CD3NK1.1+ cells by flow cytometry before and after stimulation with IL-15–IL-15R complexes; the results were normalized and are presented relative to MFI of untreated cells, set as 1. Data were pooled from four independent experiments. **, P < 0.005; ***, P < 0.0005 versus control. (C) Quantitative RT-PCR analysis of E4bp4 in sorted wild-type CD3NK1.1+ cells after stimulation with IL-15–IL-15R complexes in the presence of the indicated inhibitors or of DMSO (control); the results were normalized to those of β-actin and are presented relative to those of DMSO-treated cells, set as 1. Data represent the mean ± SEM (3 repeats). **, P < 0.005 versus DMSO. (D) Intracellular staining was used to analyze the expression of E4BP4 and Eomes on gated CD3NK1.1+ cells by flow cytometry after stimulation with IL-15–IL-15R complexes plus indicated inhibitors; the results were normalized and are presented relative to those of DMSO-treated cells, set as 1. Data represent the mean ± SEM (3 repeats). **, P < 0.005 versus DMSO. (E) Intracellular staining was used to analyze the expression of E4BP4 in CD3CD122high NK1.1+ NK cells by flow cytometry from indicated mice before and after stimulated with IL-15–IL-15R complexes. Representative overlaid histogram is shown (left). Red lines, unstimulated; Blue lines, stimulated. Results are presented relative to MFI values before treatment. Data were pooled from two independent experiments (right, n = 4). ***, P < 0.0005.
Figure 2.
Figure 2.
Severely reduced NK cellularity and loss of NK cell activity in PDK1-deficient mice. (A) CD3NKp46+ NK cells were isolated from spleen and bone marrow, and percentages are indicated in representative flow cytometric plots. (B) Absolute numbers of CD3NKp46+ NK cells are also indicated in tissues and organs from PDK1fl/fl and PDK1fl/fl/Vav1-Cre+ mice. Each symbol represents an individual mouse; small horizontal lines indicate the mean. Data were pooled from two individual experiments (n = 4 or more). **, P < 0.005; ***, P < 0.0005. (C) Mice were treated with 5-FU before bone marrow was isolated and depleted of B220+ and CD3+ and NK1.1+ cells. Depleted bone marrow from CD45.1 WT mice was mixed with either WT or PDK1−/− bone marrow cells expressing CD45.2 at a 1:1 ratio. Cells were then injected into sublethally irradiated RAG1−/−γc recipient mice. CD45.1 versus CD45.2 expression on gated CD3CD122+NKp46+ was detected by flow cytometry. The numbers show the percentages in relevant quadrant. (D, left) Representative flow cytometry of CFSE+ cells obtained from spleen, LN, or blood of the indicated recipient mice 18 h after injection with an equal number of WT or β2-microglobulin (β2M)–deficient splenocytes labeled with various concentrations of the cytosolic dye CFSE. R1, CFSElow splenocytes from WT mice; R2, CFSEhigh splenocytes from β2M-deficient mice. (D, right) Quantification of the percent rejection of β2M-deficient splenocytes. Each symbol represents an individual mouse; small horizontal lines indicate the mean (n = 6 mice per group). (E) Representative flow cytometry plot (left) and quantification of the percentages (right, percent rejection) of RMA-S cells in the peritoneal cavity on 18 h after intraperitoneal injection in the indicated mice. A mixture of NK cell–sensitive RMA-S cells expressing green fluorescent protein (GFP; outlined in red) together with NK cell-resistant RMA cells expressing the fluorescent protein DsRed (outlined in black) were injected. The numbers near square boxes represent percentages of RMA-S or RMA relative to the total number of injected cells. Immunocompromised RAG1−/−γc mice were used as a control. Injected cells are shown. Each symbol represents an individual mouse; small horizontal lines indicate the mean (n = 4 mice per group). Data are representative of two independent experiments. ***, P < 0.0005.
Figure 3.
Figure 3.
PDK1 regulates CD122 expression and IL-15 responsiveness in vivo. (A) Representative flow cytometry profile of CD122 versus NK1.1 expression on CD3 bone marrow cells. Three populations, CD122highNK1.1+ (R1), CD122intNK1.1int (R2), and CD122NK1.1int (R3), are outlined (left). Absolute numbers of indicated NK cell populations from spleen and bone marrow are also shown (right). Data were pooled from two independent experiments (n = 6). **, P < 0.005, ***, P < 0.0005. (B). Representative overlaid histograms demonstrating CD122 expression on gated R1 NK cells in the spleens and BM of PDK1fl/fl (WT) and PDK1fl/fl/Vav1-Cre+ (KO) mice (left); the absolute MFI (ΔMFI) were quantified (right). Data were pooled from two independent experiments (n = 6). *, P < 0.05. (C). Profiling developmental markers on BM CD3CD122+NK1.1+ cells from PDK1fl/fl mice and BM CD3CD122NK1.1int NK cells in PDK1fl/fl/ Vav1-Cre+ mice. n = 5 per group. ***, P < 0.0005. (D). PDK1fl/fl or PDK1fl/fl/Vav1-Cre+ mice were injected with IL-15–IL-15R complexes every 3 d. The absolute number of peripheral blood CD3NKp46+NK cells was monitored on the indicated days. Fold change was calculated simply as the ratio of the NK cell number at each time point after IL-15–IL-15R treatment to the initial NK cell number in untreated mice (day 0). Data represent the mean ± SEM of 3 mice per time point and are representative of two independent experiments. *, P < 0.05. (E) Representative flow cytometry plot showing Annexin V staining and Caspase activity in naive NK cells from the indicated mice (left). Numbers adjacent to the outlined areas (left) indicate the percentage of Annexin V– or caspase-positive cells. Quantifications were performed from two independent experiments (right, n = 5). *, P < 0.05. (F). Intracellular staining of Bcl2 and Bim in naive NK cells from the indicated mice (left). Quantifications were performed from two independent experiments (right, n = 5). **, P < 0.005.
Figure 4.
Figure 4.
Ectopic expression of E4BP4 or Eomes rescues PDK1-deficient NK cell development. (A) PDK1fl/fl and PDK1fl/fl/Vav1-Cre+ mice were treated with 5-FU for 4 d, and bone marrow cells were collected for spin infection with MSCV retrovirus encoding control GFP, E4BP4, or Eomes, respectively. The infected BM cells were then transferred into RAG1−/−γc mice. After 6 wk, CD122 versus NK1.1 expression on gated CD3 cells was analyzed by flow cytometry. The numbers in the outlined areas indicate the percent of CD3 cells. (B) Percentages of CD3CD122+NK1.1+ and CD3CD122NK1.1int were enumerated as shown. Data were pooled from three independent experiments. n = 5–7. *, P < 0.05; **, P < 0.005.
Figure 5.
Figure 5.
IL-15 augments NK cell metabolic activation and proliferation via PI3K–PDK1–mTOR signaling. Splenocytes from PDK1fl/fl or PDK1fl/fl/Vav1-Cre+ mice were stimulated with recombinant IL-15–IL-15R complexes overnight. (A) Expression of CD71 and CD98 was detected by flow cytometry (left) and was quantified as mean fluorescence intensity. The results are presented relative to unstimulated cells, set as 1 (right). Data represent the mean ± SEM of 5 mice per group. **, P < 0.005. (B). Intracellular phosphorylated S6, AKT T308, and AKT S473 were detected by flow cytometry (left), and the MFI was calculated. The protein expression levels in PDK1 fl/fl NK cells are presented relative to PDK1fl/fl/Vav1-Cre+ mice, set as 1 (right). Data represent the mean ± SEM of 3 mice per group. Data are representative of two independent experiments. **, P < 0.005. (C) WT bone marrow cells were stimulated with recombinant IL-15–IL-15R complexes overnight in the presence of the indicated pharmacological inhibitors or DMSO, as a negative control. Flow cytometry was used to detect CD71 and CD98, and quantification is presented as the MFI. Data represent the mean ± SEM of 3 independent experiments. **, P < 0.005, ***, P < 0.0005. (D) WT mice were injected with IL-15–IL-15R complexes every 3 d together with the mTOR inhibitor Torin1 or DMSO. The absolute number of peripheral blood CD3NKp46+NK cells was quantified on the indicated days. Fold change was calculated as describe in Fig. 3 D. Data represent the mean ± SEM of 3 mice per time point and are representative of two independent experiments. *, P < 0.05.
Figure 6.
Figure 6.
Deletion of PTEN, but not SHIP1, alternatively activates mTOR signaling and rescues the early development of PDK1-deficient NK cells. (A) Splenocytes from the indicated mice were stimulated with recombinant IL-15–IL-15R complexes overnight. Flow cytometry was used to detect CD71, CD98, and intracellular phosphorylated S6 (pS6). The results are presented relative to the expression in unstimulated CD3CD122high NK1.1+ cells in the respective genotype mice. Data represent the mean ± SEM of 3 mice and are representative of two independent experiments. (B) Intracellular staining was used to analyze the expression of E4BP4 in CD3CD122high NK1.1+ NK cells from the indicated mice before and after IL-15–IL-15R complexes. Results are presented relative to MFI value before treatment. Data were pooled from two independent experiments (n = 4). ***, P < 0.0005. (C) Expression of CD122 versus NK1.1 on gated CD3 splenocytes and BM cells from the indicated mice was examined by flow cytometry. The numbers outlined indicate the percent of cells in each mouse. (D) The quantification of absolute numbers of CD3CD122+NK1.1+ (left) and CD3CD122NK1.1int NK cells (right) is also presented. Data represent the mean ± SEM of 3 mice and are representative of two independent experiments. ***, P < 0.0005. (E). Expression of CD122 versus NK1.1 on gated CD3splenocytes and BM cells from the indicated mice was examined by flow cytometry. Absolute numbers of CD3CD122NK1.1int (left) and CD3CD122+NK1.1+NK (right) cells are presented. Data were pooled from two independent experiments (n = 6). NS, not significant. (F) Expression of CD27 or CD11b on CD3NKp46+ splenocytes and BM cells from the indicated mice was analyzed by flow cytometry. The representative profiles represent the four-stage development of NK cells, including CD27CD11b(DN), CD27+CD11b(CD27SP), CD27+CD11b+(DP), and CD27CD11b+(CD11b SP). The results are presented as the percentage of cells. Data represent the mean ± SEM of 3 mice and are representative of two independent experiments. *, P < 0.05, **, P < 0.005.
Figure 7.
Figure 7.
PDK1 signaling is dispensable for NK cell terminal maturation and survival. (A) Representative flow cytometric profiles of NK1.1 versus NKp46 expression in splenic and BM CD3 cells from the indicated mice. Numbers show the percentages in square boxes among gated CD3 cells. (B and C) Flow cytometry analysis of NK1.1 versus CD122 expression in splenic CD3 cells in Rosa26 DTASTOP and Rosa26 DTASTOP/Ncr1-Cre+mice (left). Expression of CD27 versus CD11b on CD3NK1.1+CD122+ NK cells was further analyzed (right). The numbers indicate the percentages of cells in each quadrant. (C) Absolute number of splenic CD3CD122+NK1.1+ cells (left) and four-stage differentiating NK cell subsets (left), including DN, CD27SP, DP, and CD11bSP, were quantified in Rosa26 DTASTOP and Rosa26 DTASTOP/Ncr1-Cre+ mice. n = 4. ***, P < 0.0005. (D) Flow cytometry analysis of NK1.1 versus CD122 expression in CD3-negative splenic and BM cells of PDK1fl/fl and PDK1fl/fl/Ncr1-Cre+ mice. Numbers show the percentages in indicated circles among gated CD3 cells. (E) The absolute numbers of NK cells (CD3NKp46+) in the spleens and BM of PDK1fl/fl and PDK1fl/fl/Ncr1-Cre+ mice were also quantified. Data were pooled from two independent experiments (n = 5–7). NS, not significant. (F) Representative flow cytometric profiles of the four-stage NK cell development, including CD27CD11b(DN), CD27+CD11b(CD27SP), CD27+CD11b+(DP), and CD27CD11b+(CD11b SP), from gated CD3NK1.1+ NK cells in the spleens and BM of PDK1fl/fl and PDK1fl/fl/Ncr1-Cre+ mice are shown. The numbers indicate the percentages of cells in each quadrant.

Similar articles

Cited by

References

    1. Awasthi A., Samarakoon A., Dai X., Wen R., Wang D., and Malarkannan S.. 2008. Deletion of PI3K-p85alpha gene impairs lineage commitment, terminal maturation, cytokine generation and cytotoxicity of NK cells. Genes Immun. 9:522–535 10.1038/gene.2008.45 - DOI - PMC - PubMed
    1. Baracho G.V., Cato M.H., Zhu Z., Jaren O.R., Hobeika E., Reth M., and Rickert R.C.. 2014. PDK1 regulates B cell differentiation and homeostasis. Proc. Natl. Acad. Sci. USA. 111:9573–9578 10.1073/pnas.1314562111 - DOI - PMC - PubMed
    1. Chi H.2012. Regulation and function of mTOR signalling in T cell fate decisions. Nat. Rev. Immunol. 12:325–338. - PMC - PubMed
    1. Cortez V.S., Fuchs A., Cella M., Gilfillan S., and Colonna M.. 2014. Cutting edge: Salivary gland NK cells develop independently of Nfil3 in steady-state. J. Immunol. 192:4487–4491 10.4049/jimmunol.1303469 - DOI - PubMed
    1. Crotta S., Gkioka A., Male V., Duarte J.H., Davidson S., Nisoli I., Brady H.J., and Wack A.. 2014. The transcription factor E4BP4 is not required for extramedullary pathways of NK cell development. J. Immunol. 192:2677–2688 10.4049/jimmunol.1302765 - DOI - PMC - PubMed

Publication types

MeSH terms

Substances