. 2015 Mar;21(3):438-57.
doi: 10.1261/rna.047258.114. Epub 2015 Jan 20.

Prp40 pre-mRNA processing factor 40 homolog B (PRPF40B) associates with SF1 and U2AF65 and modulates alternative pre-mRNA splicing in vivo

Affiliations

Prp40 pre-mRNA processing factor 40 homolog B (PRPF40B) associates with SF1 and U2AF65 and modulates alternative pre-mRNA splicing in vivo

Soraya Becerra et al. RNA. 2015 Mar.

Abstract

The first stable complex formed during the assembly of spliceosomes onto pre-mRNA substrates in mammals includes U1 snRNP, which recognizes the 5' splice site, and the splicing factors SF1 and U2AF, which bind the branch point sequence, polypyrimidine tract, and 3' splice site. The 5' and 3' splice site complexes are thought to be joined together by protein-protein interactions mediated by factors that ensure the fidelity of the initial splice site recognition. In this study, we identified and characterized PRPF40B, a putative mammalian ortholog of the U1 snRNP-associated yeast splicing factor Prp40. PRPF40B is highly enriched in speckles with a behavior similar to splicing factors. We demonstrated that PRPF40B interacts directly with SF1 and associates with U2AF(65). Accordingly, PRPF40B colocalizes with these splicing factors in the cell nucleus. Splicing assays with reporter minigenes revealed that PRPF40B modulates alternative splice site selection. In the case of Fas regulation of alternative splicing, weak 5' and 3' splice sites and exonic sequences are required for PRPF40B function. Placing our data in a functional context, we also show that PRPF40B depletion increased Fas/CD95 receptor number and cell apoptosis, which suggests the ability of PRPF40B to alter the alternative splicing of key apoptotic genes to regulate cell survival.

Keywords: PRPF40B; alternative splicing; mRNA processing.


Figures

FIGURE 1.
FIGURE 1.
PRPF40B is enriched in splicing factor-rich nuclear speckles. (A) Endogenous PRPF40B was detected with IgG-purified polyclonal antibodies. HEK293T and HeLa cells were dual-stained with antibodies to detect PRPF40B (green) and SRSF2 (red), and merged images are shown. Line scans with local intensity distributions are represented at the right. The bar in the merged panel indicates the position of the line scans. Bar, 3 mm. (B) Immunofluorescence analysis was performed to determine the location of PRPF40B. HEK293T or HeLa cells were transfected with an EGFP-tagged PRPF40B construct (green) and labeled with antibodies directed against the essential splicing factor SRSF2 (red) to stain nuclear speckles. Individual staining and the superimposition of both images (merge) are shown. Line scans showing local intensity distributions of dual staining are represented to the right of the panels. A bar in the merged panel indicates the position of the line scans. Bar, 3 mm.
FIGURE 2.
FIGURE 2.
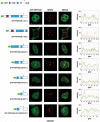
Subcellular localization of PRPF40B. HEK293T cells expressing EGFP-tagged PRPF40B constructs (green) were immunolabeled with SRSF2 antibody (red). Schematic diagrams of the EGFP-PRPF40B fusion proteins are shown at the left of each panel. The numbers in parentheses represent the PRPF40B amino acids contained in the construct. GFP protein, the two WW domains, the putative nuclear localization signal (NLS), and the five FF domains are indicated. Individual and merged images of the cell are shown. Line scans showing the local intensity distribution of the dual staining are represented to the right of the panels. The bars in the merged panels indicate the position of the line scans. Bar, 3 mm.
FIGURE 3.
FIGURE 3.
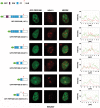
Role of PRPF40B FF domains in nucleolar exclusion. HEK293T cells expressing EGFP-tagged PRPF40B proteins (green) were immunolabeled with anti-NOLC1 antibodies (red). Individual and merged images of the cells are shown. Line scans showing the local intensity distribution of the dual staining are represented to the right of the panels. Labeling in the figure is the same as in the Figure 2 legend. Bar, 3 mm.
FIGURE 4.
FIGURE 4.
Colocalization of PRPF40B with nuclear speckles is not perturbed following RNase treatment or transcription inhibition. (A) After EGFP-PRPF40B expression, HEK293T cells were treated with RNase A. SRSF2 (left panel) and Sm (right panel) labeling were used as negative and positive controls, respectively. Individual staining and merged images of cells are shown. Bars, 3 mm. (B) HeLa cells were treated with α-amanitin after EGFP-PRPF40B expression. Then, the samples were processed for immunofluorescence analysis. Individual staining of PRPF40B (green), SRSF2 (red), and merged images of untreated (upper panel) or treated (lower panel) cells are shown. Line scans showing the local intensity distribution of PRPF40B in green and SRSF2 in red are shown to the right of the panels. Bars in the merged panels indicate the position of the line scans. Bars, 3 mm.
FIGURE 5.
FIGURE 5.
Colocalization of PRPF40B with the splicing factors SF1 (A) and U2AF65 (B). Immunofluorescence analysis of HeLa (lower panels) and HEK293T (upper panels) cells dual-labeled with antibodies to detect PRPF40B and SF1 (A) or U2AF65 (B). The merged images represent a superimposition of PRPF40B (green) and SF1 or U2AF65 (red) labeling. Line scans showing the local intensity distribution of dual staining are shown to the right of the panels. Bars in the merged panels indicate the position of the line scans. Bars, 3 mm.
FIGURE 6.
FIGURE 6.
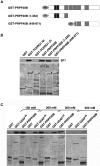
PRPF40B associates with the splicing factors SF1 and U2AF65 in vitro. (A) Schematic representations of the GST-PRPF40B fusion proteins are shown. The numbers in parentheses represent the PRPF40B amino acids contained in the constructs. The two WW domains and five FF domains are indicated. (B) Both the amino- and carboxyl-terminal portions of PRPF40B are important for interacting with SF1. Recombinant full-length GST-PRPF40B and its amino- and carboxyl-terminal regions were bound to glutathione–agarose beads and incubated with T7-tagged SF1 partially purified from HEK293T. GST and GST-TCERG1 carboxyl terminus (Ct) were used as negative controls, and the GST-TCERG1 amino-terminal region (Nt) was the positive control. Eluted proteins were separated by SDS-PAGE and analyzed by Western blotting (top) using anti-SF1 to assess the interactions with SF1 or silver staining (bottom) to detect the GST fusion proteins. (C) GST, GST-U2AF65, and GST-PRPF40B were used to bind recombinant SF1. The bound protein was eluted with a linear gradient of 150–500 mM NaCl. After the elution step, the samples were separated by SDS-PAGE and analyzed by Western blotting or silver staining as described above.
FIGURE 7.
FIGURE 7.
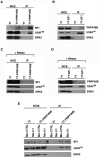
PRPF40B associates with the splicing factors SF1 and U2AF65 in vivo. (A) HEK293T cells were transiently transfected with a plasmid encoding T7-tagged PRPF40B or an empty vector as a negative control. Whole-cell extract (WCE) fractions were prepared and directly analyzed by Western blotting or subjected to immunoprecipitation (IP) with T7-specific antibodies followed by SDS-PAGE and Western blotting analysis using antibodies to detect SF1, U2AF65, and ERK2. (B) The same experimental procedures described in A were performed to overexpress T7-SF1, and immunoprecipitation was performed with PRPF40B-specific antibodies. (C,D) The same experiments described in A and B were performed in the presence of RNaseA, and (E) in the presence of control or U1 AMOs.
FIGURE 8.
FIGURE 8.
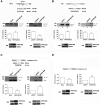
PRPF40B regulates alternative splicing. (A,B) Schematic representation of the human Bcl-x and Fas minigenes and their derived splicing variants. Exons (boxes), introns (horizontal lines), and patterns of alternative splicing events (inclined lines) are represented. HEK293T cells were cotransfected with the Bcl-x (A) or Fas (B) minigenes together with an empty vector (Mock) or a PRPF40B expression plasmid (PRPF40B-OE) for overexpression experiments. For the RNAi experiments, HEK293T cells were cotransfected with the corresponding minigene together with siPRPF40B or siEGFP as a control. The graphs show the densitometric analysis results as the exon skipping average from three independent experiments (means ± SEM). (*) P < 0.05; (***) P < 0.005. A fraction of the cell lysates was analyzed by immunoblotting with the indicated antibodies to detect the PRPF40B and ERK2 proteins. (C,D) PRPF40B regulates the alternative splicing of the endogenous Fas gene. HEK293T cells were transfected with an empty vector (Mock) or a PRPF40B-expressing plasmid (OE). For the RNAi experiments, the HEK293T cells were transfected with siPRPF40B or siEGFP as a control. After total RNA extraction, RT-PCR (C) and RT-qPCR (D) were performed using the primers indicated in the schematic representations of the Fas gene. RT-PCR primers spanned the region between exons 5 and 7, including both the anti- and the proapoptotic isoforms of the Fas gene. RT-qPCR primers amplified the proapoptotic isoform including exon 6. The bar graphs represent the ratio of exon 6 inclusion, which is shown relative to the control that was set at 1. The data are from five independent experiments (means ± SEM). (*) P < 0.05; (**) P < 0.01. A fraction of the cell lysates was analyzed by immunoblotting with the indicated antibodies to detect the PRPF40B and ERK2 proteins.
FIGURE 9.
FIGURE 9.
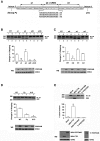
Exon 6 sequences and associated 5′ and 3′ splice sites are required for PRPF40B-mediated Fas splicing regulation. (A) Schematic representation of the structure of the Fas gene, including the genomic sequence of exon 6 in the box and the neighboring introns 5 and 6. e1, e2, and e3 represent three segments in exon 6, where e2 corresponds to the uridine-rich exonic silencer (URE6). m0, m1, and m2 represent different RNA sequences replacing the URE6 silencer. The strong Py in intron 5 indicates the substitution of a weak 3′ splice site associated with exon 6 with a strong polypyrimidine tract. The U1C in intron 6 corresponds to a mutant strengthening the 5′ splice site by improving its base-pairing potential with U1 snRNA. (BD) Analyses of the effects of Fas splice site selection in response to PRPF40B overexpression. HEK293T cells were cotransfected together with the corresponding Fas minigene and a plasmid expressing PRPF40B. RT-PCR was performed to analyze the alternatively spliced forms of the Fas minigenes. The graphs show the densitometric analysis results as the change in exon skipping average from three independent experiments (means ± SEM). (*) P < 0.05; (**) P < 0.01. Cell lysates were analyzed by immunoblotting with the indicated antibodies to detect the PRPF40B and ERK2 proteins. (E) Effect of tethering PTB and PRPF40B to exon 6 through the RNA MS2-binding domains. The sequence of the URE6 element was replaced by two MS2 stem–loop binding sites in tandem. This minigene was cotransfected with plasmids expressing the indicated proteins or empty vector. RT-PCR was performed to assess the alternatively spliced isoforms of Fas. The bar graph shows the densitometric analysis results as the exon skipping average from three independent experiments (means ± SEM). (**) P < 0.01. A fraction of the cell lysates was analyzed by immunoblotting to detect the indicated proteins.
FIGURE 10.
FIGURE 10.
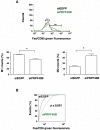
Analysis of the number of Fas receptors on the plasma membrane of control and PRPF40B-depleted cells by flow cytometry. (A) The top panel shows the flow cytometry-generated frequency histogram of Fas/CD95-associated fluorescence in control (siEGFP, black) and siPRPF40B (green) cells. The results shown are representative of three repeat experiments. The bottom panels show the quantification analysis of the Fas/CD95-specific fluorescence in the M1 (left) and M2 (right) populations. The graphs show the data from three independent experiments (means ± SEM). (*) P < 0.05. (B) The graph represents Kolmogorov–Smirnov statistics obtained from comparing the population distributions of the Fas/CD95-associated fluorescence in siEGFP (black) and siPRPF40B (green) cells. The P value was ≤0.001, which indicates that the two groups were sampled from populations with different distributions.
FIGURE 11.
FIGURE 11.
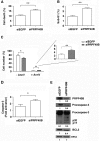
Effect of PRPF40B depletion on apoptosis. HEK293T cells were transiently transfected with siEGFP (control) or siPRPF40B. (A) Flow cytometry analysis of HEK293T cells stained with PI for 30 min at 37°C. The bar graphs show the data from three independent experiments (means ± SEM). (**) P < 0.01. (B) PRPF40B depletion increases the percentage of the sub-G1 cell population. The cells were fixed prior to RNase treatment and PI staining. The cell cycle phases were determined by flow cytometry. The graph shows the percentage of cells in the sub-G1 phase of the cell cycle. The data are from three independent experiments (means ± SEM). (**) P < 0.01. (C) PRPF40B knockdown increases annexin-V binding. Control and PRPF40B-knockdown HEK293T cells were incubated without or with annexin-V and analyzed by flow cytometry. The bar graphs show the percentage of cells from three independent experiments (means ± SEM). (*) P < 0.05; (**) P < 0.01. (D) Analysis of caspase-3 activation in PRPF40B-depleted cells. Activation of caspase-3 was significantly increased in PRPF40B-knockdown HEK293T cells. Caspase-3 activation was measured by chemiluminescence in control and PRPF40B-depleted cells. The bar graph shows the fold activation from three independent experiments (means ± SEM). (*) P < 0.05. (E) Analysis of PRPF40B, procaspase-3 cleavage (precursor p35 and cleaved fragments p20/p17), and BCL2 levels. Protein expression was analyzed by immunoblotting using specific antibodies in protein extracts obtained from control and PRPF40-depleted cells. ERK2 was used as a loading control. The p20 + p17/procaspase-3 ratio was calculated to determine the values of the caspase isoforms. The quantification of the bands is shown below each panel.

Similar articles

Cited by

References

    1. Abdel-Wahab O, Levine R 2011. The spliceosome as an indicted conspirator in myeloid malignancies. Cancer Cell 20: 420–423. - PMC - PubMed
    1. Abovich N, Rosbash M 1997. Cross-intron bridging interactions in the yeast commitment complex are conserved in mammals. Cell 89: 403–412. - PubMed
    1. Berg MG, Singh LN, Younis I, Liu Q, Pinto AM, Kaida D, Zhang Z, Cho S, Sherrill-Mix S, Wan L, et al.2012. U1 snRNP determines mRNA length and regulates isoform expression. Cell 150: 53–64. - PMC - PubMed
    1. Berglund JA, Abovich N, Rosbash M 1998. A cooperative interaction between U2AF65 and mBBP/SF1 facilitates branchpoint region recognition. Genes Dev 12: 858–867. - PMC - PubMed
    1. Boise LH, González-García M, Postema CE, Ding L, Lindsten T, Turka LA, Mao X, Nuñez G, Thompson CB 1993. bcl-x, a bcl-2-related gene that functions as a dominant regulator of apoptotic cell death. Cell 74: 597–608. - PubMed

Publication types