

A general method to improve fluorophores for live-cell and single-molecule microscopy
- PMID: 25599551
- PMCID: PMC4344395
- DOI: 10.1038/nmeth.3256
A general method to improve fluorophores for live-cell and single-molecule microscopy
Abstract
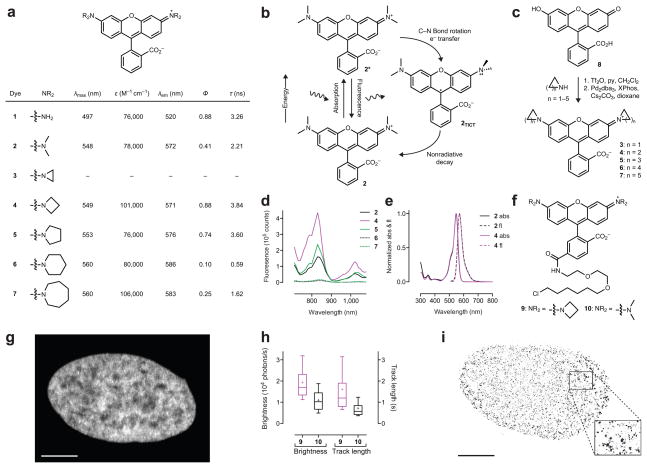
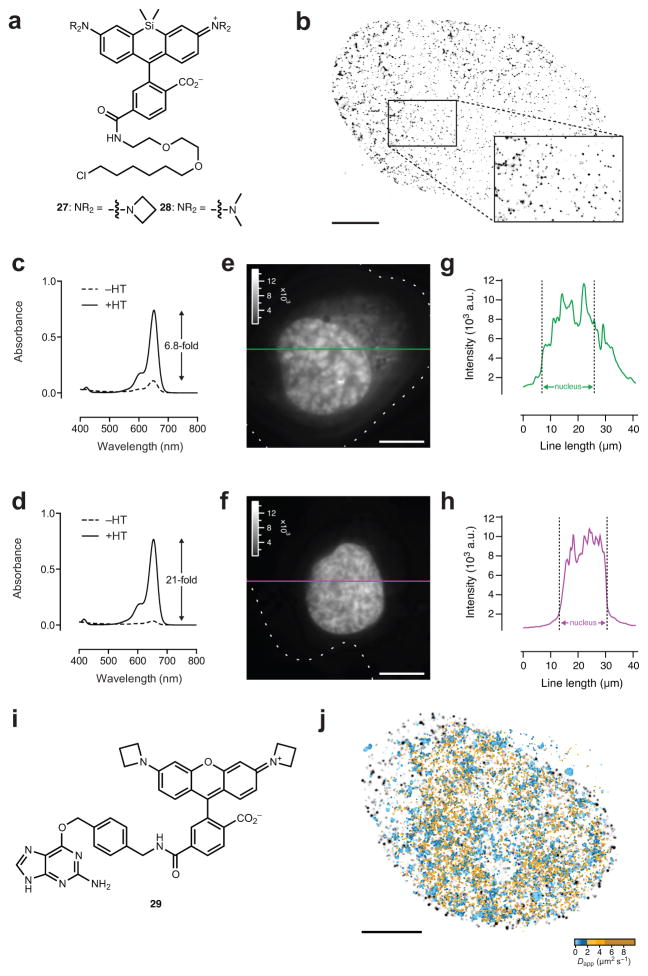
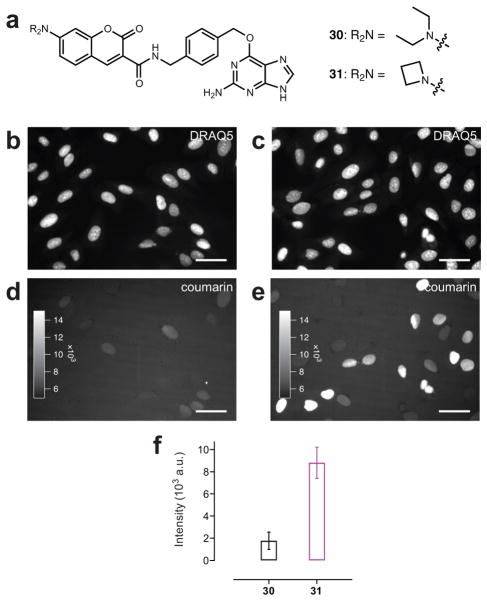
Specific labeling of biomolecules with bright fluorophores is the keystone of fluorescence microscopy. Genetically encoded self-labeling tag proteins can be coupled to synthetic dyes inside living cells, resulting in brighter reporters than fluorescent proteins. Intracellular labeling using these techniques requires cell-permeable fluorescent ligands, however, limiting utility to a small number of classic fluorophores. Here we describe a simple structural modification that improves the brightness and photostability of dyes while preserving spectral properties and cell permeability. Inspired by molecular modeling, we replaced the N,N-dimethylamino substituents in tetramethylrhodamine with four-membered azetidine rings. This addition of two carbon atoms doubles the quantum efficiency and improves the photon yield of the dye in applications ranging from in vitro single-molecule measurements to super-resolution imaging. The novel substitution is generalizable, yielding a palette of chemical dyes with improved quantum efficiencies that spans the UV and visible range.
Conflict of interest statement
The authors declare competing interests: patent applications have been filed whose value may be affected by this publication.
Figures
Comment in
-
Cation-π Lights Up "Halo".Biochemistry. 2017 Oct 10;56(40):5221-5222. doi: 10.1021/acs.biochem.7b00702. Epub 2017 Sep 20. Biochemistry. 2017. PMID: 28930442 Free PMC article.
Similar articles
-
Synthesis of Janelia Fluor HaloTag and SNAP-Tag Ligands and Their Use in Cellular Imaging Experiments.Methods Mol Biol. 2017;1663:179-188. doi: 10.1007/978-1-4939-7265-4_15. Methods Mol Biol. 2017. PMID: 28924668
-
Bright photoactivatable fluorophores for single-molecule imaging.Nat Methods. 2016 Dec;13(12):985-988. doi: 10.1038/nmeth.4034. Epub 2016 Oct 24. Nat Methods. 2016. PMID: 27776112
-
High Photostability in Nonconventional Coumarins with Far-Red/NIR Emission through Azetidinyl Substitution.J Org Chem. 2018 Oct 5;83(19):11519-11531. doi: 10.1021/acs.joc.8b01422. Epub 2018 Sep 13. J Org Chem. 2018. PMID: 30168330
-
Live-cell super-resolution imaging with synthetic fluorophores.Annu Rev Phys Chem. 2012;63:519-40. doi: 10.1146/annurev-physchem-032811-112012. Epub 2012 Jan 30. Annu Rev Phys Chem. 2012. PMID: 22404589 Review.
-
Photostable and photoswitching fluorescent dyes for super-resolution imaging.J Biol Inorg Chem. 2017 Jul;22(5):639-652. doi: 10.1007/s00775-016-1435-y. Epub 2017 Jan 12. J Biol Inorg Chem. 2017. PMID: 28083655 Review.
Cited by
-
Organic J-Aggregate Nanodots with Enhanced Light Absorption and Near-Unity Fluorescence Quantum Yield.Nano Lett. 2021 Apr 14;21(7):2840-2847. doi: 10.1021/acs.nanolett.0c04928. Epub 2021 Mar 30. Nano Lett. 2021. PMID: 33784810 Free PMC article.
-
Poly-GR repeats associated with ALS/FTD gene C9ORF72 impair translation elongation and induce a ribotoxic stress response in neurons.Sci Signal. 2024 Aug 6;17(848):eadl1030. doi: 10.1126/scisignal.adl1030. Epub 2024 Aug 6. Sci Signal. 2024. PMID: 39106320 Free PMC article.
-
Rational Design of Bioavailable Photosensitizers for Manipulation and Imaging of Biological Systems.Cell Chem Biol. 2020 Aug 20;27(8):1063-1072.e7. doi: 10.1016/j.chembiol.2020.07.001. Epub 2020 Jul 21. Cell Chem Biol. 2020. PMID: 32698018 Free PMC article.
-
Experimentally Calibrated Computational Prediction Enables Accurate Fine-Tuning of Near-Infrared Rhodamines for Multiplexing.Chemistry. 2023 Feb 1;29(7):e202202861. doi: 10.1002/chem.202202861. Epub 2022 Dec 12. Chemistry. 2023. PMID: 36282517 Free PMC article.
-
How Transcription Factor Clusters Shape the Transcriptional Landscape.Biomolecules. 2024 Jul 20;14(7):875. doi: 10.3390/biom14070875. Biomolecules. 2024. PMID: 39062589 Free PMC article. Review.
References
-
- Xia T, Li N, Fang X. Single-molecule fluorescence imaging in living cells. Ann Review Phys Chem. 2013;64:459–480. - PubMed
-
- Griffin BA, Adams SR, Tsien RY. Specific covalent labeling of recombinant protein molecules inside live cells. Science. 1998;281:269–272. - PubMed
-
- Keppler A, et al. A general method for the covalent labeling of fusion proteins with small molecules in vivo. Nat Biotechnol. 2002;21:86–89. - PubMed
-
- Los GV, et al. HaloTag: A novel protein labeling technology for cell imaging and protein analysis. ACS Chem Biol. 2008;3:373–382. - PubMed
Publication types
MeSH terms
Substances
Grants and funding
LinkOut - more resources
Full Text Sources
Other Literature Sources
