. 2015 Aug;22(8):1341-52.
doi: 10.1038/cdd.2014.228. Epub 2015 Jan 16.

LAMC2 enhances the metastatic potential of lung adenocarcinoma

Affiliations

LAMC2 enhances the metastatic potential of lung adenocarcinoma

Y W Moon et al. Cell Death Differ. 2015 Aug.

Abstract

Lung cancer is the number one cancer killer, and metastasis is the main cause of high mortality in lung cancer patients. However, mechanisms underlying the development of lung cancer metastasis remain unknown. Using genome-wide transcriptional analysis in an experimental metastasis model, we identified laminin γ2 (LAMC2), an epithelial basement membrane protein, to be significantly upregulated in lung adenocarcinoma metastatic cells. Elevated LAMC2 increased traction force, migration, and invasion of lung adenocarcinoma cells accompanied by the induction of epithelial-mesenchymal transition (EMT). LAMC2 knockdown decreased traction force, migration, and invasion accompanied by EMT reduction in vitro, and attenuated metastasis in mice. LAMC2 promoted migration and invasion via EMT that was integrin β1- and ZEB1-dependent. High LAMC2 was significantly correlated with the mesenchymal marker vimentin expression in lung adenocarcinomas, and with higher risk of recurrence or death in patients with lung adenocarcinoma. We suggest that LAMC2 promotes metastasis in lung adenocarcinoma via EMT and may be a potential therapeutic target.


Figures
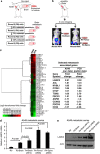
Figure 1
Figure 1
Identification of LAMC2 as a putative metastasis marker of NSCLC. (a) A schematic illustration of the in vivo mouse metastasis model with repeated intracardiac injections of A549 cells. Outgrowth of A549 cells from the cultured brain tissue indicated that injected A549 cells metastasized to the brain. A549R1, A549R2, and A549R3 cells were serially established by performing intracardiac injection of A549R0 (5 × 10⁵ cells), A549R1 (2.5 × 10⁵ cells), and A549R2 (2.5 × 10⁵ cells), respectively. For each round, 10 mice were injected. (b) Bioluminescent images after intracardiac injection of luciferase-transfected A549R3-Brain cells, demonstrating non-brain tropism. A549R4-Brain, -Femur, and -Spine cells were established after culturing metastatic cells derived from the corresponding organ metastases after injection of A549R3 cells. (c) Expression profiles of A549 (our data) and PC9 metastatic cells (public data, GSE14107), which were independently derived using the intracardiac injection mouse metastasis model, revealed 48 differentially expressed genes between R0 and R3 that were common in both systems, with criteria of false discovery rate <1.0 and log 2 fold change >1.5 or <−1.5. Differentially expressed genes were further narrowed down to 11 based on the unidirectional log 2 fold change across R1, R2, and R3, and including only genes reported to have cancer-associated function. (d) Real-time qRT-PCR analysis of LAMC2 in A549R0, A549R3, and A549R4 cells. Student's t-test was performed to compare A549R0 versus A549R3 and A549R3 versus A549R4. Data are presented as mean±S.E.M. of triplicate experiments. (e) Immunoblot analysis of LAMC2 in A549R0, A549R3, and A549R4 cells
Figure 2
Figure 2
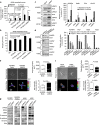
LAMC2 promotes migration, invasion, and traction of lung ADC cells concomitantly with EMT induction. (a) Migration and invasion analysis of A549R0, A549R3, and A549R4 cells. Student's t-test was performed to compare A549R0 versus R3 and R3 versus R4. Data are mean±S.E.M. of triplicate experiments. (b) Doubling times of A549R0, R3, and R4 cells. P-values were calculated by paired t-test. Data are mean±S.E.M. of triplicate experiments. (c) Immunoblot analysis of LAMC2 and migration and invasion assays in LAMC2-transfected cells. Triplicates of migration and invasion assays were performed for each cell line. P-values were calculated by paired t-test between Mock and LAMC2 across four cell lines. (d) Immunoblot analysis of LAMC2 and migration and invasion assays in LAMC2-knockdown cells. Triplicates of migration and invasion assays were performed for each cell line. P-values were calculated across four cell lines by paired t-test between shMock- and shLAMC2 no.1-transfected cells or shMock- and shLAMC2 no. 2-transfected cells. (e and f) Representative images of phase-contrast and traction maps (left panels), projected cell area (right upper panels), and net contractile moments (right lower panels) in (e) A549R0-LAMC2 and Mock cells, and (f) H358-shLAMC2 and shMock cells. In traction maps, the white lines show the cell boundary, colors show the magnitude of the tractions in Pascal (Pa), and arrows show the direction and relative magnitude of the tractions. Scale bars: 50 μm. Student's t-test was used to compare groups; n is the the number of cells analyzed. Data are presented as mean±S.E.M. (g) Immunoblot of EMT-related proteins in LAMC2-transfected and -knockdown cells
Figure 3
Figure 3
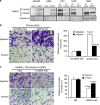
Conditioned medium containing secreted LAMC2 enhances cell migration and invasion, which can be blocked by LAMC2-blocking antibody. (a) Immunoblot analysis using the concentrated conditioned medium from LAMC2-transfected and -knockdown cells identified secreted unprocessed (140 kDa) and processed (100 kDa) LAMC2. Ponceau-S staining of the membrane is shown as protein loading controls of the conditioned medium. (b) Migration and invasion assay upon addition of conditioned medium from shLAMC2- and shMock-transfected cells to PC9-shLAMC2. Student's t-test was performed. Data are presented as mean±S.E.M. of triplicate experiments. (c) Migration and invasion assay upon addition of mixture of LAMC2-blocking antibody and LAMC2-containing conditioned medium from A549R0-LAMC2 cells, to A549R0-Mock cells. mAb was the blocking monoclonal antibody and immunoglobulin G (IgG) was used as the control. Student's t-test was performed. Data are presented as mean±S.E.M. of triplicate experiments
Figure 4
Figure 4
LAMC2 knockdown reduces metastatic capacity in a mouse metastasis model. (a) Representative images of serial noninvasive bioluminescence monitoring after intracardiac injection of the same number (1 × 10⁵ cells) of luciferase-transfected A549R4-shLAMC2 and shMock cells. Mice were imaged dorsally for 3 min and then ventrally for another 3 min. (b) Average number of metastases per mouse counted at different time points after intracardiac injection (upper panel) and comparison by Student's t-test at the last follow-up of 42 days (lower panel). Serial bioluminescent imaging was performed weekly for 4 weeks and then biweekly for the next 2 weeks. Metastasis was defined as the presence of bioluminescent signals at the same anatomic locations on three consecutive images. *P<0.05; n=9 mice for A549R4-shLAMC2 group and n=10 mice for shMock group. Data are presented as mean±S.E.M.
Figure 5
Figure 5
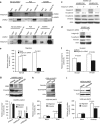
LAMC2 promotes migration and invasion via integrin β1- and/or ZEB1-dependent EMT. (a and b) Co-immunoprecipitation of LAMC2 and integrin β1 in H2122-LAMC2, PC9, and A549R4 cells. Cell lysates were immunoprecipitated with anti-LAMC2 (a) or -integrin β1 antibodies (b). immunoglobulin G (IgG) was used as a negative control. The cell lysates and immunoprecipitates were analyzed by immunoblotting with the indicated antibodies. (c) A549R0 cells were pretreated with or without 25 nM integrin β1 siRNA for 48 h. The cells were then incubated with A549R0 conditioned media (R0-CM) or A549R4 conditioned media (R4-CM) for 24 h. Levels of integrin β1, N-cadherin, E-cadherin, and vimentin were detected by immunoblot analysis. (d) Western blot analyses of integrin β1, N-cadherin, and vimentin in A549R4 cells treated with or without 25 nM integrin β1 siRNA for 48 h. Actin was used as the loading control. (e and f) Cell migration (e) and invasion (f) assays of A549R0 cells. A549R0 cells were pretreated with or without 25 nM integrin β1 siRNA for 48 h, followed by incubation with the indicated conditioned media for 24 h. Cells were then collected for migration and invasion assays. Data are presented as mean±S.E.M. of triplicate experiments. Knockdown of integrin β1 significantly inhibits LAMC2-mediated migration (P<0.001) and invasion (P=0.004). (g) Knockdown of ZEB1 decreases migration and invasion of A549R0-LAMC2 cells. Student's t-test was performed to compare shMock cells and shZEB1 cells. Data are presented as mean±S.E.M. of triplicate experiments. (h) Ectopic expression of Snail restores migration and invasion in H358-shLAMC2 cells. Student's t-test was performed to compare Mock- and Snail-transfected cells. Data are presented as mean±S.E.M. of triplicate experiments. (i) Ectopic expression of vimentin restores migration and invasion in H358-shLAMC2 cells. Student's t-test was performed to compare Mock- and vimentin-transfected cells. Data are presented as mean±S.E.M. of triplicate experiments
Figure 6
Figure 6
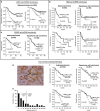
High expression of LAMC2 predicts poor prognosis in human lung ADC. (ac) Kaplan–Meier survival curves according to relative LAMC2 mRNA expression from public mRNA microarray data sets: (a) JNCC (GSE31210), (b) SMC (GSE8894), and (c) DUMC (GSE3141). All patients included in these analyses were curatively resected for NSCLC and never received preoperative therapies. An optimal cutoff point for normalized intensity of LAMC2 mRNA was determined using minimum P-value approach in predicting recurrence-free or overall survival. Survival comparisons and P-values were determined by log-rank test. (df) Analysis of LAMC2 IHC on tissue microarray from patients with completely resected stage I NSCLC from YCC. (d) Pattern of strong LAMC2 staining at the epithelial–stromal interface (stars) of tumor nests, but no staining in the center of tumor nest (encircled in yellow). (e) Positivity for LAMC2 was assessed from 0 to 100% of stained cells by cytoplasmic or extracellular staining with any intensity. The cutoff of 30% was used for LAMC2 positivity as in previous reports using the same antibody. (f) Kaplan–Meier survival curves according to LAMC2 staining intensity. Survival comparisons and P-values were calculated by log-rank test

Similar articles

Cited by

References

    1. Siegel R, Naishadham D, Jemal A. Cancer statistics, 2013. Cancer J Clin. 2013;63:11–30. - PubMed
    1. Herbst RS, Heymach JV, Lippman SM. Lung cancer. N Engl J Med. 2008;359:1367–1380. - PMC - PubMed
    1. Valastyan S, Weinberg RA. Tumor metastasis: molecular insights and evolving paradigms. Cell. 2011;147:275–292. - PMC - PubMed
    1. Colognato H, Yurchenco PD. Form and function: the laminin family of heterotrimers. Dev Dyn. 2000;218:213–234. - PubMed
    1. Moriya Y, Niki T, Yamada T, Matsuno Y, Kondo H, Hirohashi S. Increased expression of laminin-5 and its prognostic significance in lung adenocarcinomas of small size. An immunohistochemical analysis of 102 cases. Cancer. 2001;91:1129–1141. - PubMed

Publication types