. 2015 Aug;22(8):1287-99.
doi: 10.1038/cdd.2014.214. Epub 2015 Jan 9.

p73 is required for endothelial cell differentiation, migration and the formation of vascular networks regulating VEGF and TGFβ signaling

Affiliations

p73 is required for endothelial cell differentiation, migration and the formation of vascular networks regulating VEGF and TGFβ signaling

R Fernandez-Alonso et al. Cell Death Differ. 2015 Aug.

Abstract

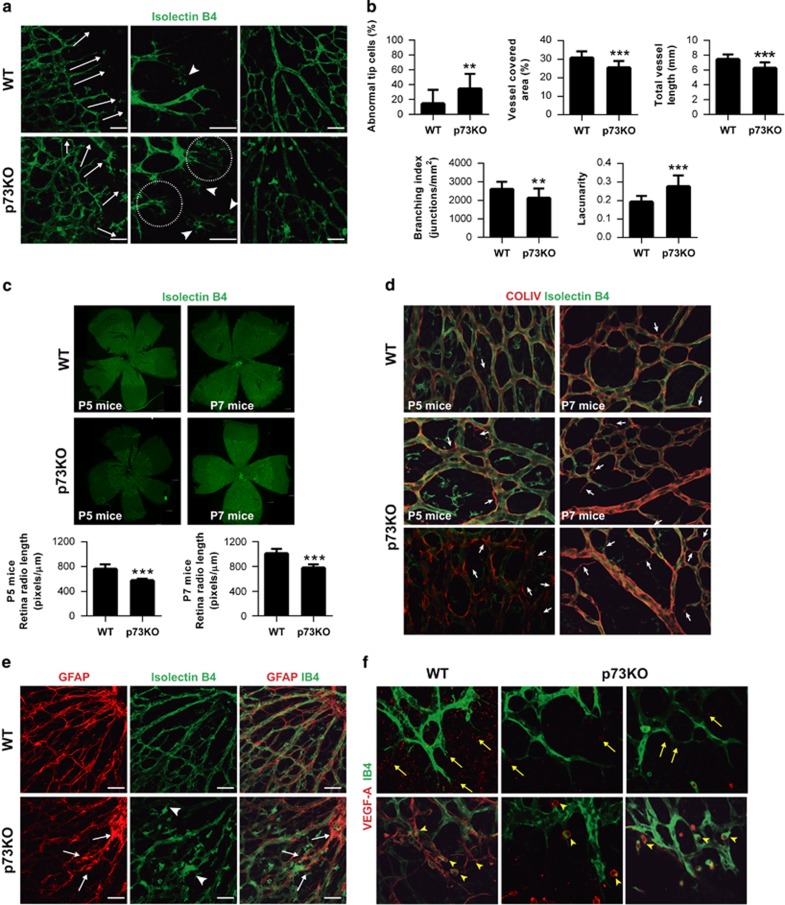
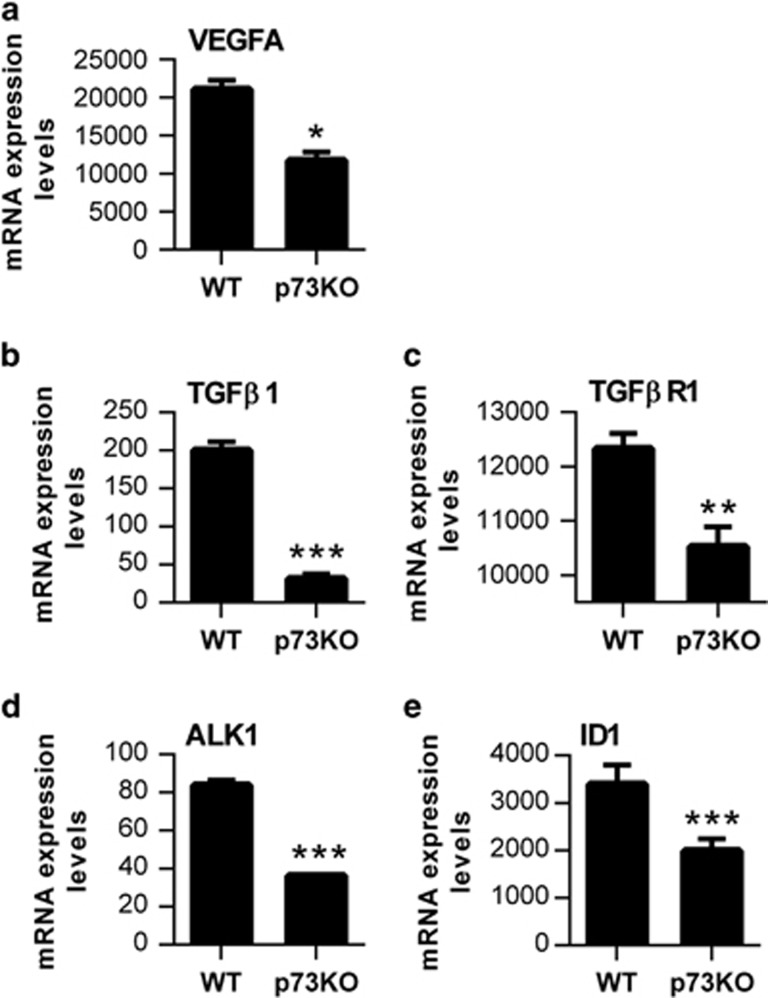
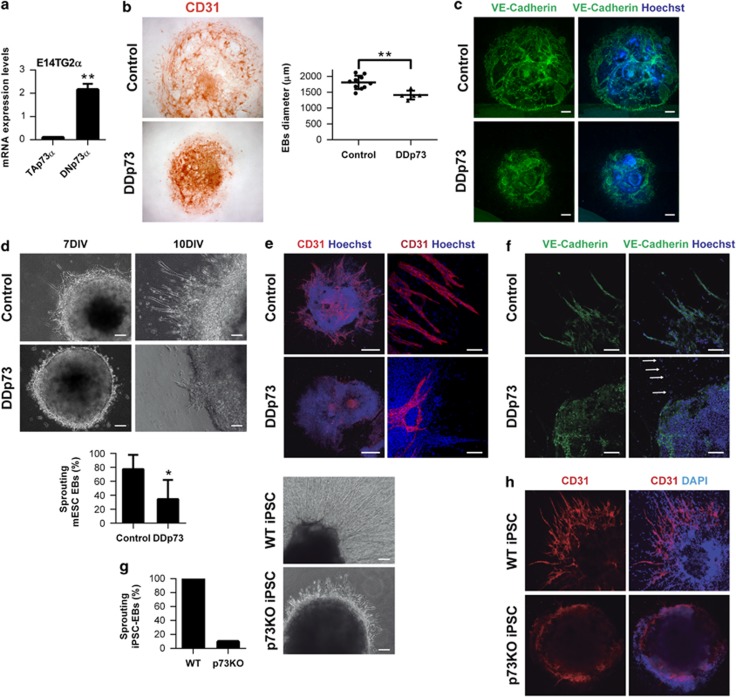
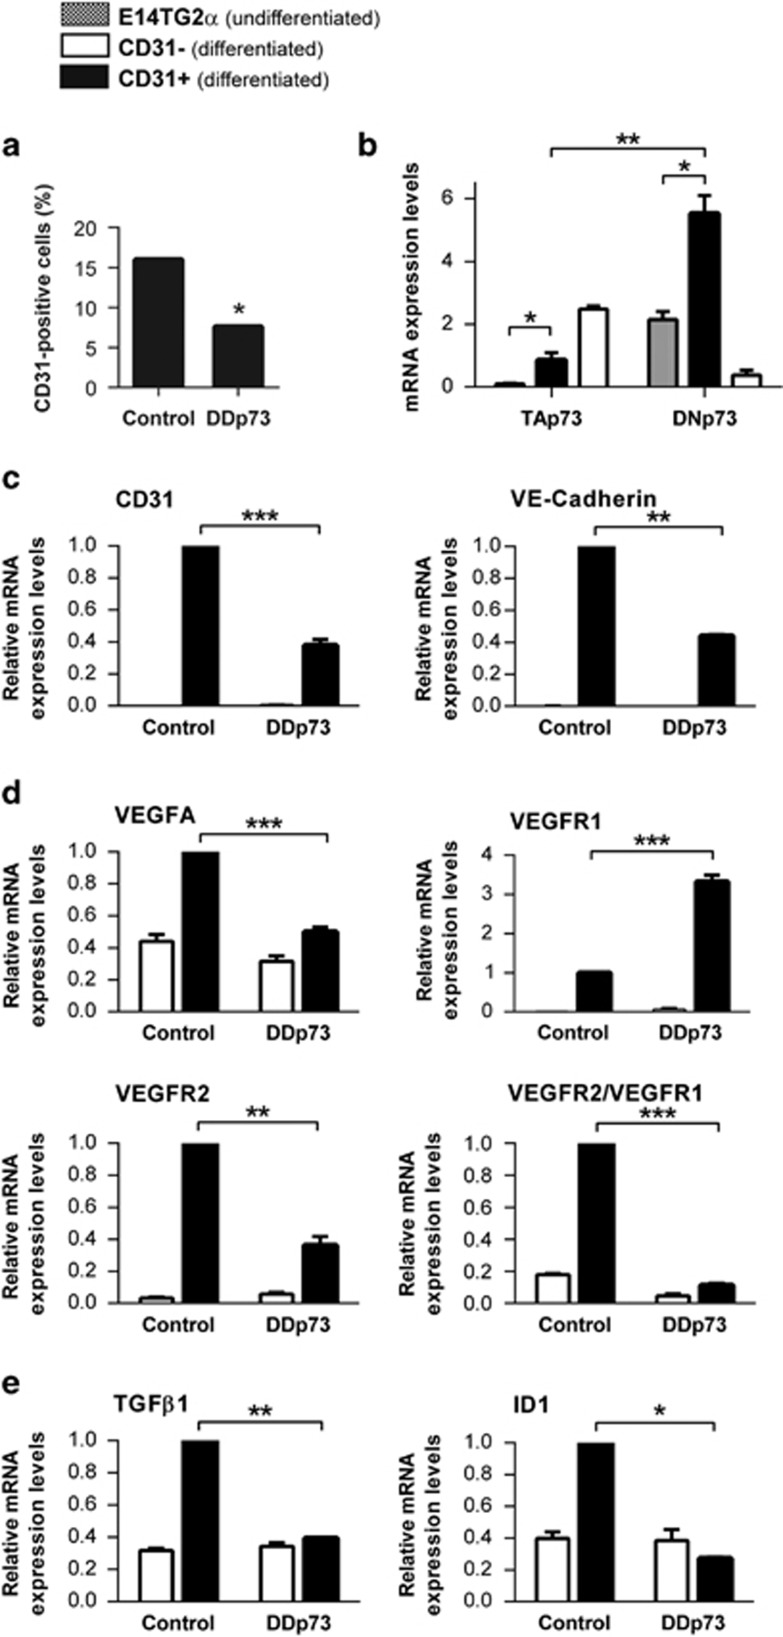
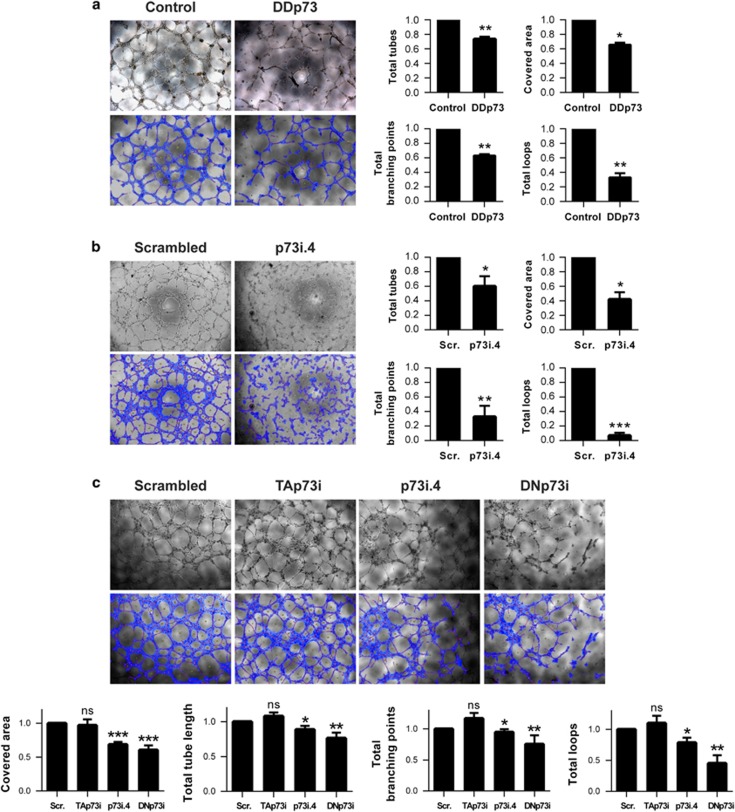
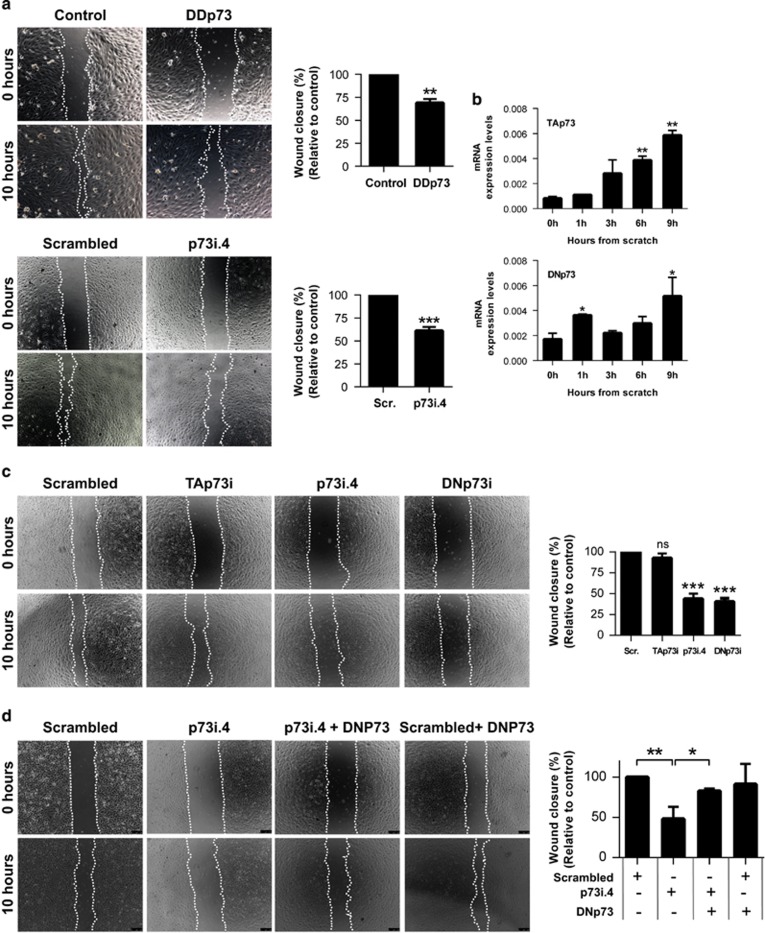
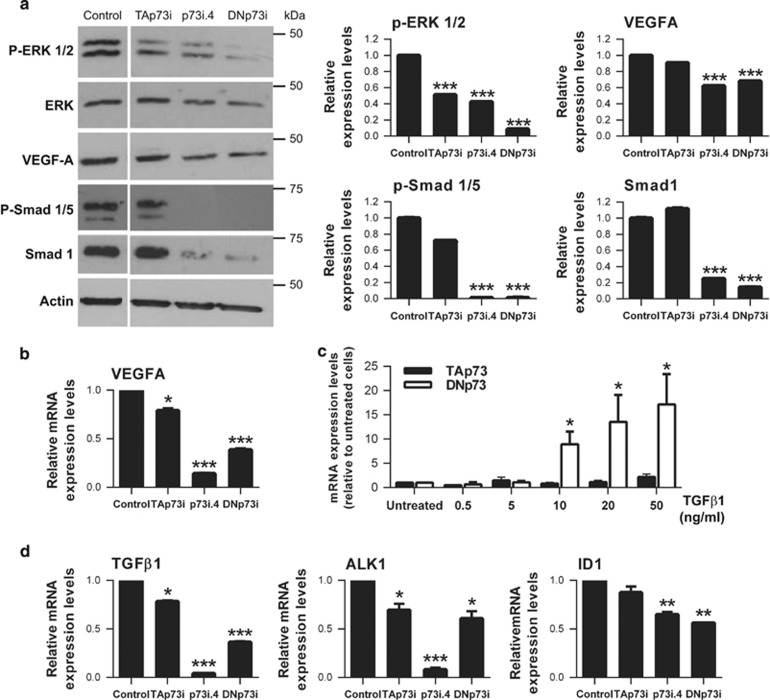
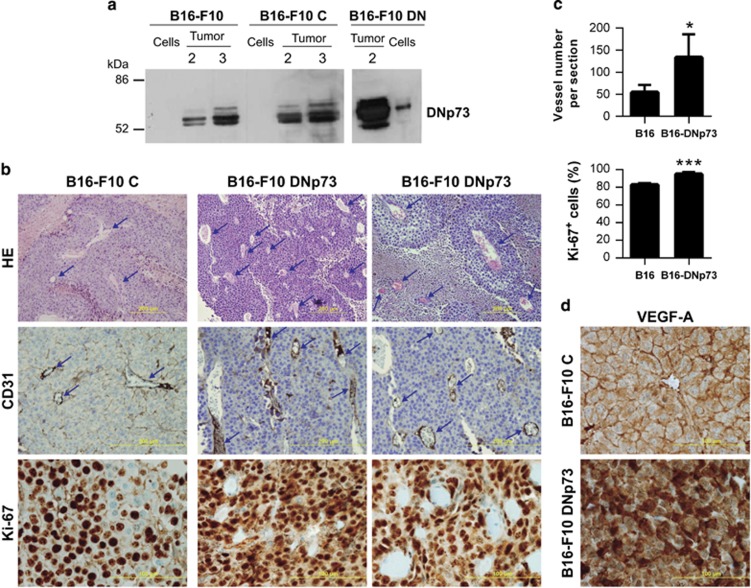
Vasculogenesis, the establishment of the vascular plexus and angiogenesis, branching of new vessels from the preexisting vasculature, involves coordinated endothelial differentiation, proliferation and migration. Disturbances in these coordinated processes may accompany diseases such as cancer. We hypothesized that the p53 family member p73, which regulates cell differentiation in several contexts, may be important in vascular development. We demonstrate that p73 deficiency perturbed vascular development in the mouse retina, decreasing vascular branching, density and stability. Furthermore, p73 deficiency could affect non endothelial cells (ECs) resulting in reduced in vivo proangiogenic milieu. Moreover, p73 functional inhibition, as well as p73 deficiency, hindered vessel sprouting, tubulogenesis and the assembly of vascular structures in mouse embryonic stem cell and induced pluripotent stem cell cultures. Therefore, p73 is necessary for EC biology and vasculogenesis and, in particular, that DNp73 regulates EC migration and tube formation capacity by regulation of expression of pro-angiogenic factors such as transforming growth factor-β and vascular endothelial growth factors. DNp73 expression is upregulated in the tumor environment, resulting in enhanced angiogenic potential of B16-F10 melanoma cells. Our results demonstrate, by the first time, that differential p73-isoform regulation is necessary for physiological vasculogenesis and angiogenesis and DNp73 overexpression becomes a positive advantage for tumor progression due to its pro-angiogenic capacity.


Figures

Figure 1
Figure 1
Absence of p73 perturbs development of the retinal vasculature. (a) Retinas from P5 WT and p73KO mice were stained with isolectin B4 (IB4) to analyze the morphology and orientation (white arrows, left panels) of filopodia at the leading edge of vascularization. Higher-magnification images for each genotype (medium panels) show abundant and disorientated filopodia (circles) and tissue macrophages (arrow heads) in p73KO retinas. Scale bars=50 μm. Right panels illustrate perturbed vascular branching and decreased vascular density in p73KO central retinal plexus compared with WT. (b) Quantification of vessel coverage (percentage of area covered by IB4+ endothelial cells), total vessel length, vascular branching index (branch points/unit area) and lacunarity (distribution of the gap sizes surrounding the object). Representative images were analyzed independently using the AngioTool software (https://ccrod.cancer.gov/confluence/display/ROB2/Home). (c) IB4 retinal flat-mount staining of P5 and P7 retinas. Radio was measured from the optic nerve to the sprouting zone. The spreading of the vasculature toward the periphery is highly significantly reduced in p73KO retinas. (d) Visualization of empty matrix sleeves by IB4 (green) and collagen IV (red) staining, with increased presence of collagen IV sleeve segments lacking endothelial cells (IB4-negative; white arrows) in p73KO retinas. (e) GFAP/IB4 double staining to visualize astrocytes (red) and vasculature (green), respectively. p73KO retinas display a disorganized astrocyte network underlying a chaotic vasculature; tufts are indicated by arrow heads. (f) VEGF-A immunostaining (red) in P5 retinas. Note that VEGF-A expression is markedly decreased in the absence of p73. Yellow arrow heads indicate IB4+/VEGF-A+ microglial cells commonly found at sites of prospective sprout anastomosis. All statistical analysis were performed with data from at least five animals. Bar graphs represent mean±S.D. Equal-variance Student's t-test was performed to evaluate statistical differences. **P<0.01; ***P<0.001
Figure 2
Figure 2
Lack of p73 affects TGF-β signaling in vivo. Quantification of VEGF-A expression and analysis of the TGF/ALK1/ID1 signaling pathway in P5 retinas from WT and p73KO mice. qRT-PCR analysis demonstrated a significant decrease in VEGF-A expression (a), TGF-β 1 expression (b), TGF-βR1 expression (c), ALK1 expression (d) and ID1 expression levels (e) in the absence of p73. Analysis was performed with data from three independent experiments. Mean±S.D. are represented; equal-variance Student's t-test was performed to evaluate statistical differences. *P<0.05, **P<0.01, ***P<0.001
Figure 3
Figure 3
Lack of p73 impairs the formation of vascular structures and endothelial sprouting of mESC and iPSC in the EB endothelial differentiation model. (a) Quantitative analysis of p73 isoform expression (TA and DN) by qRT-PCR in proliferating E14TG2a mESC. Ct-TAp73 : 38.22 and ΔCt-TAp73: 0.099; Ct-DNp73: 33.78 and ΔCt-DNp73: 2.15 (bc) EBs size, morphology and formation of vascular structures in WT and DDp73 mESC EBs under 2D differentiation culture conditions. (b) EBs were stained for CD31 expression and EB average diameter for individual EBs (n≥10) was calculated after 7 days in vitro (7 DIV). (c) VE-cadherin immunostaining (green) shows that DDp73-EBs did not assemble into vascular networks. (df) Angiogenic sprouting in WT and DDp73 mESC EBs under 3D differentiation conditions. (d) Phase contrast images correspond to 7 DIV and 10 DIV EBs. Graph shows percentage of sprouting EBs at day 18. (e) CD31 expression (red) and (f) VE-cadherin expression (green) demonstrate that DDp73 mESC EBs failed to form a branched vascular network. Scale bars=500 μm (e, left panel), 100 μm (e, right panel) and 250 μm (f). (g,h) Angiogenic sprouting in WT and p73KO iPSC-EBs under 3D differentiation conditions. (g) Phase contrast images of 12 DIV iPSC-EBs illustrate sprouts in WT EBs, but not in the p73KO-iPSC-EBs. Graph represents percentage of sprouting EBs at day 18. (h) CD31 expression (red) highlighted that p73-deficient iPSC cannot form vascular structures. Data represent mean values±S.D.; equal-variance Student's t-test was performed to evaluate statistical differences. *P<0.05, **P<0.01
Figure 4
Figure 4
p73 functional inhibition hinders mESC endothelial differentiation, decreases endothelial marker expression and blunts the pro-angiogenic state of the obtained endothelial cells. (a) CD31 positive cells were isolated with magnetic beads and the obtained cell number was quantified. (b) qRT-PCR analysis of p73 isoform expression in proliferating undifferentiated E14Tg2a (square bars), differentiated non-endothelial CD31 negative cells (CD31, white bars) and differentiated CD31 positive endothelial cells (CD31+, black bars) demonstrated that TA and DNp73 are differentially regulated during mESC endothelial differentiation. (ce) Quantitative qRT-PCR analysis of endothelial cell marker expression (c), VEGF signaling (d) and TGF/ID1 signaling (e), in CD31 (white bars) and CD31+ cells (black bars) isolated from either control or p73DD-EBs. Bars represent mean values±S.D.; experiments were repeated twice; equal-variance Student's t-test was performed to evaluate statistical differences. *P<0.05, **P<0.01, ***P<0.001
Figure 5
Figure 5
p73 function, and DNp73 in particular, is required for tube morphogenesis in HUVEC. Tube formation assays on Matrigel in HUVEC upon (a) p73 functional inhibition – DDp73, (b) knockdown of total p73 – p73i.4 or (c) specific knockdown of TA or DNp73 isoforms – Tap73i and DNp73i, respectively. Tube formation was monitored microscopically and images were analyzed using WimTube software (Wimasis GmbH). Covered area, total tubes, total tube length, total branching points and total number of loops are shown as representative parameters. Experimental data were normalized to the control (a) or to the scrambled (Scr.; b,c). Data represent mean values±S.D.; n≥3, experiments were repeated at least three times; equal-variance Student's t-test was performed to evaluate statistical differences: *P<0.05, **P<0.01, ***P<0.001
Figure 6
Figure 6
p73, and DNp73 in particular, acts as a positive regulator of HUVEC migration. Wound healing assays upon (a) p73 functional inhibition (DDp73, upper panel) and total p73 knockdown (p73i.4, lower panel) or (c) specific knockdown of TA or DNp73 (TAp73i and DNp73i, respectively). Endothelial cell migration into the ‘wound' denuded area was monitored microscopically and the percentage of wound closure after 10 h was calculated relative to the control. (b) Expression kinetics of p73 isoforms during wound-healing assays were analyzed by qRT-PCR. (d) HUVEC were cotransfected with p73i4 siRNA (silencing of total p73) or scrambled oligos (Scr.) together with a DNp73 expressing plasmid, and a wound healing assay was performed. Data represent mean values±S.D.; n=3; experiments were repeated at least three times; equal-variance Student's t-test was performed to evaluate statistical differences. *P<0.05, **P<0.01, ***P<0.001
Figure 7
Figure 7
Total p73 and specific DNp73 knockdown in HUVEC led to a decrease in the downstream angiogenic signaling. The indicated knockdown experiment was performed in HUVEC (p73i.4: total p73 knockdown; TAp73i: TAp73 specific knockdown; DNp73i: DNp73 specific knockdown). (a) Expression of P-ERK1/2, ERK, VEGF-A, P-Smad1/5 and Smad1 were analyzed by western blot and protein levels were quantified using Quantity One software (Bio-Rad). (b) Quantitative analysis of VEGF-A mRNA levels was done by qRT-PCR. (c, d) Quantitative analysis of TGF-β1, ALK1 and ID1 mRNA levels was done by qRT-PCR. Data represent mean values±S.D.; experiments were repeated twice; equal-variance Student's t-test was performed to evaluate statistical differences. *P<0.05, **P<0.01, ***P<0.001
Figure 8
Figure 8
Constitutive DNp73 expression in the B16-F10 mouse melanoma cell line results in enhanced tumor vascularization. (a) DNp73 expression in B16-F10 cell extracts and tumor extracts were derived from a syngenic transplantation experiment. B16-F10 parental cells, or stable clones transfected with either DNp73 (B16-F10 DN) or vector control (B16-F10 C) were injected in C57BL/6 mice and tumors were collected after the indicated week number (2 and 3). (b) Histology and immunohistochemistry analysis of paraffin-embedded tissue sections of melanomas. Haematoxylin and eosin (HE) staining, as well as CD31 staining, revealed an increase in vessel density (blue arrows) in B16-F10 DN sections. Ki-67 proliferation antigen expression is also shown. Scale bar=500 μm (HE and CD31 staining); 100 μm (Ki-67). (c) Quantification of vessel number (10 high-power fields per section; 5 sections per genotype) and Ki-67+ cells (10 high-power fields; objective x40; 1000 cells/slide) from images in b. (d) VEGF-A expression in paraffin sections from B16-F10 and B16-F10 DN melanomas

Similar articles

Cited by

References

    1. Heinke J, Patterson C, Moser M. Life is a pattern: vascular assembly within the embryo. Front Biosci (Elite Ed) 2012;4:2269–2288. - PMC - PubMed
    1. Risau W, Flamme I. Vasculogenesis. Annu Rev Cell Dev Biol. 1995;11:73–91. - PubMed
    1. Carmeliet P, Jain RK. Angiogenesis in cancer and other diseases. Nature. 2000;407:249–257. - PubMed
    1. Blagosklonny MV. Apoptosis, proliferation, differentiation: in search of the order. Semin Cancer Biol. 2003;13:97–105. - PubMed
    1. Salimath B, Marme D, Finkenzeller G. Expression of the vascular endothelial growth factor gene is inhibited by p73. Oncogene. 2000;19:3470–3476. - PubMed

Publication types

MeSH terms