. 2015 Jan 8;11(1):e1004897.
doi: 10.1371/journal.pgen.1004897. eCollection 2015 Jan.

A discrete transition zone organizes the topological and regulatory autonomy of the adjacent tfap2c and bmp7 genes

Affiliations

A discrete transition zone organizes the topological and regulatory autonomy of the adjacent tfap2c and bmp7 genes

Taro Tsujimura et al. PLoS Genet. .

Abstract

Despite the well-documented role of remote enhancers in controlling developmental gene expression, the mechanisms that allocate enhancers to genes are poorly characterized. Here, we investigate the cis-regulatory organization of the locus containing the Tfap2c and Bmp7 genes in vivo, using a series of engineered chromosomal rearrangements. While these genes lie adjacent to one another, we demonstrate that they are independently regulated by distinct sets of enhancers, which in turn define non-overlapping regulatory domains. Chromosome conformation capture experiments reveal a corresponding partition of the locus in two distinct structural entities, demarcated by a discrete transition zone. The impact of engineered chromosomal rearrangements on the topology of the locus and the resultant gene expression changes indicate that this transition zone functionally organizes the structural partition of the locus, thereby defining enhancer-target gene allocation. This partition is, however, not absolute: we show that it allows competing interactions across it that may be non-productive for the competing gene, but modulate expression of the competed one. Altogether, these data highlight the prime role of the topological organization of the genome in long-distance regulation of gene expression.


Conflict of interest statement

The authors have declared that no competing interests exist.

Figures

Figure 1
Figure 1. The Tfap2c-Bmp7 locus consists of two regulatory domains.
(A) A schematic representation of the Tfap2c-Bmp7 locus, including the position of the SBlac insertions. Gene bodies are depicted as grey boxes with darker bars representing their exons. Tfap2c and Bmp7 are blue and green, respectively. The centromeric (CEN) and telomeric (TEL) ends of the chromosome are to the left and right of the diagram, respectively. The Sleeping Beauty transposon carrying a loxP site and LacZ reporter was first targeted into the immediate downstream region of Bmp7 along with an additional loxP sequence. Integration sites obtained upon remobilisation of the transposon are indicated by black arrowheads. (B) LacZ staining patterns of the transposon lines in the heart, limb, forebrain and the jaw as well as the staining of the BA0758 gene trap line in the forebrain and jaw are shown. Limbs: E12.5 embryos; other tissues: E11.5 embryos. Note that the intensity of the LacZ staining in the lateral and medial parts of the forebrain varies among BA0758, SB-A1 and SB-A2, as indicated by the blue arrows. Additional stages and views available in S1 Fig.
Figure 2
Figure 2. Deletion alleles localise enhancers.
(A) A schematic representation of the deletions generated. The loxP sites used for CRE-mediated recombination are depicted as filled red triangles for the one carried with the transposon. Open triangles indicate both the position of the static loxP at the 3′end of Bmp7 and the position of the LacZ reporter gene in deletions produced by TAMERE. (B) LacZ staining patterns of the three deletion lines in forebrain (top) and heart (bottom) in E11.5 embryos, in comparison to SB-A1 and SB-B3(3end), respectively. The deletions led to complete loss of the both lateral and medial expression in the forebrain (blue arrows in the SB-A1 embryo). (C) Relative expression levels of the Tfap2c and Bmp7 mRNAs in the heart, lateral and medial forebrains from E11.5 embryos measured by RT-qPCR in del1 homozygous, heterozygous, and control (wt) genotypes. For each gene, expression levels were normalized with Gapdh. Expression of the wild type allele in the lateral forebrain for Tfap2c and in the medial forebrain for Bmp7, respectively, was set as 1. The error bars represent s.d. from three biological replicates. Statistical significance was assessed by a two-sided t-test. *p<0.05; **p<0.01; ***p<0.001. (D) In situ hybridization of the wild type and del1 embryos at E10.5 with the anti-sense RNA probes for Tfap2c and Bmp7. (E) Enhancer activity of FB1 on the LacZ reporter gene. 32 out of 52 transgenic embryos showed broad forebrain expression. (F) The mm75 element drives specific expression in the mouse embryos at E11.5 (from VISTA enhancer browser: http://enhancer.lbl.gov). (G). Regulatory domains along the Tfap2c-Bmp7 interval. The forebrain enhancer (FB1) and the heart enhancer (mm75) are depicted with blue and pink ovals. A light blue (resp. pink) rectangle represents the region encompassing the H3K27ac peaks present in the segment deleted in del1, in the forebrain (resp. heart) (S3 Fig.).
Figure 3
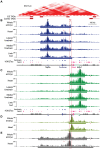
Figure 3. 4C profiles describing the conformational structure of the Tfap2c-Bmp7 locus.
(A) Hi-C heat-map of the Tfap2c-Bmp7 locus in mouse ES cells (top) and corresponding TADs identified in ES cells and adult cortex (bottom; shown by whiskered red bars) (data from Dixon et al. 2012; aligned with the other panels). (B–E) 4C-contact profiles for the different viewpoints (indicated by black triangles): promoter of Tfap2c (B) and Bmp7 (C), adjacent to the TZ (D) and within the TZ (E). Five different tissues (whole embryos, heart, lateral forebrain, medial forebrain at stage E11.5, limb buds at E12.5) were examined with the two promoter viewpoints (B, C). Only whole embryos and heart samples were used for the additional viewpoints (D, E). The estimated primary interaction domains are indicated by a bar below the corresponding 4C plots. The region of overlap of the different primary interaction domains (TZ) is outlined with a dashed red box. Stars (*) indicate two regions with low mappability accounting for the absence of signal over these positions. For comparison, a schematic representation of the region including H3K27ac peaks detected in forebrain and heart chromatin (S3 Fig.) is shown below panels B and C. Surrounding gene bodies are represented with grey boxes. The FB1 and mm75 enhancers are shown as blue and pink ovals, respectively. Associated rectangles indicate the extended enhancer regions encompassing the additional H3K27ac regions detected within the del1 segment.
Figure 4
Figure 4. Inversion alleles reallocate the target of the heart enhancer.
(A) A schematic representation of the three different inversions obtained in this study, with loxP sites as triangles, genes as plain boxes, and enhancers as ovals (FB1 or mm75) or grouped in rectangles for the ones predicted by chromatin marks (FB1/forebrain H3K27ac: blue, mm75/heart H3K27ac: pink). The TZ is represented by a whiskered red bar. In the generated inversion lines, the heart enhancer(s) were brought next to the LacZ reporter. (B) LacZ staining of the three inversion lines in E11.5 heart. Quantification by mRNA RT-qPCR of expression levels of Tfap2c (C), Bmp7 (D), Ptgis (E) and Dok5 (F) in the inversion alleles. Expression levels in wild type (wt) were normalized as 1. The error bars represent the s.d. of three biological replicates. The statistical significance was assessed by a two-sided Student's t-test. *p<0.05; **p<0.01; ***p<0.001; n.s.: non-significant.
Figure 5
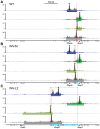
Figure 5. Redistribution of the interaction domains upon chromosomal inversions.
4C profiles were compared amongst WT control (A), INV-M (B) and INV-L2 (C) alleles for the four viewpoints indicated with black triangles. For inversion plots, the genomic coordinates were reordered to take the genomic rearrangements into account: hence, representated profiles correspond to the actual genomic structure of each allele. Representations of the data aligned on the reference (WT) genome are available in S8 and S9 Figs. Dashed rectangles and light-blue bars represent the regions inverted in the INV-M and INV-L2 alleles. The position of the TZ is marked by pink columns. The heart (mm75) and forebrain (FB1) enhancers are depicted as pink and blue ovals, respectively. The bars below each plot represent the corresponding primary interaction domain.
Figure 6
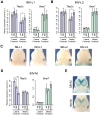
Figure 6. Changes of gene expression in the forebrain following genomic inversion.
Quantification by RT-qPCR of the relative expression levels of the Tfap2c and Bmp7 mRNAs in the lateral and medial forebrain for INV-L1 (A), INV-L2 (B) and INV-M (D), normalized as in Fig. 2. Error bars represent the s.d. of three biological replicates. The statistical significance was assessed by a two-sided Student's t-test. *p<0.05; **p<0.01; ***p<0.001. (C) Absence of LacZ staining in the forebrain of SB/INV-L1 and SB/INV-L2 E11.5 embryos. (E) LacZ staining of SB-A2 (up) and INV-M (bottom) E11.5 embryos.
Figure 7
Figure 7. Structural partitioning controls enhancer-target gene allocation and modulates enhancers' effective activity on target genes.
Genes and enhancers are shown as rectangles and ovals, respectively. Active promoters and enhancers are marked with arrows and plain colors. The TZ organizes the locus into two distinct, partially overlapping spatial conformations (represented by light blue and green circles), where genes and enhancers can interact. In the heart (A) and forebrain (B), this situation prevents action of one enhancer on a gene in the other domain. In the lateral forebrain, enhancers adjacent to FB1 may contribute to Tfap2c expression. In the medial forebrain (C), the active Bmp7 promoter may compete, non productively, for the forebrain enhancer, and interferes (marked by a yellow oval) with its action on Tfap2c. The TZ may control the strength and therefore the consequences of this interference on Tfap2c expression.

Similar articles

Cited by

References

    1. Visel A, Rubin EM, Rubin EM, Pennacchio LA, Pennacchio LA (2009) Genomic views of distant-acting enhancers. Nature 461: 199–205. - PMC - PubMed
    1. Sakabe NJ, Savic D, Nobrega MA (2012) Transcriptional enhancers in development and disease. Genome Biol 13: 238. - PMC - PubMed
    1. De Gobbi M (2006) A Regulatory SNP Causes a Human Genetic Disease by Creating a New Transcriptional Promoter. Science 312: 1215–1217. - PubMed
    1. Montavon T, Thevenet L, Duboule D (2012) Impact of copy number variations (CNVs) on long-range gene regulation at the HoxD locus. Proc Natl Acad Sci U S A 109: 20204–20211. - PMC - PubMed
    1. Peichel CL, Prabhakaran B, Vogt TF (1997) The mouse Ulnaless mutation deregulates posterior HoxD gene expression and alters appendicular patterning. Development 124: 3481–3492. - PubMed

Publication types

MeSH terms

Grants and funding

TT was supported by a Postdoctoral Fellowship from Uehara Memorial Foundation (http://www.ueharazaidan.or.jp) and, subsequently, by Postdoctoral Fellowship for Research Abroad from Japan Society for the Promotion of Science (ID:22-324; http://www.jsps.go.jp/j-ab/). This work was supported by the European Molecular Biology Laboratory. The funders had no role in study design, data collection and analysis, decision to publish, or preparation of the manuscript.

LinkOut - more resources