

iRNA-seq: computational method for genome-wide assessment of acute transcriptional regulation from total RNA-seq data
- PMID: 25564527
- PMCID: PMC4381047
- DOI: 10.1093/nar/gku1365
iRNA-seq: computational method for genome-wide assessment of acute transcriptional regulation from total RNA-seq data
Abstract
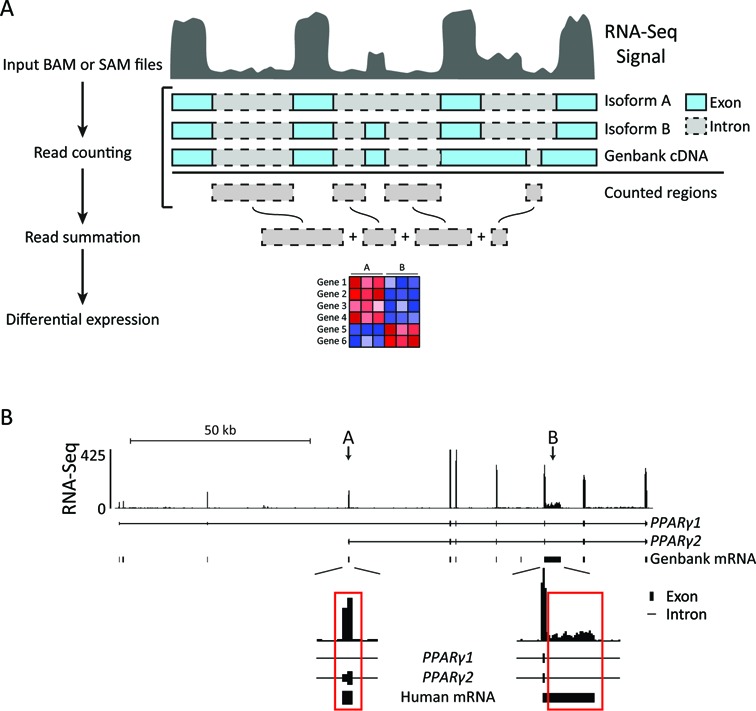
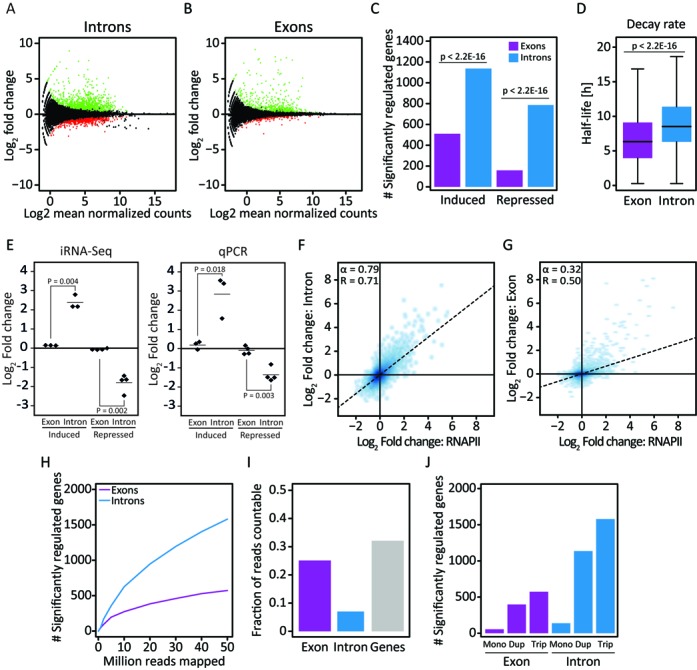
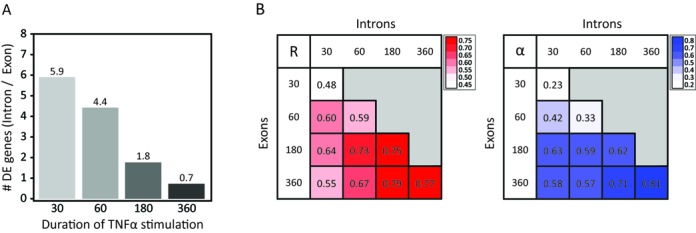
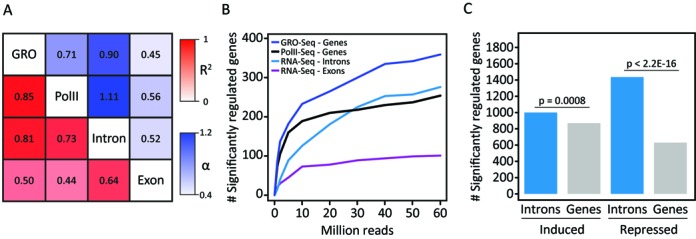
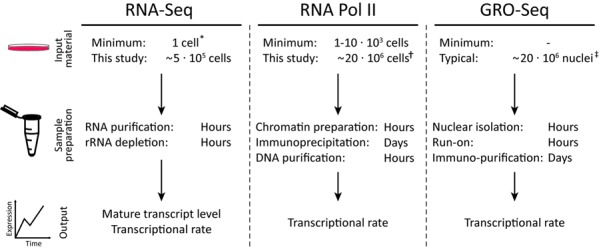
RNA-seq is a sensitive and accurate technique to compare steady-state levels of RNA between different cellular states. However, as it does not provide an account of transcriptional activity per se, other technologies are needed to more precisely determine acute transcriptional responses. Here, we have developed an easy, sensitive and accurate novel computational method, IRNA-SEQ: , for genome-wide assessment of transcriptional activity based on analysis of intron coverage from total RNA-seq data. Comparison of the results derived from iRNA-seq analyses with parallel results derived using current methods for genome-wide determination of transcriptional activity, i.e. global run-on (GRO)-seq and RNA polymerase II (RNAPII) ChIP-seq, demonstrate that iRNA-seq provides similar results in terms of number of regulated genes and their fold change. However, unlike the current methods that are all very labor-intensive and demanding in terms of sample material and technologies, iRNA-seq is cheap and easy and requires very little sample material. In conclusion, iRNA-seq offers an attractive novel alternative to current methods for determination of changes in transcriptional activity at a genome-wide level.
© The Author(s) 2015. Published by Oxford University Press on behalf of Nucleic Acids Research.
Figures

Similar articles
-
High-throughput RNA-seq for allelic or locus-specific expression analysis in Arabidopsis-related species, hybrids, and allotetraploids.Methods Mol Biol. 2014;1112:33-48. doi: 10.1007/978-1-62703-773-0_3. Methods Mol Biol. 2014. PMID: 24478006
-
Comparing next-generation sequencing and microarray technologies in a toxicological study of the effects of aristolochic acid on rat kidneys.Chem Res Toxicol. 2011 Sep 19;24(9):1486-93. doi: 10.1021/tx200103b. Epub 2011 Aug 23. Chem Res Toxicol. 2011. PMID: 21834575
-
Distinguishing States of Arrest: Genome-Wide Descriptions of Cellular Quiescence Using ChIP-Seq and RNA-Seq Analysis.Methods Mol Biol. 2018;1686:215-239. doi: 10.1007/978-1-4939-7371-2_16. Methods Mol Biol. 2018. PMID: 29030824
-
The next generation: using new sequencing technologies to analyse gene regulation.Respirology. 2011 Feb;16(2):210-22. doi: 10.1111/j.1440-1843.2010.01899.x. Respirology. 2011. PMID: 21077988 Review.
-
Measuring differential gene expression with RNA-seq: challenges and strategies for data analysis.Brief Funct Genomics. 2015 Mar;14(2):130-42. doi: 10.1093/bfgp/elu035. Epub 2014 Sep 18. Brief Funct Genomics. 2015. PMID: 25240000 Review.
Cited by
-
The pregnant myometrium is epigenetically activated at contractility-driving gene loci prior to the onset of labor in mice.PLoS Biol. 2020 Jul 15;18(7):e3000710. doi: 10.1371/journal.pbio.3000710. eCollection 2020 Jul. PLoS Biol. 2020. PMID: 32667910 Free PMC article.
-
PR-DUB maintains the expression of critical genes through FOXK1/2- and ASXL1/2/3-dependent recruitment to chromatin and H2AK119ub1 deubiquitination.Genome Res. 2020 Aug;30(8):1119-1130. doi: 10.1101/gr.261016.120. Epub 2020 Aug 3. Genome Res. 2020. PMID: 32747411 Free PMC article.
-
Using iRNA-seq analysis to predict gene expression regulatory level and activity in Zea mays tissues.G3 (Bethesda). 2022 May 30;12(6):jkac086. doi: 10.1093/g3journal/jkac086. G3 (Bethesda). 2022. PMID: 35404453 Free PMC article.
-
Rice nucleosome patterns undergo remodeling coincident with stress-induced gene expression.BMC Genomics. 2018 Jan 26;19(1):97. doi: 10.1186/s12864-017-4397-8. BMC Genomics. 2018. PMID: 29373953 Free PMC article.
-
Rapid and synchronous chemical induction of replicative-like senescence via a small molecule inhibitor.Aging Cell. 2024 Apr;23(4):e14083. doi: 10.1111/acel.14083. Epub 2024 Jan 9. Aging Cell. 2024. PMID: 38196311 Free PMC article.
References
-
- Mortazavi A., Williams B.A., McCue K., Schaeffer L., Wold B. Mapping and quantifying mammalian transcriptomes by RNA-Seq. Nat. Methods. 2008;5:621–628. - PubMed
-
- Wilhelm B.T., Marguerat S., Watt S., Schubert F., Wood V., Goodhead I., Penkett C.J., Rogers J., Bahler J. Dynamic repertoire of a eukaryotic transcriptome surveyed at single-nucleotide resolution. Nature. 2008;453:1239–1243. - PubMed
-
- Cloonan N., Forrest A.R., Kolle G., Gardiner B.B., Faulkner G.J., Brown M.K., Taylor D.F., Steptoe A.L., Wani S., Bethel G., et al. Stem cell transcriptome profiling via massive-scale mRNA sequencing. Nat. Methods. 2008;5:613–619. - PubMed
Publication types
MeSH terms
LinkOut - more resources
Full Text Sources
Other Literature Sources
Molecular Biology Databases
