

Four cation-selective transporters contribute to apical uptake and accumulation of metformin in Caco-2 cell monolayers
- PMID: 25563903
- PMCID: PMC4352590
- DOI: 10.1124/jpet.114.220350
Four cation-selective transporters contribute to apical uptake and accumulation of metformin in Caco-2 cell monolayers
Abstract
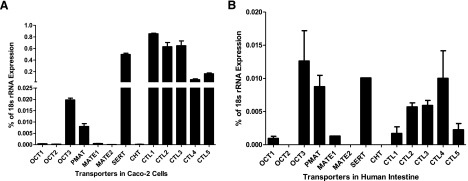
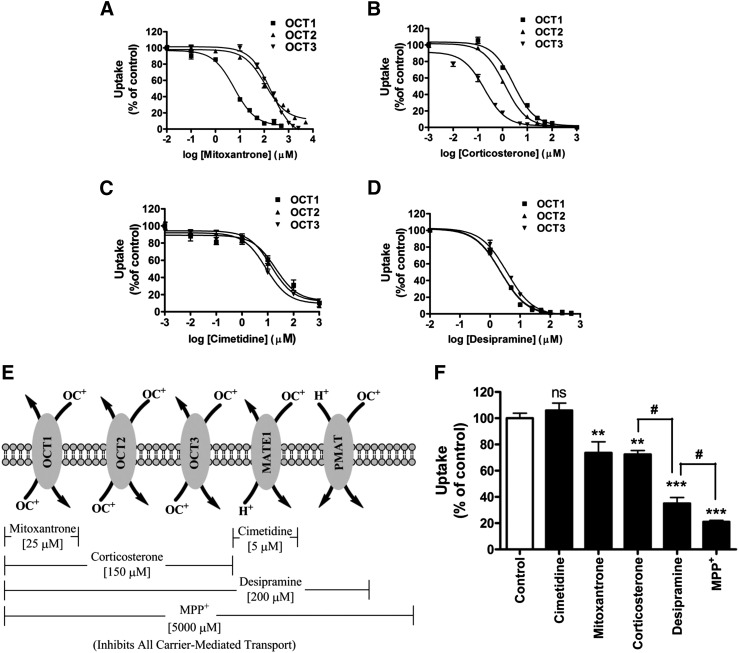
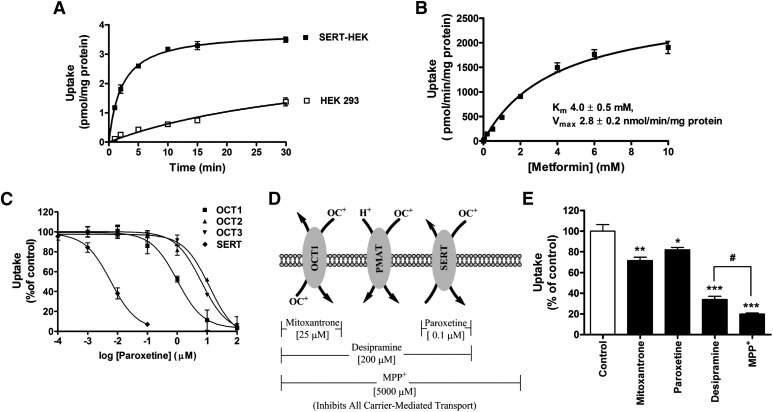
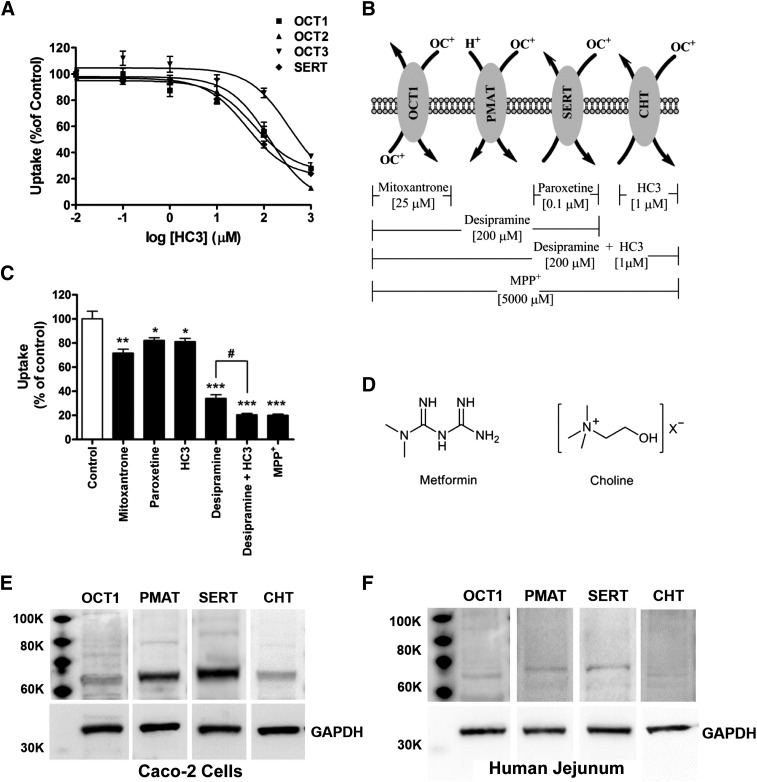
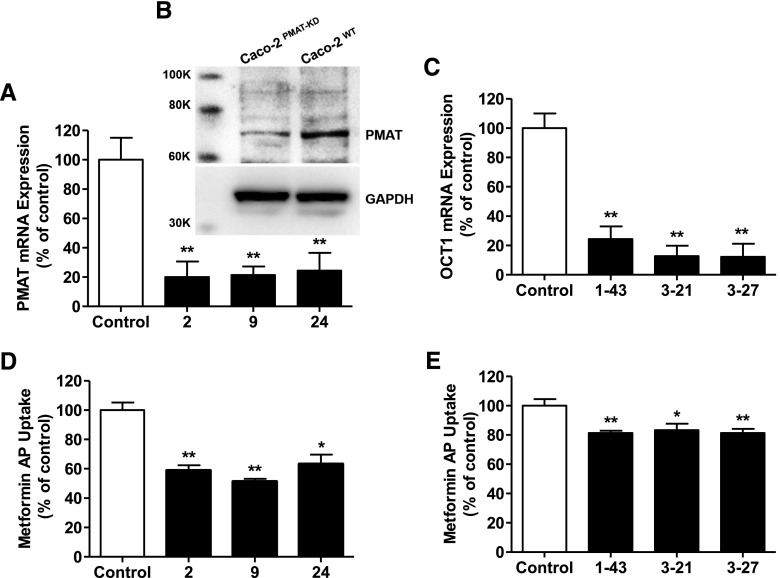
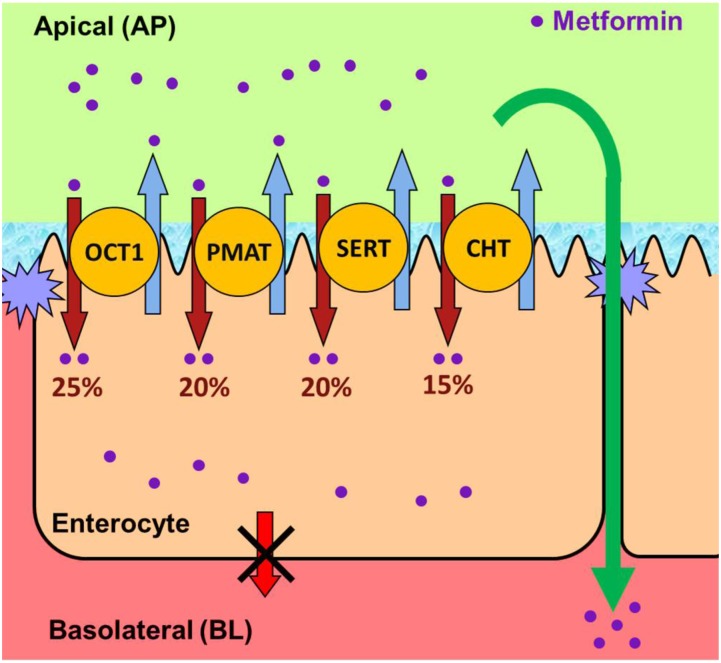
Metformin is the frontline therapy for type II diabetes mellitus. The oral bioavailability of metformin is unexpectedly high, between 40 and 60%, given its hydrophilicity and positive charge at all physiologic pH values. Previous studies in Caco-2 cell monolayers, a cellular model of the human intestinal epithelium, showed that during absorptive transport metformin is taken up into the cells via transporters in the apical (AP) membrane; however, predominant transport to the basolateral (BL) side occurs via the paracellular route because intracellular metformin cannot egress across the BL membrane. Furthermore, these studies have suggested that the AP transporters can contribute to intestinal accumulation and absorption of metformin. Transporter-specific inhibitors as well as a novel approach involving a cocktail of transporter inhibitors with overlapping selectivity were used to identify the AP transporters that mediate metformin uptake in Caco-2 cell monolayers; furthermore, the relative contributions of these transporters in metformin AP uptake were also determined. The organic cation transporter 1, plasma membrane monoamine transporter (PMAT), serotonin reuptake transporter, and choline high-affinity transporter contributed to approximately 25%, 20%, 20%, and 15%, respectively, of the AP uptake of metformin. PMAT-knockdown Caco-2 cells were constructed to confirm the contribution of PMAT in metformin AP uptake because a PMAT-selective inhibitor is not available. The identification of four intestinal transporters that contribute to AP uptake and potentially intestinal absorption of metformin is a significant novel finding that can influence our understanding of metformin pharmacology and intestinal drug-drug interactions involving this highly prescribed drug.
Copyright © 2015 by The American Society for Pharmacology and Experimental Therapeutics.
Figures
Similar articles
-
Metformin transport by a newly cloned proton-stimulated organic cation transporter (plasma membrane monoamine transporter) expressed in human intestine.Drug Metab Dispos. 2007 Oct;35(10):1956-62. doi: 10.1124/dmd.107.015495. Epub 2007 Jun 28. Drug Metab Dispos. 2007. PMID: 17600084 Free PMC article.
-
Mechanisms underlying saturable intestinal absorption of metformin.Drug Metab Dispos. 2008 Aug;36(8):1650-8. doi: 10.1124/dmd.107.020180. Epub 2008 May 5. Drug Metab Dispos. 2008. PMID: 18458049
-
Mechanisms for membrane transport of metformin in human intestinal epithelial Caco-2 cells.Biopharm Drug Dispos. 2011 Jul;32(5):253-60. doi: 10.1002/bdd.755. Epub 2011 May 13. Biopharm Drug Dispos. 2011. PMID: 21567399
-
Pharmacogenetic variation and metformin response.Curr Drug Metab. 2013 Dec;14(10):1070-82. doi: 10.2174/1389200214666131211153933. Curr Drug Metab. 2013. PMID: 24329113 Review.
-
Why Does the Intestine Lack Basolateral Efflux Transporters for Cationic Compounds? A Provocative Hypothesis.J Pharm Sci. 2016 Feb;105(2):484-496. doi: 10.1016/j.xphs.2015.11.040. J Pharm Sci. 2016. PMID: 26869413 Review.
Cited by
-
Organic cation transporters in psychiatric and substance use disorders.Pharmacol Ther. 2024 Jan;253:108574. doi: 10.1016/j.pharmthera.2023.108574. Epub 2023 Dec 9. Pharmacol Ther. 2024. PMID: 38072333 Free PMC article. Review.
-
Pharmacokinetics of metformin in patients with gastrointestinal intolerance.Diabetes Obes Metab. 2018 Jul;20(7):1593-1601. doi: 10.1111/dom.13264. Epub 2018 Mar 23. Diabetes Obes Metab. 2018. PMID: 29457876 Free PMC article. Clinical Trial.
-
Inhibition of mitochondrial function by metformin increases glucose uptake, glycolysis and GDF-15 release from intestinal cells.Sci Rep. 2021 Jan 28;11(1):2529. doi: 10.1038/s41598-021-81349-7. Sci Rep. 2021. PMID: 33510216 Free PMC article.
-
Pharmacogenetics in type 2 diabetes: influence on response to oral hypoglycemic agents.Pharmgenomics Pers Med. 2016 Apr 6;9:17-29. doi: 10.2147/PGPM.S84854. eCollection 2016. Pharmgenomics Pers Med. 2016. PMID: 27103840 Free PMC article. Review.
-
Metformin from mother to unborn child - Are there unwarranted effects?EBioMedicine. 2018 Sep;35:394-404. doi: 10.1016/j.ebiom.2018.08.047. Epub 2018 Aug 27. EBioMedicine. 2018. PMID: 30166273 Free PMC article. Review.
References
-
- Apparsundaram S, Ferguson SM, George AL, Jr, Blakely RD. (2000) Molecular cloning of a human, hemicholinium-3-sensitive choline transporter. Biochem Biophys Res Commun 276:862–867. - PubMed
-
- Bailey CJ, Wilcock C, Scarpello JH. (2008) Metformin and the intestine. Diabetologia 51:1552–1553. - PubMed
-
- Barker EL, Kimmel HL, Blakely RD. (1994) Chimeric human and rat serotonin transporters reveal domains involved in recognition of transporter ligands. Mol Pharmacol 46:799–807. - PubMed
-
- Elimrani I, Lahjouji K, Seidman E, Roy MJ, Mitchell GA, Qureshi I. (2003) Expression and localization of organic cation/carnitine transporter OCTN2 in Caco-2 cells. Am J Physiol Gastrointest Liver Physiol 284:G863–G871. - PubMed
Publication types
MeSH terms
Substances
Grants and funding
LinkOut - more resources
Full Text Sources
Other Literature Sources
Medical
