

Appearance and disappearance of the mRNA signature characteristic of Treg cells in visceral adipose tissue: age, diet, and PPARγ effects
- PMID: 25550516
- PMCID: PMC4299242
- DOI: 10.1073/pnas.1423486112
Appearance and disappearance of the mRNA signature characteristic of Treg cells in visceral adipose tissue: age, diet, and PPARγ effects
Abstract
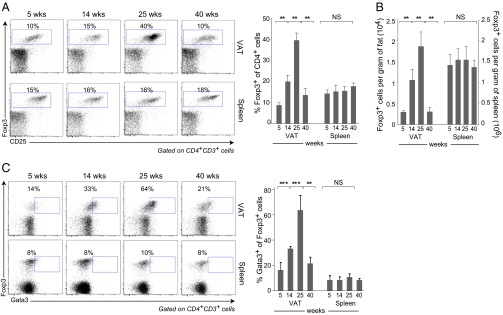
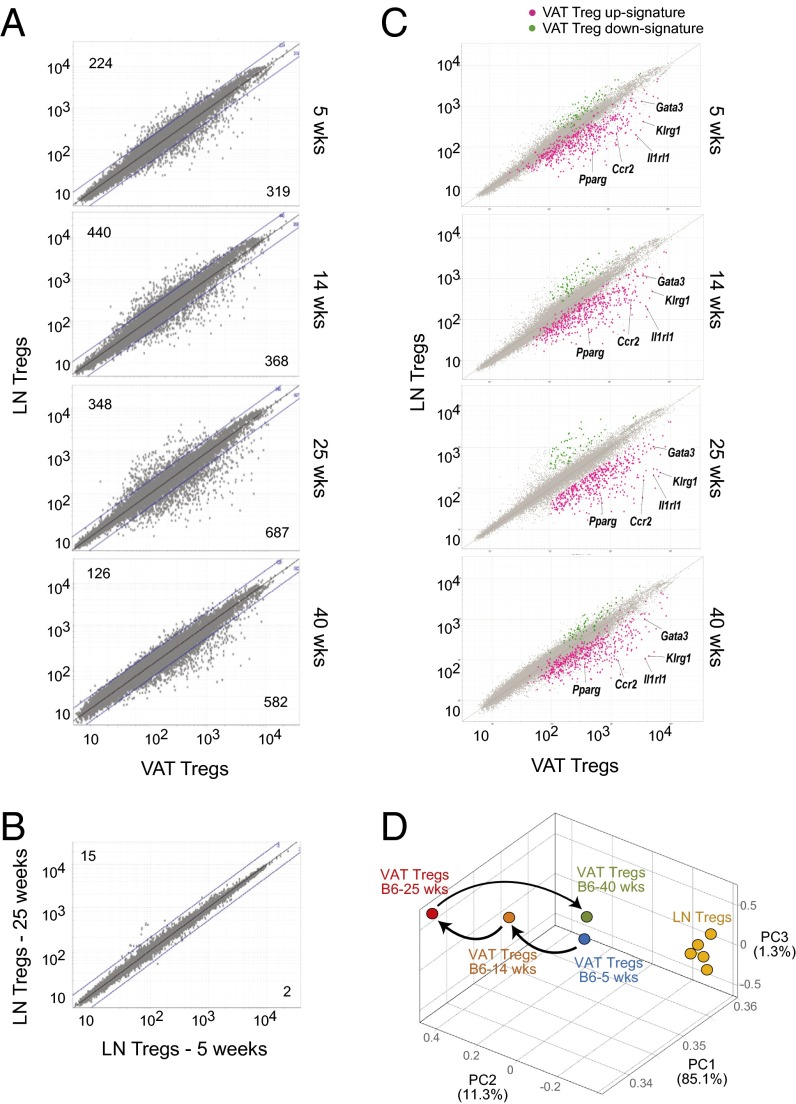
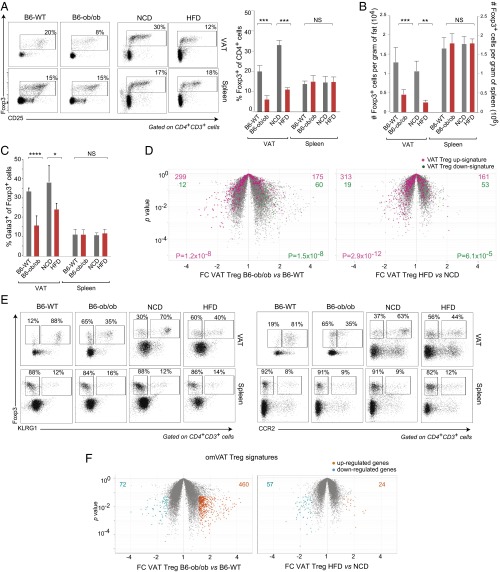
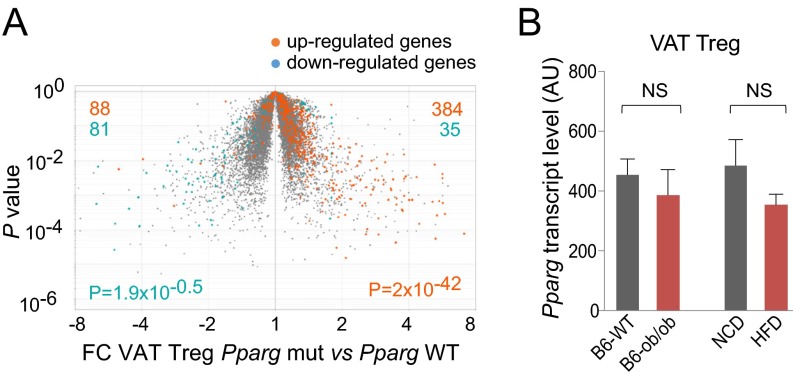
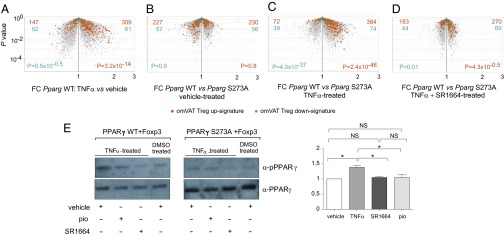
A unique population of Foxp3(+)CD4(+) regulatory T (Treg) cells resides in visceral adipose tissue (VAT) of lean mice, especially in the epididymal fat depot. VAT Tregs are unusual in their very high representation within the CD4(+) T-cell compartment, their transcriptome, and their repertoire of antigen-specific T-cell receptors. They are important regulators of local and systemic inflammation and metabolism. The overall goal of this study was to learn how the VAT Treg transcriptome adapts to different stimuli; in particular, its response to aging in lean mice, to metabolic perturbations associated with obesity, and to certain signaling events routed through PPARγ, the "master-regulator" of adipocyte differentiation. We show that the VAT Treg signature is imposed early in life, well before age-dependent expansion of the adipose-tissue Treg population. VAT Tregs in obese mice lose the signature typical of lean individuals but gain an additional set of over- and underrepresented transcripts. This obese mouse VAT Treg signature depends on phosphorylation of the serine residue at position 273 of PPARγ, in striking parallel to a pathway recently elucidated in adipocytes. These findings are important to consider in designing drugs to target type 2 diabetes and other features of the "metabolic syndrome."
Keywords: Foxp3; inflammation; obesity; regulatory T cell; type 2 diabetes.
Conflict of interest statement
The authors declare no conflict of interest.
Figures
Similar articles
-
Antigen- and cytokine-driven accumulation of regulatory T cells in visceral adipose tissue of lean mice.Cell Metab. 2015 Apr 7;21(4):543-57. doi: 10.1016/j.cmet.2015.03.005. Cell Metab. 2015. PMID: 25863247 Free PMC article.
-
Interleukin-27 signaling resists obesity by promoting the accumulation of Treg cells in visceral adipose tissue.Biochem Biophys Res Commun. 2024 Nov 12;733:150690. doi: 10.1016/j.bbrc.2024.150690. Epub 2024 Sep 11. Biochem Biophys Res Commun. 2024. PMID: 39276693
-
PPAR-γ is a major driver of the accumulation and phenotype of adipose tissue Treg cells.Nature. 2012 Jun 28;486(7404):549-53. doi: 10.1038/nature11132. Nature. 2012. PMID: 22722857 Free PMC article.
-
Fat-resident Tregs: an emerging guard protecting from obesity-associated metabolic disorders.Obes Rev. 2013 Jul;14(7):568-78. doi: 10.1111/obr.12033. Epub 2013 Mar 28. Obes Rev. 2013. PMID: 23534927 Review.
-
Deciphering visceral adipose tissue regulatory T cells: Key contributors to metabolic health.Immunol Rev. 2024 Jul;324(1):52-67. doi: 10.1111/imr.13336. Epub 2024 Apr 26. Immunol Rev. 2024. PMID: 38666618 Review.
Cited by
-
Adipose tissue, immune aging, and cellular senescence.Semin Immunopathol. 2020 Oct;42(5):573-587. doi: 10.1007/s00281-020-00812-1. Epub 2020 Aug 12. Semin Immunopathol. 2020. PMID: 32785750 Free PMC article. Review.
-
ICOS signaling limits regulatory T cell accumulation and function in visceral adipose tissue.J Exp Med. 2021 Jun 7;218(6):e20201142. doi: 10.1084/jem.20201142. J Exp Med. 2021. PMID: 33881452 Free PMC article.
-
Holistic Characterization of Tumor Monocyte-to-Macrophage Differentiation Integrates Distinct Immune Phenotypes in Kidney Cancer.Cancer Immunol Res. 2022 Apr 1;10(4):403-419. doi: 10.1158/2326-6066.CIR-21-0588. Cancer Immunol Res. 2022. PMID: 35181780 Free PMC article.
-
T Cells in Adipose Tissue: Critical Players in Immunometabolism.Front Immunol. 2018 Oct 30;9:2509. doi: 10.3389/fimmu.2018.02509. eCollection 2018. Front Immunol. 2018. PMID: 30459770 Free PMC article. Review.
-
Specific Biological Features of Adipose Tissue, and Their Impact on HIV Persistence.Front Microbiol. 2019 Dec 17;10:2837. doi: 10.3389/fmicb.2019.02837. eCollection 2019. Front Microbiol. 2019. PMID: 31921023 Free PMC article. Review.
References
-
- Osborn O, Olefsky JM. The cellular and signaling networks linking the immune system and metabolism in disease. Nat Med. 2012;18(3):363–374. - PubMed
Publication types
MeSH terms
Substances
Grants and funding
LinkOut - more resources
Full Text Sources
Other Literature Sources
Medical
Molecular Biology Databases
Research Materials
