

Acute myeloid leukemia ontogeny is defined by distinct somatic mutations
- PMID: 25550361
- PMCID: PMC4342352
- DOI: 10.1182/blood-2014-11-610543
Acute myeloid leukemia ontogeny is defined by distinct somatic mutations
Abstract
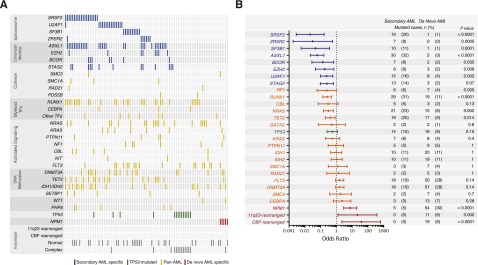
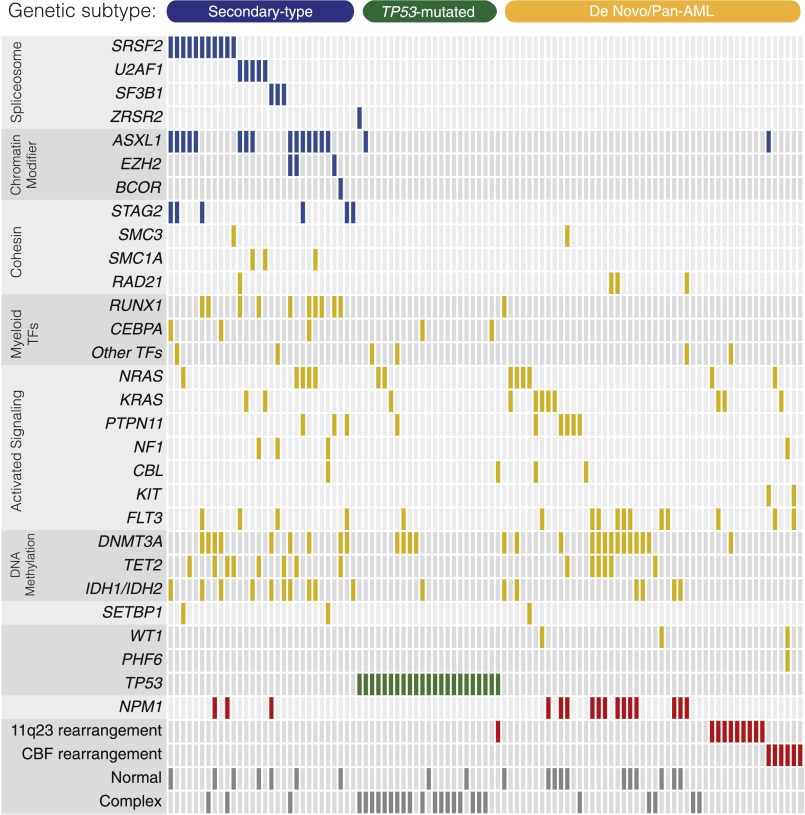
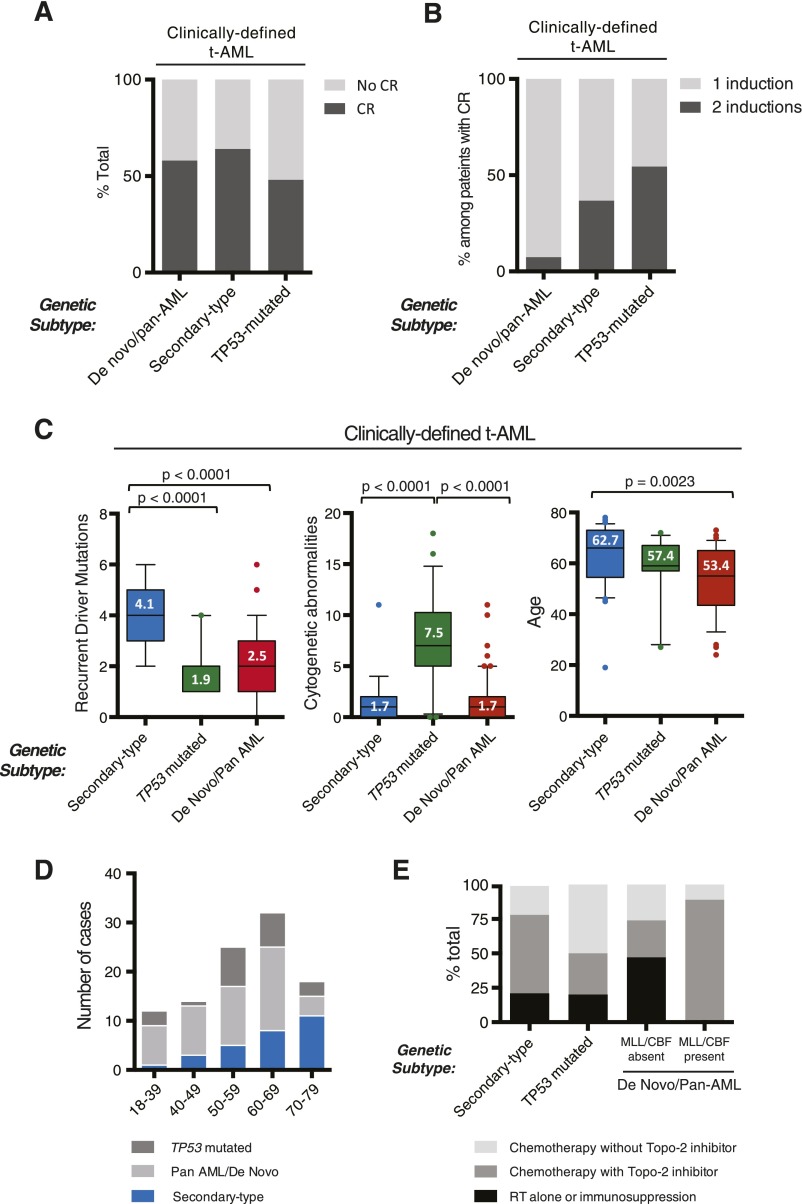
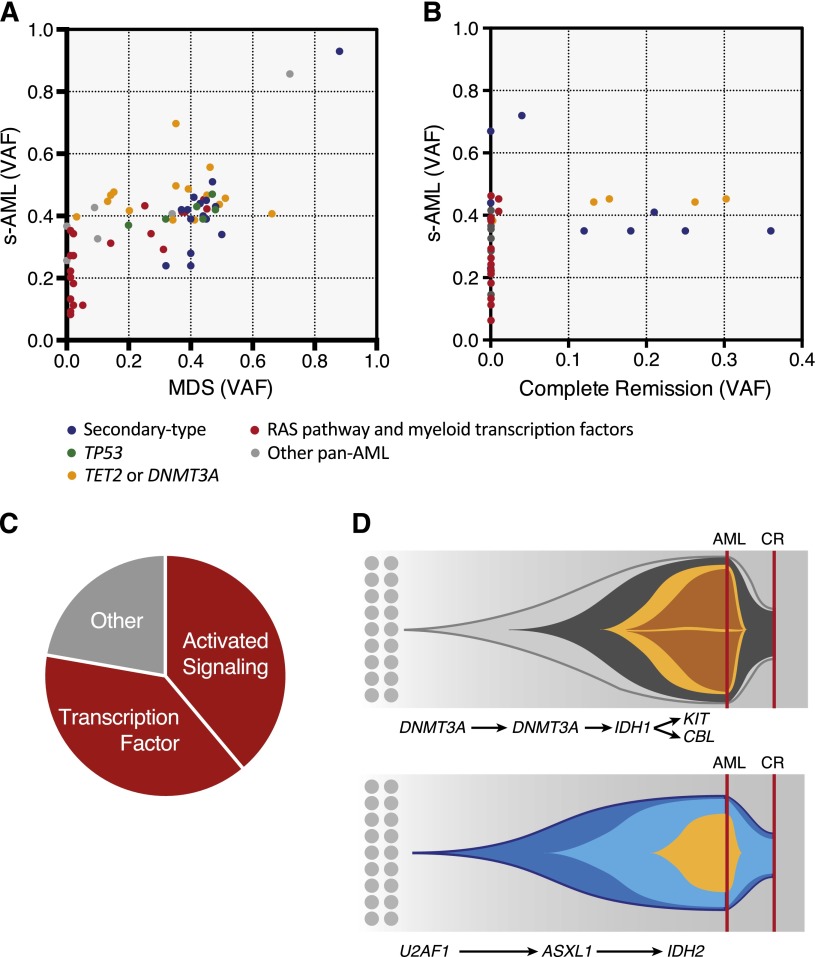
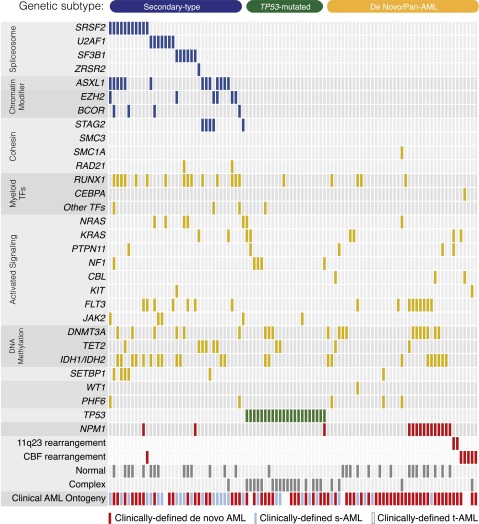
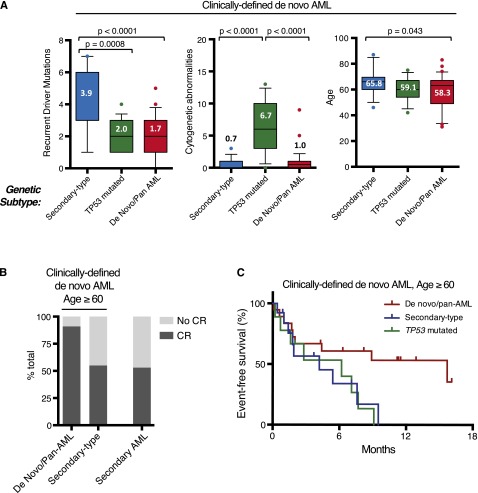
Acute myeloid leukemia (AML) can develop after an antecedent myeloid malignancy (secondary AML [s-AML]), after leukemogenic therapy (therapy-related AML [t-AML]), or without an identifiable prodrome or known exposure (de novo AML). The genetic basis of these distinct pathways of AML development has not been determined. We performed targeted mutational analysis of 194 patients with rigorously defined s-AML or t-AML and 105 unselected AML patients. The presence of a mutation in SRSF2, SF3B1, U2AF1, ZRSR2, ASXL1, EZH2, BCOR, or STAG2 was >95% specific for the diagnosis of s-AML. Analysis of serial samples from individual patients revealed that these mutations occur early in leukemogenesis and often persist in clonal remissions. In t-AML and elderly de novo AML populations, these alterations define a distinct genetic subtype that shares clinicopathologic properties with clinically confirmed s-AML and highlights a subset of patients with worse clinical outcomes, including a lower complete remission rate, more frequent reinduction, and decreased event-free survival. This trial was registered at www.clinicaltrials.gov as #NCT00715637.
© 2015 by The American Society of Hematology.
Figures
Comment in
-
What came first: MDS or AML?Blood. 2015 Feb 26;125(9):1357-8. doi: 10.1182/blood-2015-01-621193. Blood. 2015. PMID: 25721039
Similar articles
-
Alteration of the SETBP1 gene and splicing pathway genes SF3B1, U2AF1, and SRSF2 in childhood acute myeloid leukemia.Ann Lab Med. 2015 Jan;35(1):118-22. doi: 10.3343/alm.2015.35.1.118. Epub 2014 Dec 8. Ann Lab Med. 2015. PMID: 25553291 Free PMC article.
-
Clinical Evaluation of a Novel Nine-Gene Panel for Ion Torrent PGM Sequencing of Myeloid Malignancies.Mol Diagn Ther. 2016 Feb;20(1):27-32. doi: 10.1007/s40291-015-0172-1. Mol Diagn Ther. 2016. PMID: 26476543
-
Next-generation sequencing of acute myeloid leukemia identifies the significance of TP53, U2AF1, ASXL1, and TET2 mutations.Mod Pathol. 2015 May;28(5):706-14. doi: 10.1038/modpathol.2014.160. Epub 2014 Nov 21. Mod Pathol. 2015. PMID: 25412851 Free PMC article.
-
[Research progress on genes associated with transformation of myelodysplastic syndromes to acute myeloid leukemia].Zhongguo Shi Yan Xue Ye Xue Za Zhi. 2014 Jun;22(3):873-8. doi: 10.7534/j.issn.1009-2137.2014.03.057. Zhongguo Shi Yan Xue Ye Xue Za Zhi. 2014. PMID: 24989313 Review. Chinese.
-
Splice factor mutations and alternative splicing as drivers of hematopoietic malignancy.Immunol Rev. 2015 Jan;263(1):257-78. doi: 10.1111/imr.12241. Immunol Rev. 2015. PMID: 25510282 Review.
Cited by
-
Hypomethylating agents plus venetoclax compared with intensive induction chemotherapy regimens in molecularly defined secondary AML.Leukemia. 2024 Apr;38(4):762-768. doi: 10.1038/s41375-024-02175-0. Epub 2024 Feb 20. Leukemia. 2024. PMID: 38378841
-
Effect of DNMT3A variant allele frequency and double mutation on clinicopathologic features of patients with de novo AML.Blood Adv. 2021 Jun 8;5(11):2539-2549. doi: 10.1182/bloodadvances.2021004250. Blood Adv. 2021. PMID: 34100902 Free PMC article.
-
Two rare cases of acute myeloid leukemia with t(8;16)(p11.2;p13.3) and 1q duplication: case presentation and literature review.Mol Cytogenet. 2020 Aug 25;13:37. doi: 10.1186/s13039-020-00507-0. eCollection 2020. Mol Cytogenet. 2020. PMID: 32863883 Free PMC article.
-
Novel insights and therapeutic approaches in secondary AML.Front Oncol. 2024 Jul 29;14:1400461. doi: 10.3389/fonc.2024.1400461. eCollection 2024. Front Oncol. 2024. PMID: 39135995 Free PMC article. Review.
-
Therapy-Related Myeloid Neoplasms: Predisposition and Clonal Evolution.Mediterr J Hematol Infect Dis. 2023 Nov 1;15(1):e2023064. doi: 10.4084/MJHID.2023.064. eCollection 2023. Mediterr J Hematol Infect Dis. 2023. PMID: 38028397 Free PMC article. Review.
References
-
- Pfirrmann M, Ehninger G, Thiede C, et al. Study Alliance Leukaemia (SAL) Prediction of post-remission survival in acute myeloid leukaemia: a post-hoc analysis of the AML96 trial. Lancet Oncol. 2012;13(2):207–214. - PubMed
-
- Kantarjian H, O’Brien S, Cortes J, et al. Results of intensive chemotherapy in 998 patients age 65 years or older with acute myeloid leukemia or high-risk myelodysplastic syndrome: predictive prognostic models for outcome. Cancer. 2006;106(5):1090–1098. - PubMed
Publication types
MeSH terms
Substances
Associated data
Grants and funding
LinkOut - more resources
Full Text Sources
Other Literature Sources
Medical
