. 2015 Mar;35(6):939-55.
doi: 10.1128/MCB.01183-14. Epub 2014 Dec 29.

2-Deoxyglucose impairs Saccharomyces cerevisiae growth by stimulating Snf1-regulated and α-arrestin-mediated trafficking of hexose transporters 1 and 3

Affiliations

2-Deoxyglucose impairs Saccharomyces cerevisiae growth by stimulating Snf1-regulated and α-arrestin-mediated trafficking of hexose transporters 1 and 3

Allyson F O'Donnell et al. Mol Cell Biol. 2015 Mar.

Abstract

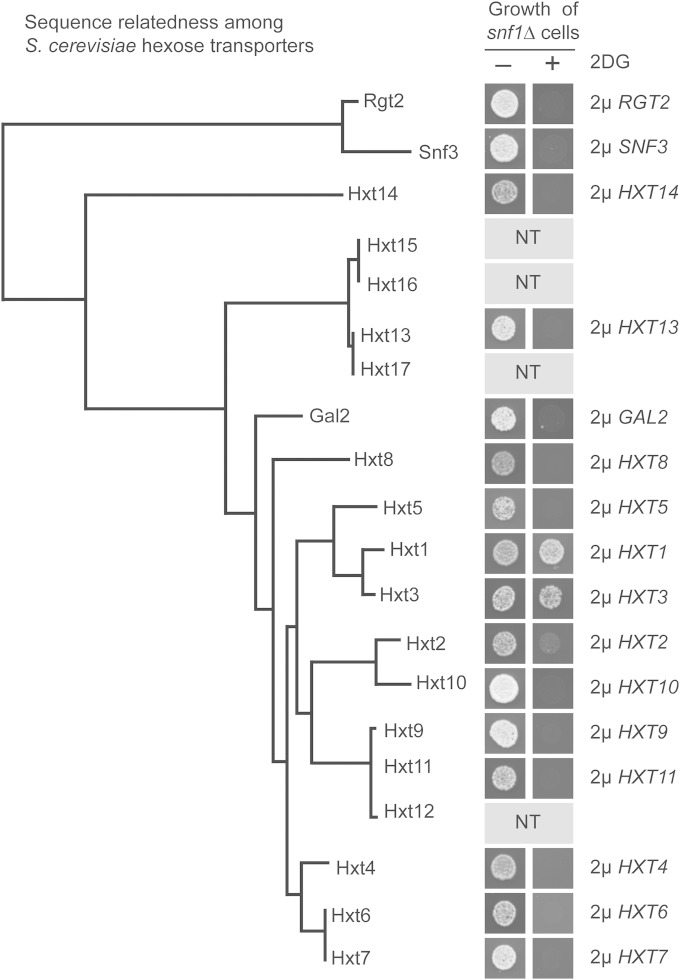
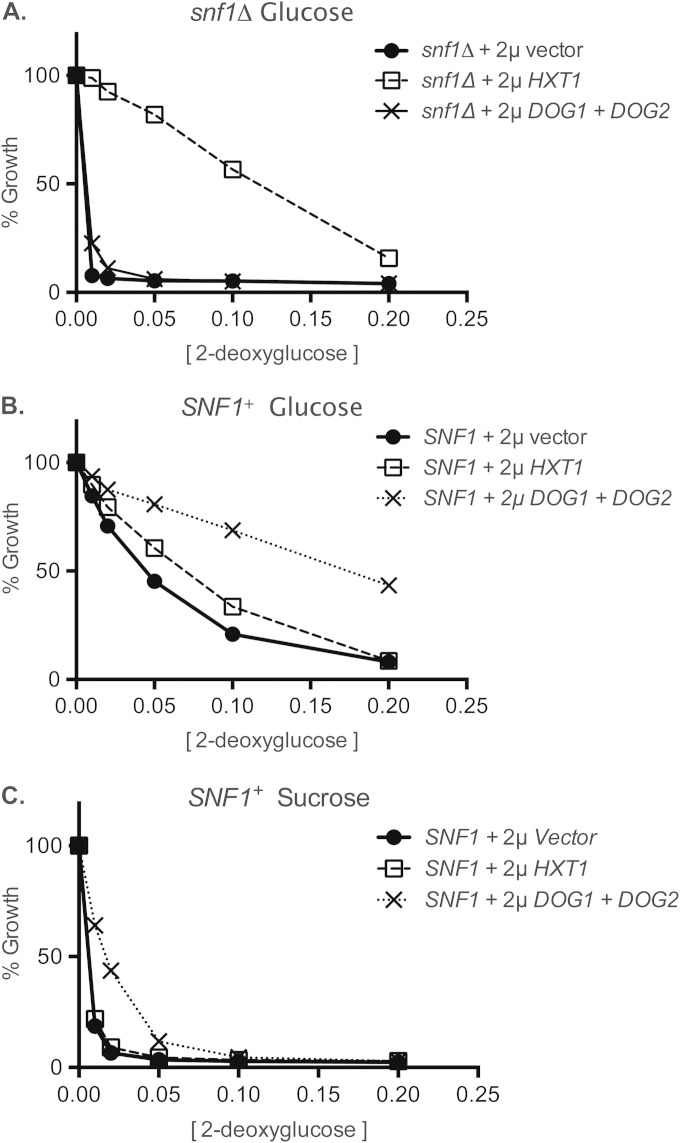
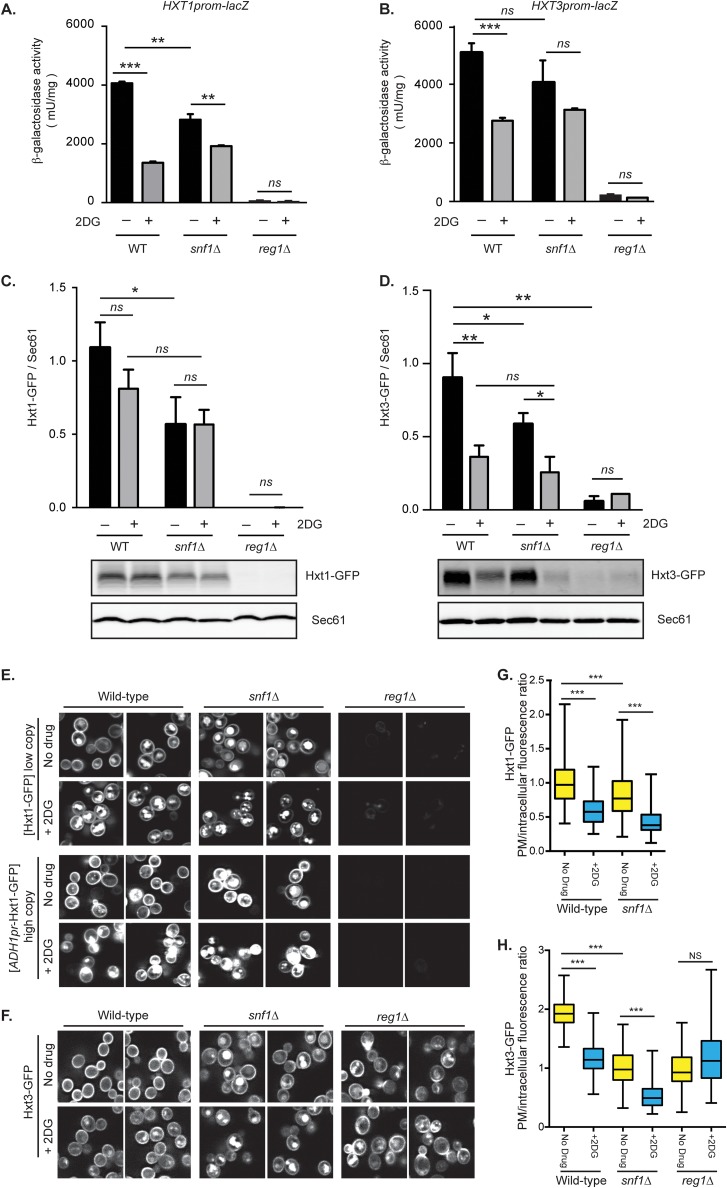
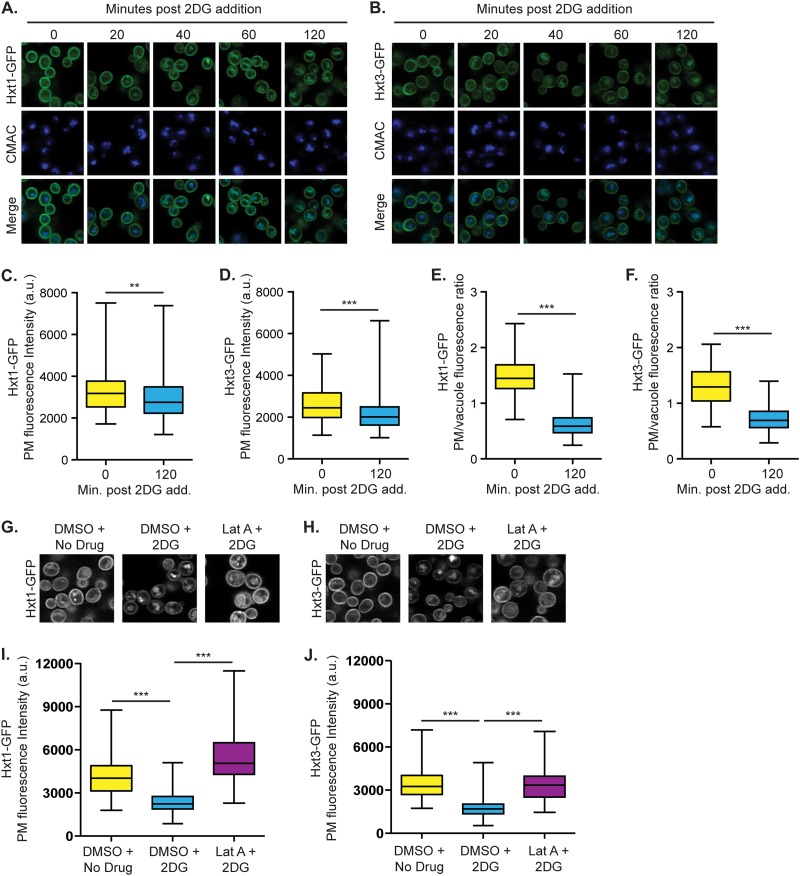
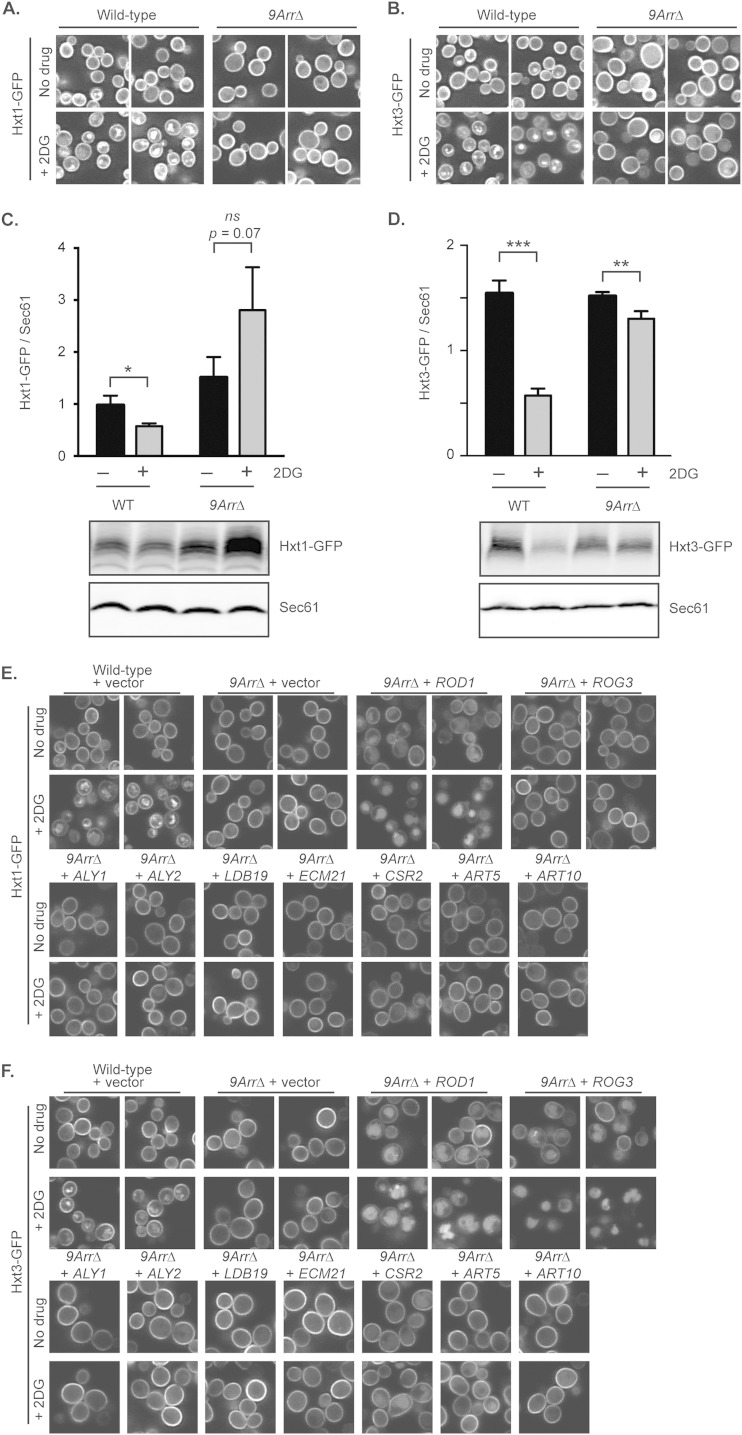
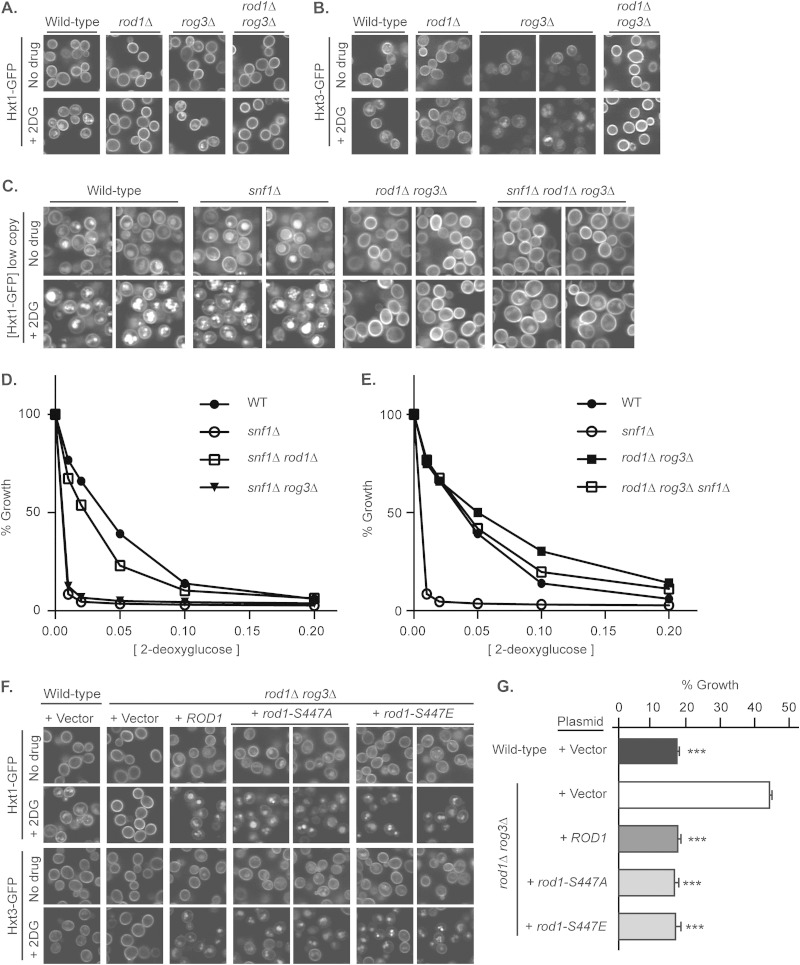
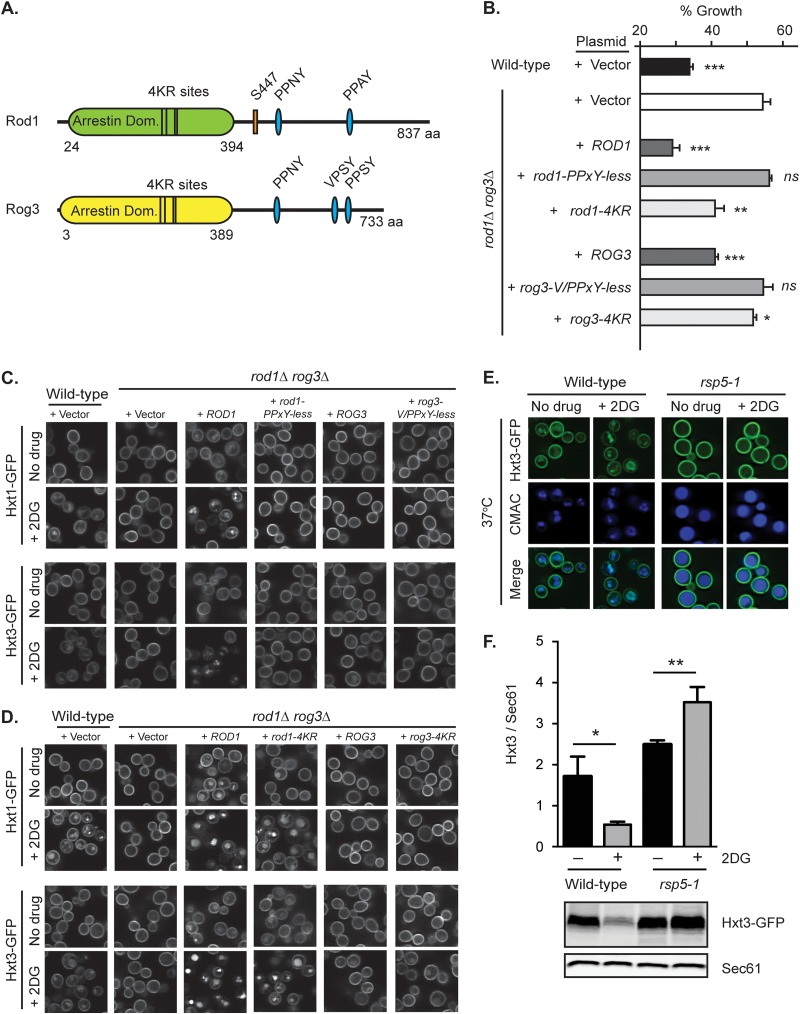
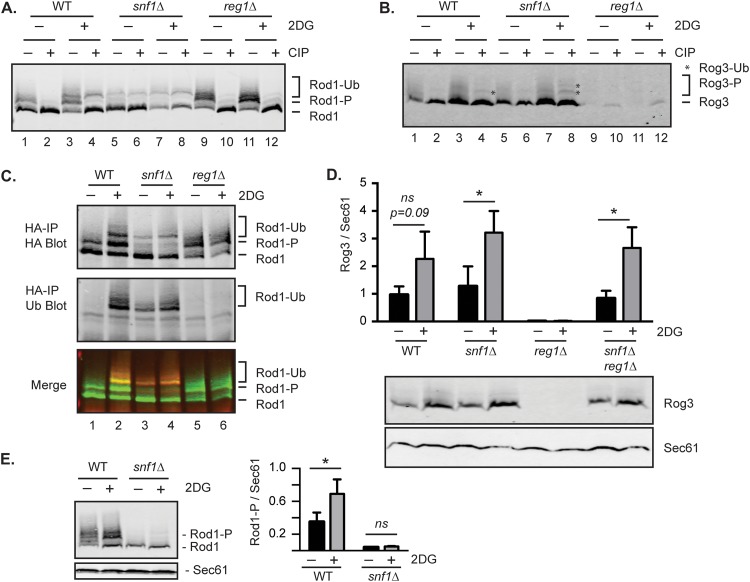
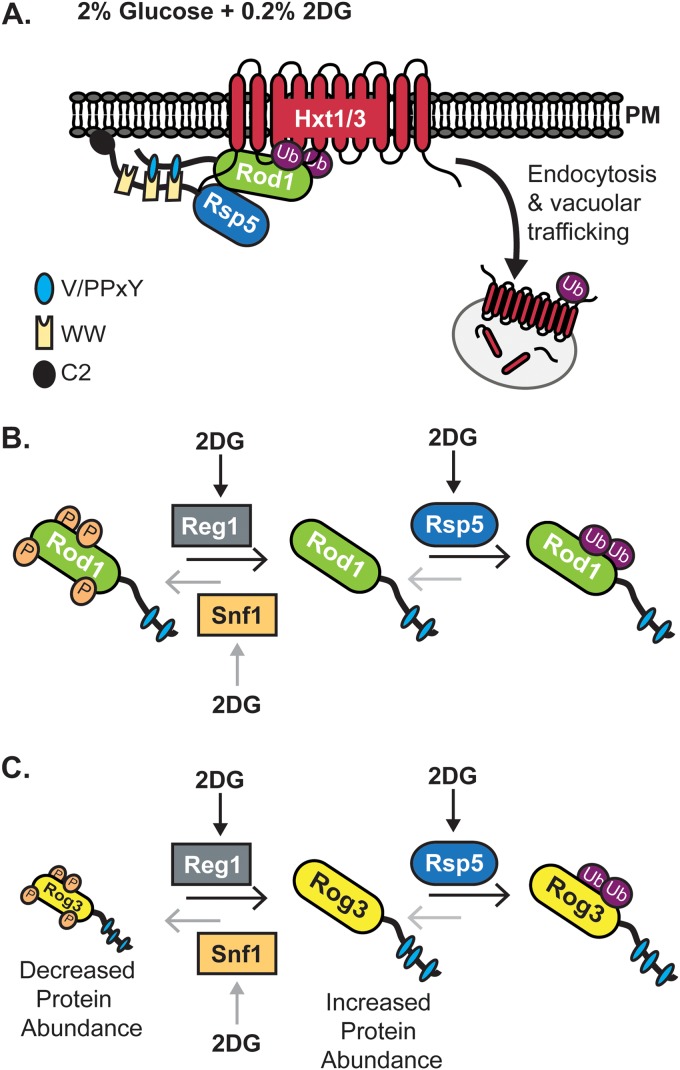
The glucose analog 2-deoxyglucose (2DG) inhibits the growth of Saccharomyces cerevisiae and human tumor cells, but its modes of action have not been fully elucidated. Yeast cells lacking Snf1 (AMP-activated protein kinase) are hypersensitive to 2DG. Overexpression of either of two low-affinity, high-capacity glucose transporters, Hxt1 and Hxt3, suppresses the 2DG hypersensitivity of snf1Δ cells. The addition of 2DG or the loss of Snf1 reduces HXT1 and HXT3 expression levels and stimulates transporter endocytosis and degradation in the vacuole. 2DG-stimulated trafficking of Hxt1 and Hxt3 requires Rod1/Art4 and Rog3/Art7, two members of the α-arrestin trafficking adaptor family. Mutations in ROD1 and ROG3 that block binding to the ubiquitin ligase Rsp5 eliminate Rod1- and Rog3-mediated trafficking of Hxt1 and Hxt3. Genetic analysis suggests that Snf1 negatively regulates both Rod1 and Rog3, but via different mechanisms. Snf1 activated by 2DG phosphorylates Rod1 but fails to phosphorylate other known targets, such as the transcriptional repressor Mig1. We propose a novel mechanism for 2DG-induced toxicity whereby 2DG stimulates the modification of α-arrestins, which promote glucose transporter internalization and degradation, causing glucose starvation even when cells are in a glucose-rich environment.


Figures

FIG 1
FIG 1
Hexose transporters of S. cerevisiae and suppression of 2DG hypersensitivity in snf1Δ cells. (Left) A dendrogram of the 20 yeast hexose transporters based on their amino acid sequence relatedness was generated using ClustalW (83). (Right) Growth was assayed in snf1Δ cells with overexpressed HXT genes in medium with (+) or without (−) 2DG. NT, not tested, because the gene was not in the overexpression library (28).
FIG 2
FIG 2
Effect of overexpression of HXT1 or DOG1 plus DOG2 on 2DG resistance. Cells were transformed with high-copy-number plasmids expressing either HXT1, DOG1 and DOG2, or an empty vector. 2DG resistance was assayed in snf1Δ cells growing on glucose (A) or in wild-type cells growing on glucose (B) or on sucrose (C).
FIG 3
FIG 3
Effects of 2DG on HXT1 and HXT3. (A and B) Extracts were prepared from wild-type (WT), snf1Δ, and reg1Δ cells containing either pHXT1prom-lacZ or pHXT3prom-lacZ as indicated. Mean β-galactosidase activities ± standard errors were plotted for cells grown with or without 0.05% 2DG. (C and D) Protein extracts were prepared from wild-type, snf1Δ, and reg1Δ cells with a chromosomal HXT1-GFP or HXT3-GFP gene, with or without 2DG, for 2 h. Proteins were analyzed by immunoblotting, and the mean Hxt-GFP/Sec61 ratios ± standard errors from triplicate samples were plotted. (E and F) Wild-type, snf1Δ, and reg1Δ cells containing either Hxt1-GFP, expressed from the endogenous HXT1 promoter or from the ADH1 promoter (E), or a chromosomal HXT3-GFP gene (F) were examined after 2 h of treatment with 0.2% glucose (no drug) or 0.2% 2DG. (G and H) The PM and intracellular GFP fluorescence intensities from the cells depicted in panels E and F, respectively, were quantified, and the distributions of the PM/intracellular GFP fluorescence ratios were plotted (n, >110 cells). The horizontal midline represents the median; the box is bounded by the upper and lower quartiles; and the whiskers denote the maximal and minimal fluorescence intensities. *, P < 0.05; **, P < 0.01; ***, P < 0.001; NS or ns, P > 0.05.
FIG 4
FIG 4
2DG promotes the vacuolar localization of Hxt1 and Hxt3. (A and B) Wild-type cells with integrated Hxt1-GFP or Hxt3-GFP were stained with CMAC blue and were treated with 2DG. Images were captured at the times indicated after 2DG addition. (C and D) The mean PM fluorescence intensities of Hxt1-GFP or Hxt3-GFP before and 120 min after 0.2% 2DG addition were measured, and the distributions of these intensities were plotted. (E and F) The ratio of cell surface fluorescence to vacuolar fluorescence for Hxt1-GFP or Hxt3-GFP was determined (n, >150 cells), and the distributions of these ratios were plotted. (G and H) Wild-type cells with integrated Hxt1-GFP or Hxt3-GFP were imaged after treatment with either 200 μM latrunculin A or the vehicle control DMSO for 2 h, followed by incubation with 0.2% 2DG for 90 min. (I and J) The PM intensities of Hxt1-GFP or Hxt3-GFP were measured (n, >110 cells), and the distributions were plotted. a.u., arbitrary units. For the box plots in panels C, D, E, F, I, and J, the horizontal midline in each box represents the median, the box is bounded by the upper and lower quartiles, and the whiskers denote the maximal and minimal fluorescence intensities. **, P < 0.01; ***, P < 0.001.
FIG 5
FIG 5
Hxt1 and Hxt3 vacuolar trafficking is regulated by α-arrestins. (A and B) Wild-type cells or cells lacking nine α-arrestin genes (9ArrΔ) containing integrated Hxt1-GFP or Hxt3-GFP were examined before or 2 h after 0.2% 2DG addition. (C and D) Protein extracts were prepared in triplicate from cells treated as for the experiments for which results are shown in panels A and B. Extracts were assessed by immunoblotting with anti-GFP and anti-Sec61 antibodies. The mean ratios of Hxt1-GFP or Hxt3-GFP to Sec61 ± standard errors were plotted. (E and F) Wild-type or 9ArrΔ cells with integrated Hxt1-GFP (E) or Hxt3-GFP (F) and containing pRS316 (+ vector) or expressing the indicated α-arrestin were imaged either before (no drug) or after a 2-h treatment with 0.2% 2DG. *, P < 0.05; **, P < 0.01; ***, P < 0.001; ns, P > 0.05.
FIG 6
FIG 6
Deletion of ROD1 and ROG3 prevents the trafficking of hexose transporters to the vacuole and suppresses the 2DG hypersensitivity of snf1Δ cells. (A to C) Cells of the indicated genotypes containing integrated Hxt1-GFP (A), Hxt3-GFP (B), or pRS315-Hxt1-GFP (C) were imaged either before (no drug) or after a 2-h treatment with 0.2% 2DG. (D and E) Cells of the indicated genotypes were assayed for 2DG sensitivity. (F) Wild-type or rod1Δ rog3Δ cells containing integrated Hxt1-GFP or Hxt3-GFP were transformed with the indicated plasmids and were imaged either before (no drug) or after a 2-h treatment with 0.2% 2DG. (G) The cells imaged in panel F were assayed for sensitivity to 0.1% 2DG. Mean values from triplicate samples ± standard errors were plotted, and statistical significance in comparison to the value for rod1Δ rog3Δ cells transformed with vector was evaluated. ***, P < 0.001.
FIG 7
FIG 7
Rsp5 is required for the induction of vacuolar trafficking. (A) Schematic diagrams of Rod1 and Rog3. Numbers indicate amino acids. The arrestin-fold domains (Arrestin Dom.) were defined by Phyre2 structural predictions (84). The positions of the Rsp5 binding sites (VPXY and PPXY motifs), the putative Snf1-dependent phosphorylation site at S447, and the 4 conserved lysine residues that are changed to arginine (4KR sites) in order to block ubiquitination (38, 67) are indicated. (B) Wild-type or rod1Δ rog3Δ cells were transformed with the indicated plasmids and were assayed for sensitivity to 0.1% 2DG. Mean values from triplicate samples ± standard errors were plotted. (C and D) Wild-type or rod1Δ rog3Δ cells containing integrated Hxt1-GFP or Hxt3-GFP and transformed with the indicated plasmids were imaged before (no drug) or after a 2-h treatment with 0.2% 2DG. (E) Wild-type or rsp5-1 cells containing integrated Hxt3-GFP were imaged before (no drug) or after a 2-h treatment with 0.2% 2DG at 37°C. (F) Protein extracts were prepared in triplicate from cells treated as in the experiment for which results are shown in panel E. The extracts were assessed by immunoblotting with anti-GFP and anti-Sec61 antibodies. The mean ratios of Hxt3-GFP to Sec61 ± standard errors were plotted. *, P < 0.05; **, P < 0.01; ***, P < 0.001; ns, P > 0.05.
FIG 8
FIG 8
Posttranslational modifications of Rod1 and Rog3 in response to 2DG. (A and B) Cultures of wild-type, snf1Δ, or reg1Δ cells expressing either Rod1-3×HA (A) or Rog3-3×HA (B) were grown to mid-log phase and then were either left untreated or treated with 0.2% 2DG for 2 h. Protein extracts were incubated with or without calf intestinal alkaline phosphatase (CIP) prior to immunoblotting. Rod1-P, phosphorylated Rod1; Rod1-Ub, ubiquitinated Rod1. Asterisks indicate the CIP-resistant, slower-migrating bands of Rog3 that likely represent the Rog3-Ub species. (C) (Top and center) Rod1-3×HA immunoprecipitated (IP) with anti-HA antibodies was examined by immunoblotting with antiubiquitin and anti-HA antibodies. (Bottom) Merged image with overlapping signals shown in yellow. (D) The abundance of Rog3-3×HA protein was examined in cells of the indicated genotypes that were either left untreated or treated with 0.2% 2DG. The abundance of Rog3 was normalized to that of Sec61, and the mean ratios from triplicate samples ± standard errors were plotted. Representative blots are shown below the graph. (E) The phosphorylation of Rod1-3×HA protein was examined in wild-type and snf1Δ cells either left untreated or treated with 0.2% 2DG. The abundance of Rod1-P was normalized to that of Sec61, and the mean ratios from triplicate samples ± standard errors were plotted. Representative blots are shown on the left of the graph. *, P < 0.05; ns, P > 0.05.
FIG 9
FIG 9
Model for α-arrestin-mediated regulation of hexose transporter abundance and localization. (A) In response to 2DG, Rod1 ubiquitination increases, suggesting increased binding between Rod1 and Rsp5 through their respective PPXY motifs and WW domains. Rsp5 membrane association is mediated by the Ca2+-dependent lipid/protein binding (C2) domain. The Rod1-Rsp5 complex directs the ubiquitination and endocytosis of Hxt1/3. Hxt1/3 are subsequently trafficked to the vacuole, where they are degraded. (B) Rod1 regulation and posttranslational modifications. In response to 2DG, Snf1 is modestly activated and Rod1 phosphorylation increases (gray arrows). Under high-glucose conditions, the phosphorylation of Rod1 by Snf1 inhibits its trafficking function. In response to 2DG, Rod1 ubiquitination increases, promoting the internalization of hexose transporters, suggesting that an alternative, Snf1-counterbalancing pathway, such as the Reg1/Glc7 phosphatase, must also be activated by 2DG (black arrows). (C) Rog3 regulation and posttranslational modifications. In response to 2DG, Rog3 protein levels, and possibly Rog3 ubiquitination, are increased. In the absence of Reg1, Snf1 kinase hyperactivation promotes Rog3 degradation.

Similar articles

Cited by

References

    1. Chu S, DeRisi J, Eisen M, Mulholland J, Botstein D, Brown PO, Herskowitz I. 1998. The transcriptional program of sporulation in budding yeast. Science 282:699–705. doi:10.1126/science.282.5389.699. - DOI - PubMed
    1. Gasch AP, Werner-Washburne M. 2002. The genomics of yeast responses to environmental stress and starvation. Funct Integr Genomics 2:181–192. doi:10.1007/s10142-002-0058-2. - DOI - PubMed
    1. Griffin TJ, Gygi SP, Ideker T, Rist B, Eng J, Hood L, Aebersold R. 2002. Complementary profiling of gene expression at the transcriptome and proteome levels in Saccharomyces cerevisiae. Mol Cell Proteomics 1:323–333. doi:10.1074/mcp.M200001-MCP200. - DOI - PubMed
    1. Hardwick JS, Kuruvilla FG, Tong JK, Shamji AF, Schreiber SL. 1999. Rapamycin-modulated transcription defines the subset of nutrient-sensitive signaling pathways directly controlled by the Tor proteins. Proc Natl Acad Sci U S A 96:14866–14870. doi:10.1073/pnas.96.26.14866. - DOI - PMC - PubMed
    1. Washburn MP, Koller A, Oshiro G, Ulaszek RR, Plouffe D, Deciu C, Winzeler E, Yates JR III. 2003. Protein pathway and complex clustering of correlated mRNA and protein expression analyses in Saccharomyces cerevisiae. Proc Natl Acad Sci U S A 100:3107–3112. doi:10.1073/pnas.0634629100. - DOI - PMC - PubMed

Publication types

MeSH terms